# Anomalia Machina 5: Application Monitoring with Prometheus
[Blog](/blog/)>[Technology](/blog/category/technical/)>Anomalia Machina 5: Application Monitoring with Prometheus
Anomalia Machina 5: Application Monitoring with Prometheus
==========================================================
December 19, 2018 | By [ Paul Brebner](https://www.instaclustr.com/blog/author/paul-brebner/)
[ ](https://x.com/intent/tweet?text=Anomalia%20Machina%205:%20Application%20Monitoring%20with%20Prometheus&url=https://www.instaclustr.com/blog/anomalia-machina-5-1-application-monitoring-prometheus/) [ ](https://www.linkedin.com/shareArticle?mini=true&url=https://www.instaclustr.com/blog/anomalia-machina-5-1-application-monitoring-prometheus/&title=&summary=Anomalia%20Machina%205:%20Application%20Monitoring%20with%20Prometheus&source=)
### **1. Introduction**
In order to scale Anomalia Machina we plan to run the application (load generator and detector pipeline) on multiple EC2 instances. We are working on using Kubernetes (AWS EKS) to automate this, and progress so far is described in [this webinar](https://www.brighttalk.com/webcast/15283/336504). However, before we can easily run a Kubernetes deployed application at scale we need to be able to collect and view application-specific metrics from distributed instances. In this blog, we’ll explore how an Open Source monitoring tool called Prometheus could do this.

Exactly two hundred years ago, Mary Shelley’s 1818 “Frankenstein” was oddly subtitled “The Modern Prometheus”. Who was the original Prometheus? Prometheus was one of the Greek Titans who was responsible for creating and giving gifts to creatures.
By the time he got around to people the supply of approved gifts (e.g. fur, claws, feathers, wings, etc.) had run out, so Prometheus decided to steal the sacred fire from Mount Olympus so humans could keep warm (and eat cooked meat, etc.). There is a [giant mosaic on the Melbourne fire brigade building](https://melbournedaily.blogspot.com/2012/03/melbourne-fire-brigade-mosaic.html) showing Prometheus stealing fire from Zeus:
*(Source: Dreamstime)*
This didn’t turn out so well for either Prometheus (who was punished by being chained to a rock and attacked by a liver-eating eagle every day), or humans (who were given another “gift”, Pandora – don’t open the box!). Here’s the panel to the right of the above mosaic showing the destructive side of fire resulting from Pandora’s curiosity:
*(Source: Dreamstime)*
So Frankenstein and Prometheus are both responsible for creating monsters. But what does Prometheus have to do with *monitoring*? Well, Prometheus didn’t really steal fire, as the original was still there. He just copied it. This is like monitoring, as we don’t want to impact the system being monitored, just gain insight into it at a distance.
### **2. Prometheus Overview**
[Prometheus](https://prometheus.io/) is a popular open source monitoring and alerting system. It was [developed originally by SoundCloud](https://developers.soundcloud.com/blog/prometheus-monitoring-at-soundcloud), made Open Source and then in 2016 was accepted as the [2nd project in the Cloud Native Computing Foundation (CNCF).](https://www.cncf.io/announcement/2018/08/09/prometheus-graduates/)
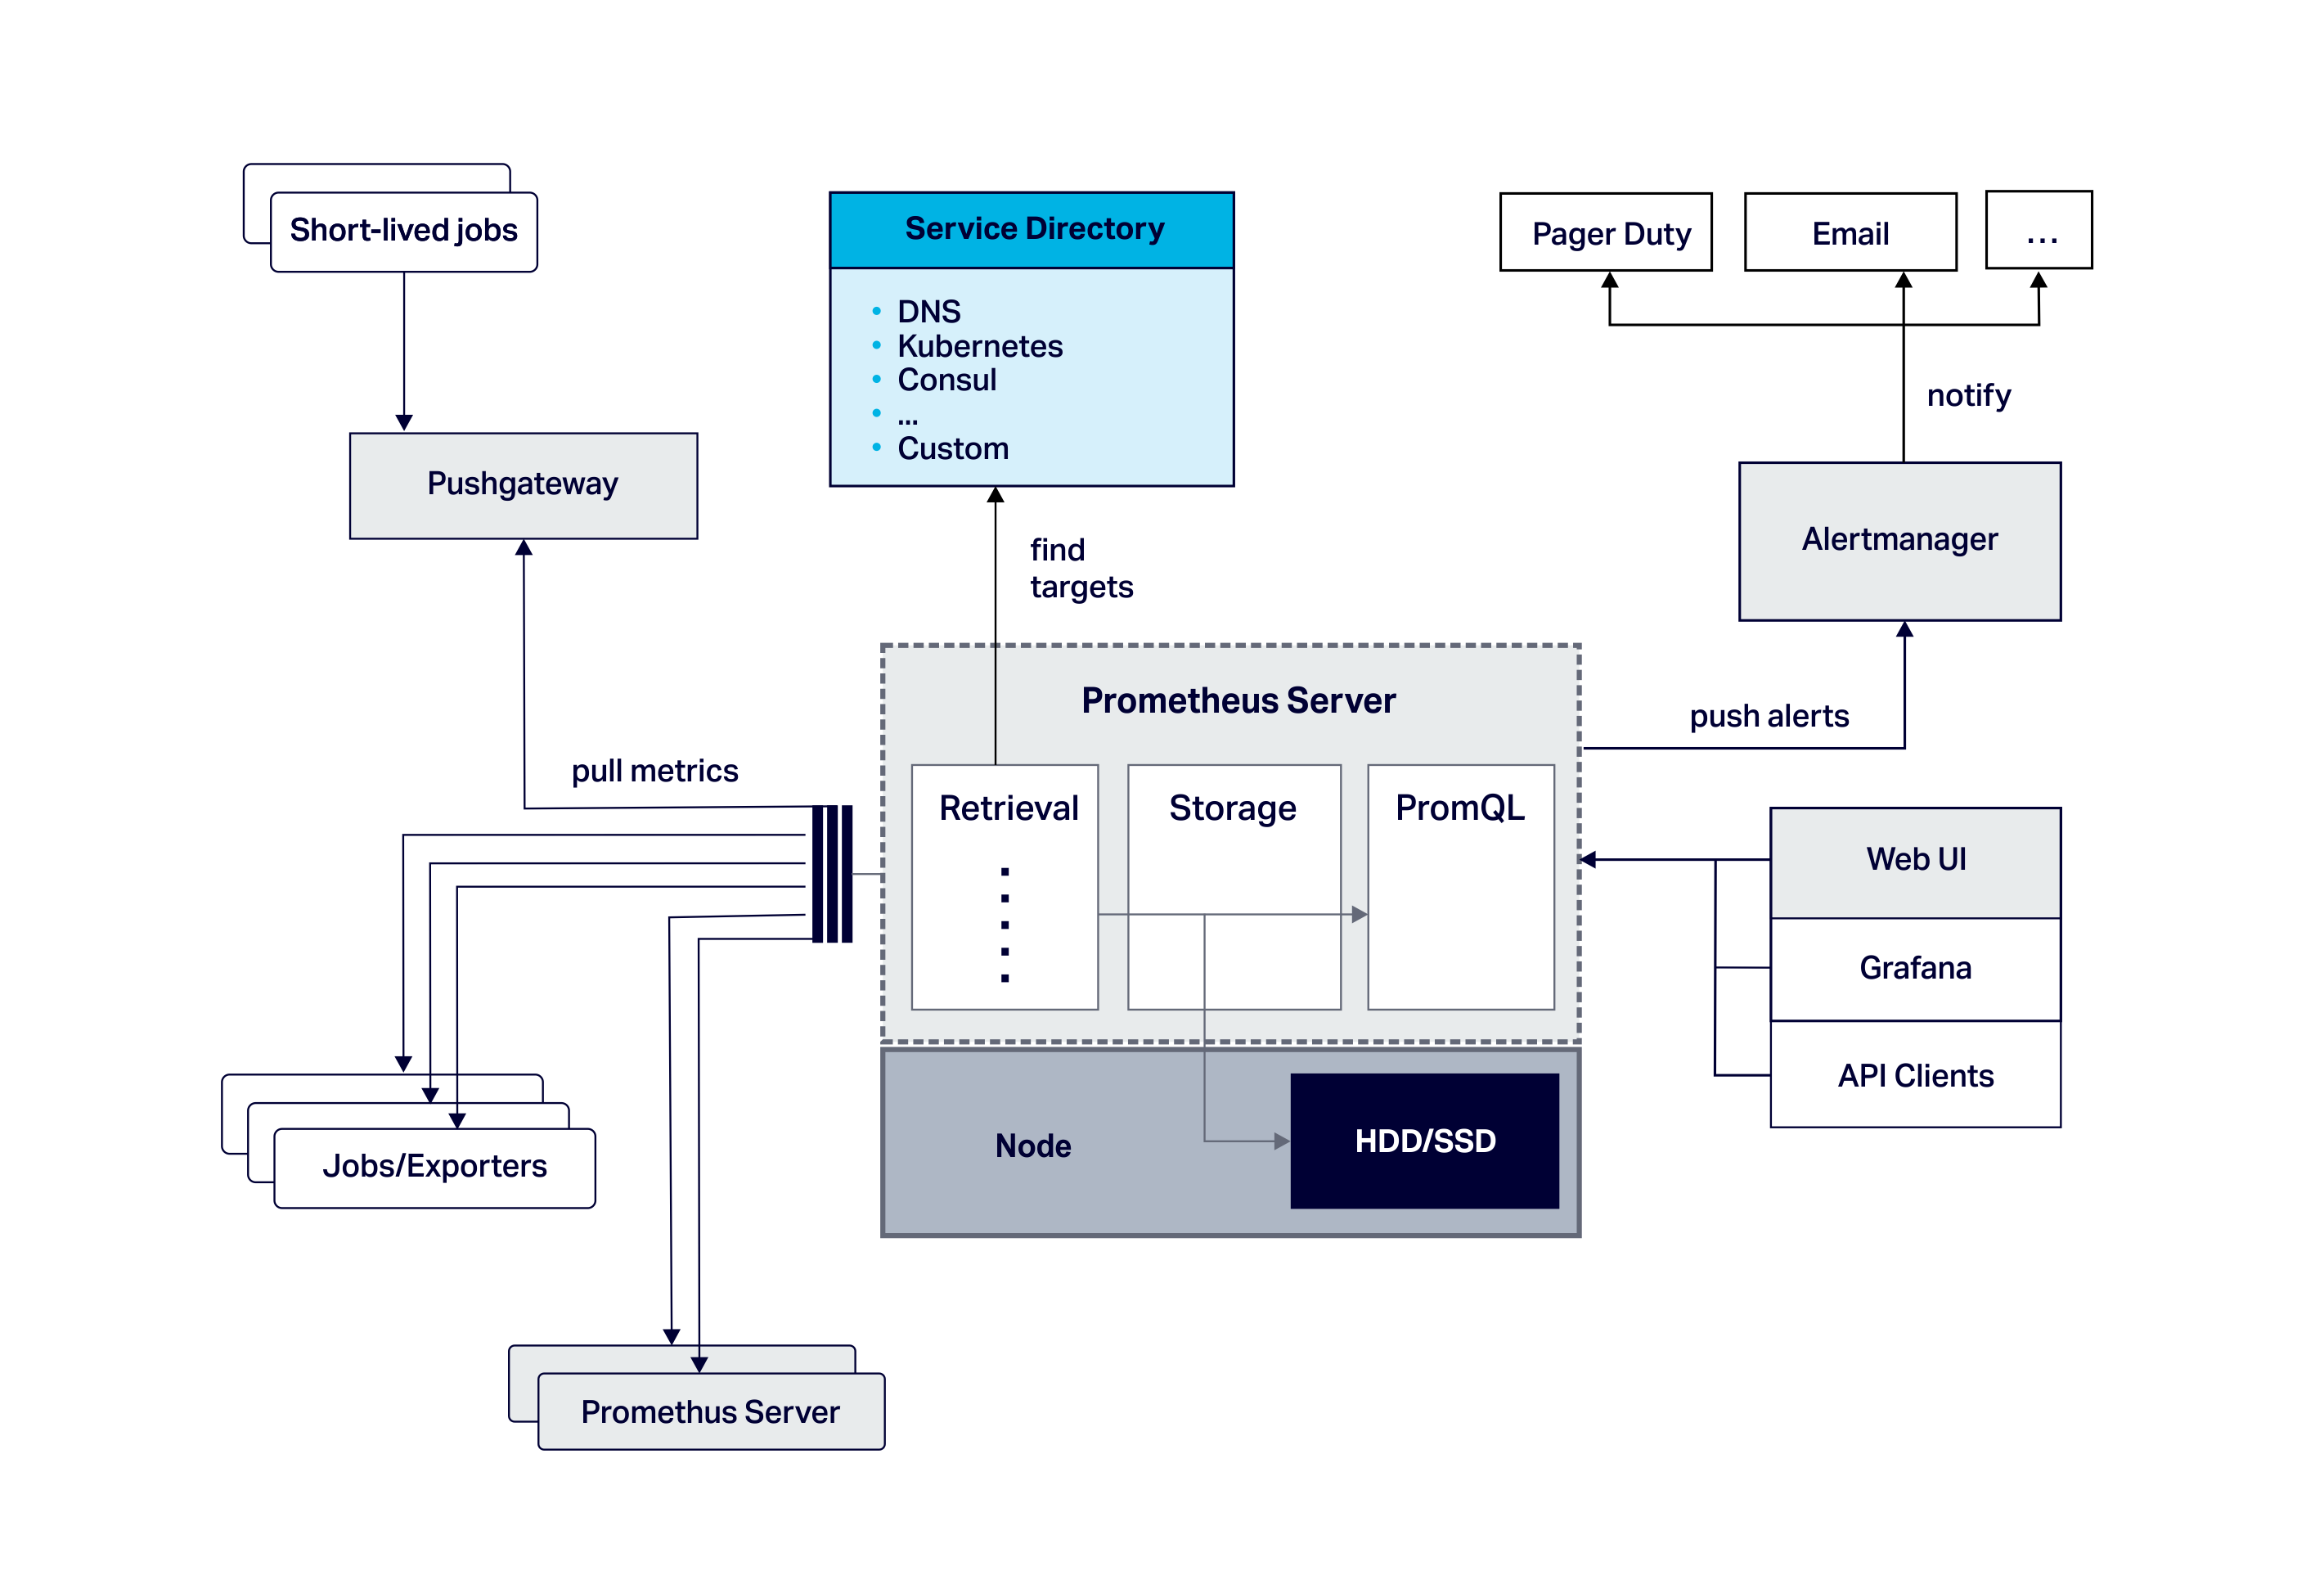
It is intended for monitoring both applications and servers. Here’s what the Prometheus architecture looks like:
### **2.1 Prometheus Components**
The main components are the Prometheus server (responsible for service discovery, retrieving metrics from monitored applications, storing metrics, and analysis of time series data with PromQL, a query language), a metrics data model, a built-in simple graphing GUI, and native support for Grafana.
There’s also an optional alert manager (with alerts defined by the query language), and an optional push gateway (for short-lived application monitoring).
Application monitoring tools typically take one of three approaches to capturing metrics:
1. **Instrumentation**—special custom code has to be added to the source code of the application being monitored
2. **Agents**—special general-purpose code is added to the application environment, which automatically captures standard application metrics
3. **Spying**—which relies on either interceptors or network taps to observe calls or data flow between systems.
Prometheus allows for a combination of (1) Instrumentation and (2) Agents (which are called Exporters). Instrumentation requires access to the source code, but does allow for the capture of custom metrics, and is programming language agnostic.
There are [client libraries](https://prometheus.io/docs/instrumenting/clientlibs/) for instrumenting applications in many programming languages: with four officially supported client libraries (Go, Java/Scala, Python, Ruby); many unofficial libraries (anyone for LISP?); or you can write your own.
The [Exporters](https://prometheus.io/docs/instrumenting/exporters/) allow for automatic instrumentation of supported third-party software, and lots are available for databases, hardware, messaging systems, storage, HTTP, cloud APIs, logging, monitoring and more. The [JMX exporter ](https://github.com/prometheus/jmx_exporter)exposes metrics for JVM-based software. [Some software exposes Prometheus metrics directly](https://prometheus.io/docs/instrumenting/exporters/#software-exposing-prometheus-metrics) so no exporters are needed.
There is a [node exporter](https://prometheus.io/docs/guides/node-exporter/) for monitoring host hardware and kernel metrics, and the [Java client](https://github.com/prometheus/client_java) includes collectors for garbage collection, memory pools, JMX, classloading, and thread counts. These can be added individually or use DefaultExports.initialize(); to conveniently register them all.
### **2.2 What Prometheus doesn’t do**
Prometheus does one thing well—metrics monitoring. Prometheus is therefore not a traditional complete Application Performance Management (APM) solution (c.f. Dynatrace, AppDynamics, etc) as it is focussed on server-side metrics collection, graphing and alerting.
For example, it doesn’t do distributed call tracing or service topology discovery and visualisation, performance analytics, or End User Experience Monitoring (EUEM, but see [this GitHub extension](https://github.com/peardeck/prometheus-user-metrics) which pushes metrics from browsers to Prometheus).
It also doesn’t do active control, as information flow is strictly one way.
Previous R&D such as the Open Geospatial Consortium (OGC) [Sensor Web Enablement](https://www.opengeospatial.org/projects/groups/sensorwebdwg), [SensorML](https://www.opengeospatial.org/pressroom/pressreleases/1971), and extensions I was involved with for graphing sensor data in a web client over XMPP ([CSIRO Sensor and Sensor Networks Research Progress Report July 2006 to June 2007, pp49-50](https://publications.csiro.au/rpr/download?pid=procite:c0aaf7ec-f106-4414-a4ab-a06aeaa0f2ff&dsid=DS1)), and the earlier work on Web Services Grid Computing (e.g. the Globus Toolkit and [WSRF](https://www.globus.org/)), were more grandiose in scope and provided a rich semantics and standards for services based management of both sensors and actuators.
Prometheus runs as only a single server by default, but Prometheus can scale [using federations of servers](https://prometheus.io/docs/prometheus/latest/federation/) – Not to be confused with the musical [Prometheus Scale](https://en.wikipedia.org/wiki/Hexatonic_scale) invented by Scriabin!

The Prometheus Scale (*Source: Wikipedia)*
### **2.3 The Prometheus Data Model**
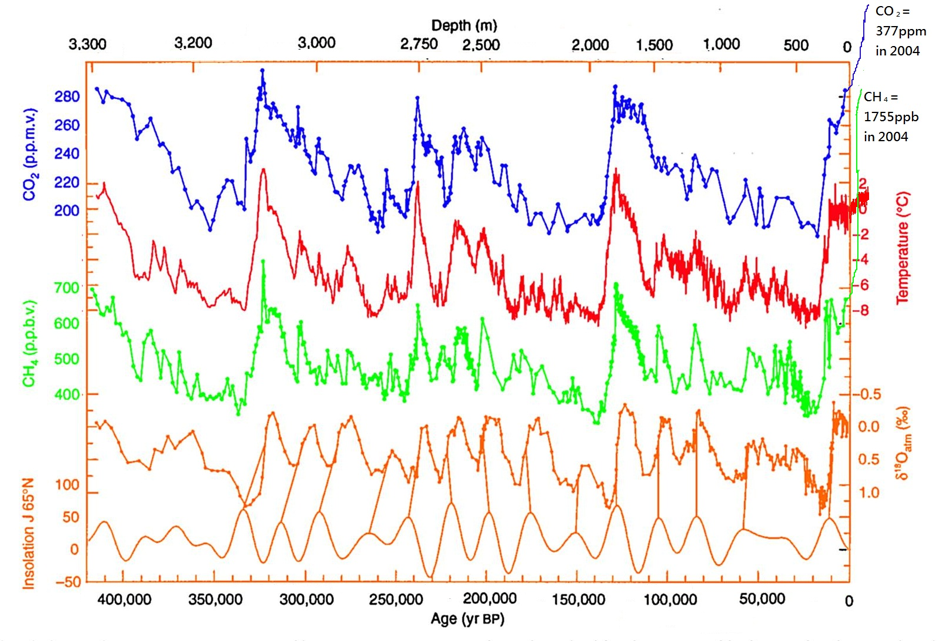
[A time series of 420,000 years of Antarctic ice core data](https://www.antarcticglaciers.org/glaciers-and-climate/ice-cores/ice-core-basics/)
Prometheus [metrics](https://prometheus.io/docs/concepts/data_model/) consist of *time series data*. These are samples of a timestamp (with millisecond precision), and a value (64-bit float).
Every metric has a name and set of key:value pairs (labels). The metric name is a String, and by *convention* includes the name of the thing being monitored, the logical type, and units, e.g. http\_requests\_total, which could have labels for “method” (“GET”, “PUT”) and “handler” (e.g. “/login”, “/search” etc.). Note that Prometheus [automatically adds some labels to metrics,](https://prometheus.io/docs/concepts/jobs_instances/)
- job: The configured job name that the target belongs to.
- instance: The <host>:<port> part of the target’s URL that was scraped.
Note that as units are not explicit, if you need to convert from one unit to another, you will need to do this manually (and carefully!) in the query language. We’ll come to scaping momentarily.
### **2.4 The Prometheus Metric Types**
Prometheus provides four [metric types](https://prometheus.io/docs/concepts/metric_types/) as follows.
*A Counter* is used for increasing values only. A *Gauge* can go up and down, and is useful for the current value of something or counts that can increase and decrease. A *Histogram* samples observations (e.g. request durations or response sizes) and counts them in configurable buckets. It also provides a sum of all observed values.
Similar to a histogram, a *summary* samples observations (e.g. request durations and response sizes). While it also provides a total count of observations and a sum of all observed values, it calculates configurable quantiles over a sliding time window.
### **3. Prometheus Example**
For Anomalia Machina, what exactly do we want to monitor? Here’s the functional architecture diagram from previous blogs:
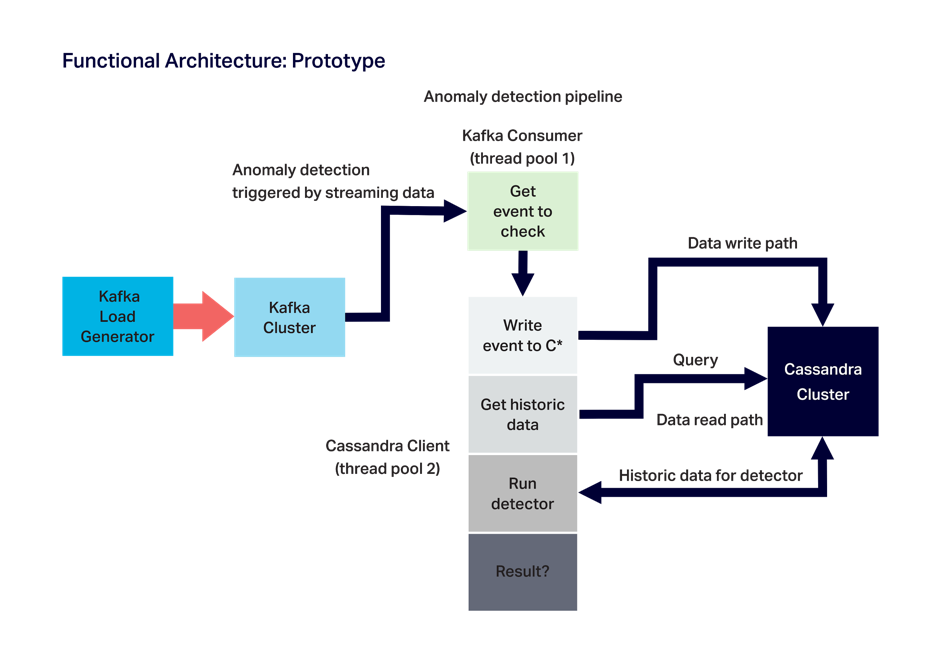
For the application itself, we want to monitor “generic” metrics such as throughput (TPS) and response times (s) for the Kafka load generator (Kafka producer), the Kafka consumer, and the Cassandra client (the anomaly detector).
We also want to monitor some application-specific metrics such as the number of rows returned for each Cassandra read, and the number of anomalies detected.
It would also be nice to monitor hardware metrics for each AWS EC2 instance the application is running on (e.g. CPU), and eventually the Kafka and Cassandra metrics as well, so we can have all the monitoring in one place.
For simplicity and initial testing, we’ll start with a dummy pipeline with 3 methods (producer, consumer, detector).
We use a Counter with the name “prometheusTest\_requests\_total” to measure the number of times each pipeline stage is successfully executed, and a label called “stage” to distinguish the different stage counts (with “total” used for the total pipeline count).
A second counter with the name “prometheusTest\_anomalies\_total” is used to keep track of the number of anomalies detected.
A gauge (which can go up and down) with the name “prometheusTest\_duration\_seconds” is used to record the duration of each stage in seconds (using a label called “stage” to distinguish the stages, and “total” for total pipeline duration).
The methods are instrumented to increment the counter metrics after each successful stage execution or anomaly detected (using the `inc()` method), and time stages and set the value of the gauge metric (using the `setToTime()` method). Here’s the example code:
`import java.io.IOException;`
`import io.prometheus.client.Counter;`
`import io.prometheus.client.Gauge;`
`import io.prometheus.client.exporter.HTTPServer;`
`import io.prometheus.client.hotspot.DefaultExports;`
`// https://github.com/prometheus/client_java`
`// Demo of how we plan to use Prometheus Java client to instrument Anomalia Machina.`
`// Note that the Anomalia Machina application will have Kafka Producer and Kafka consumer and rest of pipeline running in multiple separate processes/instances.`
`// So metrics from each will have different host/port combinations.`
`public class PrometheusBlog { `
`static String appName = "prometheusTest";`
`// counters can only increase in value (until process restart)`
`// Execution count. Use a single Counter for all stages of the pipeline, stages are distinguished by labels`
`static final Counter pipelineCounter = Counter.build()`
` .name(appName + "_requests_total").help("Count of executions of pipeline stages")`
` .labelNames("stage")`
` .register();`
`// in theory could also use pipelineCounter to count anomalies found using another label`
`// but less potential for confusion having another counter. Doesn't need a label`
`static final Counter anomalyCounter = Counter.build()`
` .name(appName + "_anomalies_total").help("Count of anomalies detected")`
` .register();`
`// A Gauge can go up and down, and is used to measure current value of some variable.`
`// pipelineGauge will measure duration in seconds of each stage using labels.`
`static final Gauge pipelineGauge = Gauge.build()`
` .name(appName + "_duration_seconds").help("Gauge of stage durations in seconds")`
` .labelNames("stage")`
` .register();`
` `
`public static void main(String[] args) {`
`// Allow default JVM metrics to be exported `
` DefaultExports.initialize();`
` `
` // Metrics are pulled by Prometheus, create an HTTP server as the endpoint`
` // Note if there are multiple processes running on the same server need to change port number.`
` // And add all IPs and port numbers to the Prometheus configuration file.`
`HTTPServer server = null;`
`try {`
`server = new HTTPServer(1234);`
`} catch (IOException e) {`
`e.printStackTrace();`
`}`
`// now run 1000 executions of the complete pipeline with random time delays and increasing rate`
`int max = 1000;`
`for (int i=0; i < max; i++)`
`{`
`// total time for complete pipeline, and increment anomalyCounter`
`pipelineGauge.labels("total").setToTime(() -> {`
`producer();`
`consumer();`
`if (detector())`
`anomalyCounter.inc();`
`});`
`// total pipeline count`
`pipelineCounter.labels("total").inc();`
`System.out.println("i=" + i);`
` `
`// increase the rate of execution`
`try {`
`Thread.sleep(max-i);`
`} catch (InterruptedException e) {`
`e.printStackTrace();`
`}`
`}`
`server.stop();`
`}`
`// the 3 stages of the pipeline, for each we increase the stage counter and set the Gauge duration time`
`public static void producer() {`
`class Local {};`
`String name = Local.class.getEnclosingMethod().getName();`
`pipelineGauge.labels(name).setToTime(() -> {`
`try {`
`Thread.sleep(1 + (long)(Math.random()*20));`
`} catch (InterruptedException e) {`
`e.printStackTrace();`
`}`
`});`
`pipelineCounter.labels(name).inc();`
` }`
`public static void consumer() {`
`class Local {};`
`String name = Local.class.getEnclosingMethod().getName();`
`pipelineGauge.labels(name).setToTime(() -> {`
`try {`
`Thread.sleep(1 + (long)(Math.random()*10));`
`} catch (InterruptedException e) {`
`e.printStackTrace();`
`}`
`});`
`pipelineCounter.labels(name).inc();`
` }`
`// detector returns true if anomaly detected else false`
`public static boolean detector() {`
`class Local {};`
`String name = Local.class.getEnclosingMethod().getName();`
`pipelineGauge.labels(name).setToTime(() -> {`
`try {`
`Thread.sleep(1 + (long)(Math.random()*200));`
`} catch (InterruptedException e) {`
`e.printStackTrace();`
`}`
`});`
`pipelineCounter.labels(name).inc();`
`return (Math.random() > 0.95);`
` }`
`}`
So, now that we’ve instrumented the sample code how do we run Prometheus, and how does Prometheus actually get the metric values from the code?
As hinted above, unlike many enterprise APM solutions which have metrics pushed to them, Prometheus gets metrics by Polling (or “scraping”) the instrumented code.
In Prometheus, this just means having an HTTP server running in your application code. In the above code, we created an HTTP server on port 1234 to allow Prometheus to scrape the metrics. The Prometheus [getting started](https://prometheus.io/docs/prometheus/latest/getting_started/) guide provides simple instructions on downloading and running Prometheus.
The only things remaining are Maven dependencies:
`\`
``
` io.prometheus`
` simpleclient`
` LATEST`
``
`\`
``
` io.prometheus`
` simpleclient_hotspot`
` LATEST`
``
`\`
``
` io.prometheus`
` simpleclient_httpserver`
` LATEST`
``
`\`
``
` io.prometheus`
` simpleclient_pushgateway`
` LATEST`
``
And finally telling Prometheus where to scrape from. For simple deployments and testing this information can be added to the configuration file (the default file is prometheus.yml):
`global:`
` scrape_interval: 15s # By default, scrape targets every 15 seconds.`
`# scrape_configs has jobs and targets to scrape for each.`
`scrape_configs:`
` # job 1 is for testing prometheus instrumentation from multiple application processes. `
` # The job name is added as a label job= to any timeseries scraped from this config.`
` - job_name: 'testprometheus'`
` # Override the global default and scrape targets from this job every 5 seconds.`
` scrape_interval: 5s`
` `
` # this is where to put multiple targets, e.g. for Kafka load generators and detectors`
` static_configs:`
` - targets: ['localhost:1234', 'localhost:1235']`
` `
` # job 2 provides operating system metrics (e.g. CPU, memory etc).`
` - job_name: 'node'`
` `
` # Override the global default and scrape targets from this job every 5 seconds.`
` scrape_interval: 5s`
` `
` static_configs:`
` - targets: ['localhost:9100']`
In this file, you’ll also notice a job called ‘node’ with a port 9100. This requires the [Prometheus node exporter ](https://prometheus.io/docs/guides/node-exporter/)to be downloaded and run on the server the application is running on in order to provide node metrics.
Polling for metrics has some pros and cons. Polling too frequently may overload the applications, but polling too infrequently may result in unacceptable lags between events occurring and being detected.
However, it makes for a very loosely coupled and robust system as the applications can run without Prometheus, and Prometheus will continue to try to poll an application that is temporarily unavailable until it is available again.
You can even have multiple Prometheus servers polling the same application. If you can’t Poll application metrics for any reason, or the application is highly transient, then Prometheus also offers a [push gateway](https://prometheus.io/docs/instrumenting/pushing/) instead.

[Sisyphus](https://en.wikipedia.org/wiki/Sisyphus) pushing a boulder up a hill (and repeat) (*Source: Wikipedia)*
### **3.1 Initial Results**
What do we see on Prometheus? Not much. Unlike commercial APM tools, there are no default dashboards, so you have to create graphs from scratch.
This is where [expressions](https://prometheus.io/docs/prometheus/latest/querying/basics/) come in. You can view and select metric names from a scroll down menu (or in a browser using https://localhost:9090/metrics) and enter them into the expression box and then execute them. Most of the time you’ll get an error message and have to fix something up.
Results can be viewed in a table, or in some cases graphed (as only some result types can be graphed). And by default expressions only go back 5 minutes to find data, if there isn’t any then you get an error. Note that Prometheus monitors itself, so if you don’t an instrumented application to monitor you can still try out Prometheus.
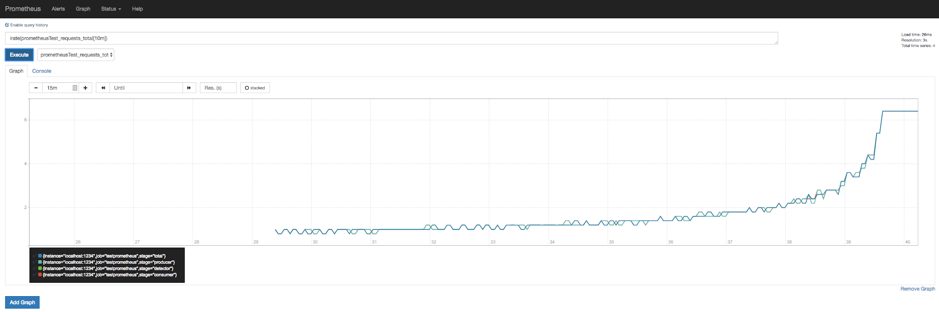
How do we graph our example data? If you graph a counter you’ll just see an increasing line.
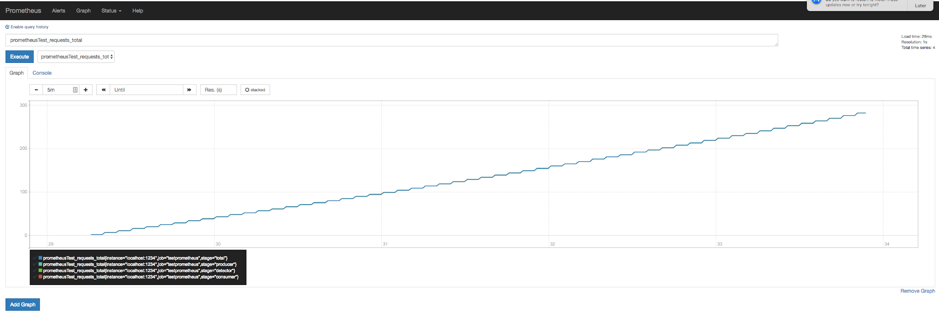
How do you turn a counter into a rate graph? Simple, with the [irate](https://prometheus.io/docs/prometheus/latest/querying/functions/#irate) or [rate](https://prometheus.io/docs/prometheus/latest/querying/functions/#rate()) function.
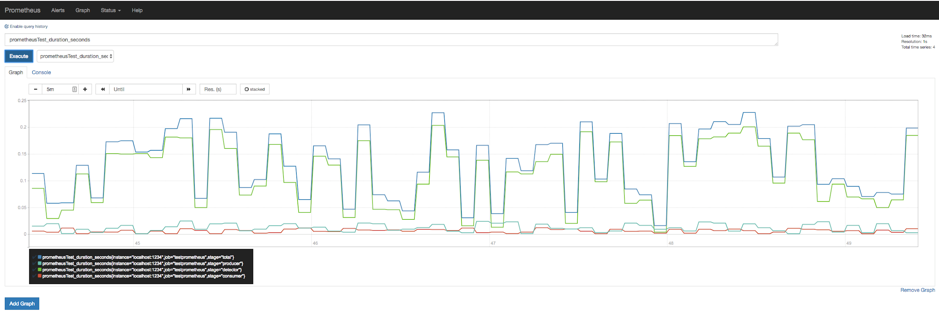
Here’s the graph of pipeline stage durations, which doesn’t need a rate function as it’s a Gauge, not a Counter:
The inbuilt Prometheus graphing is limited, and you can’t graph multiple metrics on the same graph. This is where Grafana comes in. Grafana has inbuilt support for Prometheus and is recommended to be used for any serious graphs.
Once you’ve [installed](https://grafana.com/) it and have it running, open your browser and go to https://localhost:3000/. There’s good documentation on both the [Prometheus](https://prometheus.io/docs/visualization/grafana/) and [Grafana](https://docs.grafana.org/features/datasources/prometheus/) sites on how to use Grafana with Prometheus. Create a Prometheus data source and then add a Prometheus graph. You enter a Prometheus expression as usual.
This graph shows both duration and rate metrics on the same graph:
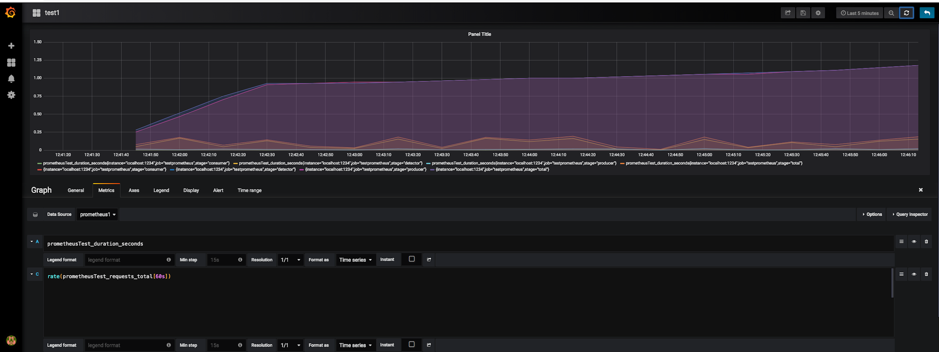
A handy hint: If you can’t see anything on the graph it’s likely that you are looking at the wrong time range! A quick fix is to use a “Quick range”, the “Last 5 minutes” is good.
Also note that you can have [rules that precompute rates](https://github.com/prometheus/prometheus/blob/master/docs/getting_started.md) to potentially speed aggregation up.
We can also graph node metrics such as CPU utilisation. [This blog has a good explanation.](https://www.robustperception.io/understanding-machine-cpu-usage)
For example, to compute CPU Utilisation as a percentage use this expression:
`100 - (avg by (instance) `
`(irate(node_cpu_seconds_total{job="node",mode="idle"}[5m])) * 100)`
###
**4. What Next?**
In this blog, we’ve seen how Prometheus can be used to monitor an example application. Next, we plan to try it out on the actual Anomalia Machine application code, deployed in a production-like environment.
This has a few challenges including:
1. How will Prometheus discover the services to monitor when there are lots of them, and if they are running in Kubernetes, and potentially highly transient?
2. How can we also get end-to-end call traces and dependency diagrams? Possibly [OpenTracing](https://opentracing.io/)
3. Where should run the Prometheus server? And (4) how can we also include Instaclustr Kafka and Cassandra cluster metrics in Prometheus?
Finally, a cool thing I found is this [Instaclustr Cassandra Exporter for Prometheus](https://github.com/instaclustr/cassandra-exporter). It’s really well documented and is a good starting point to understand Prometheus further, and would be an ideal way of integrating Cassandra metrics from a self-managed cluster into your application monitoring using Prometheus.
If you are interested in using Prometheus for monitoring the [Instaclustr managed Cassandra service](https://www.instaclustr.com/platform/managed-apache-cassandra/), there is a [3rd party Prometheus metrics exporter](https://github.com/fcgravalos/instaclustr_exporter) which works with the [Instaclustr monitoring API.](https://www.instaclustr.com/support/api-integrations/api-reference/monitoring-api/)
To find out more about our Managed Platform for Open Source Technologies, [contact us](https://www.instaclustr.com/contact-us/) or [sign up for a free trial](https://console.instaclustr.com/user/signup).
### About the author
**[Paul Brebner](https://www.instaclustr.com/blog/author/paul-brebner/)** | Technology Evangelist at Instaclustr
Paul has extensive R&D and consulting experience in distributed systems, technology innovation, software architecture, and engineering, software performance and scalability, grid and cloud computing, and data analytics and machine learning.
![mail icon]()#### Get the latest articles for open sourceIn your inbox
### Related content
[ Zero Downtime Migration to Instaclustr
Yes, we can migrate existing Cassandra clusters to Instaclustr without any downtime. Here's what to expect from the process...
](https://www.instaclustr.com/blog/zero-downtime-migration-to-instaclustr/)
[ Workflow Comparison: Uber Cadence vs Netflix Conductor
When choosing what’s right for your company’s opensource workflow needs it is important to know the difference and similarities ...
](https://www.instaclustr.com/blog/workflow-comparison-uber-cadence-vs-netflix-conductor/)
[ Will Your Cassandra Database Project Succeed?: The New Stack
Open source Apache Cassandra® continues to stand out as an enterprise-proven solution for organizations seeking high availability...
](https://www.instaclustr.com/blog/will-your-cassandra-database-project-succeed-the-new-stack/)
×Sign upto ourNewsletter
-----------------------