# Anomalia Machina 8: Production Application Deployment With Kubernetes
[Blog](/blog/)>[Technical](/blog/category/technical/)>Anomalia Machina 8: Production Application Deployment With Kubernetes
Anomalia Machina 8: Production Application Deployment With Kubernetes
=====================================================================
March 05, 2019 | By [ Paul Brebner](https://www.instaclustr.com/blog/author/paul-brebner/)
[ ](https://x.com/intent/tweet?text=Anomalia%20Machina%208:%20Production%20Application%20Deployment%20With%20Kubernetes&url=https://www.instaclustr.com/blog/anomalia-machina-8-production-application-deployment-kubernetes-massively-scalable-anomaly-detection-apache-kafka-cassandra/) [ ](https://www.linkedin.com/shareArticle?mini=true&url=https://www.instaclustr.com/blog/anomalia-machina-8-production-application-deployment-kubernetes-massively-scalable-anomaly-detection-apache-kafka-cassandra/&title=&summary=Anomalia%20Machina%208:%20Production%20Application%20Deployment%20With%20Kubernetes&source=)
In [the previous blog](https://www.instaclustr.com/blog/anomalia-machina-7-application-deployment-kubernetes/) we explored deploying the Anomalia Machina application on Kubernetes with the help of AWS EKS. In the recent blogs ([Anomalia Machina 5](https://www.instaclustr.com/blog/anomalia-machina-5-1-application-monitoring-prometheus/) and [Anomalia Machina 6](https://www.instaclustr.com/blog/anomalia-machina-6-application-tracing-opentracing/)), we enhanced the observability of the Anomalia Machina Application using two Open Source technologies: Prometheus for distributed monitoring of metrics such as throughput and latency; and OpenTracing and Jaeger to capture and visualise end-to-end event flows, and the system topology. In this blog, we are now ready to finally deploy the instrumented application in a cloud production environment.
Deploying the Production Application on Kubernetes
--------------------------------------------------
Did the previous effort of creating a Kubernetes cluster (using AWS EKS and EC2 worker nodes) pay off? Yes! This time around when I wanted to deploy the production version of the application it was a lot quicker to get up and running—I landed on ladders and avoided the snakes. According to Homer, Odysseus also escaped Scylla, the multi-headed sea snake, twice!
Scylla Attacking Odysseus’s Ship (*Source: Shutterstock)*
There are a few simple steps to get the executable jar file deployed to Kubernetes. First, you need a Dockerfile and a Kubernetes configuration file.
Here’s my Dockerfile:
FROM java:8 WORKDIR / ADD consumer.jar consumer.jar EXPOSE 8080 CMD java -jar consumer.jar
1
2
3
4
5
FROM java:8
WORKDIR /
ADD consumer.jar consumer.jar
EXPOSE 8080
CMD java -jar consumer.jar
And my basic [kubernetes yaml file](https://www.mirantis.com/blog/introduction-to-yaml-creating-a-kubernetes-deployment/) (k8.yaml):
apiVersion: apps/v1 kind: Deployment metadata: name: consumer-deployment labels: app: consumer spec: replicas: 1 selector: matchLabels: app: consumer template: metadata: labels: app: consumer spec: containers: - name: consumer image: myimages/consumer:latest
1
2
3
4
5
6
7
8
9
10
11
12
13
14
15
16
17
18
19
apiVersion: apps/v1
kind: Deployment
metadata:
name: consumer-deployment
labels:
app: consumer
spec:
replicas: 1
selector:
matchLabels:
app: consumer
template:
metadata:
labels:
app: consumer
spec:
containers:
- name: consumer
image: myimages/consumer:latest
Assuming AWS EKS is running ([see the previous blog](https://www.instaclustr.com/blog/anomalia-machina-7-application-deployment-kubernetes/)), you have some worker nodes (EC2 instances) running, you have [Docker](https://www.docker.com/get-started) and [kubectl](https://kubernetes.io/docs/tasks/tools/install-kubectl/) installed locally, you are [logged in to the Docker Hub](https://docs.docker.com/engine/reference/commandline/login/) and your l[ocal kubectl is configured to work with the AWS Kubernetes cluster](https://docs.aws.amazon.com/eks/latest/userguide/getting-started.html), then you can deploy the jar file as a Deployment with a single Pod with the following commands:
docker build -t consumer . docker tag consumer myimages/consumer:latest docker push myimages/consumer kubectl delete deployment consumer-deployment kubectl create -f k8.yaml kubectl get deployments
1
2
3
4
5
6
docker build -t consumer .
docker tag consumer myimages/consumer:latest
docker push myimages/consumer
kubectl delete deployment consumer-deployment
kubectl create -f k8.yaml
kubectl get deployments
Other [useful kubectl commands ](https://kubernetes.io/docs/reference/kubectl/cheatsheet/)to see what’s going on are:
kubectl cluster-info kubectl get deployments kubectl get pods kubectl get nodes kubectl describe deployments kubectl describe pods kubectl describe nodes kubectl logs <pod>
1
2
3
4
5
6
7
8
kubectl cluster-info
kubectl get deployments
kubectl get pods
kubectl get nodes
kubectl describe deployments
kubectl describe pods
kubectl describe nodes
kubectl logs <pod>
If you’ve installed and started the [Kubernetes GUI,](https://docs.aws.amazon.com/eks/latest/userguide/dashboard-tutorial.html) you can log in ([step 3](https://docs.aws.amazon.com/eks/latest/userguide/dashboard-tutorial.html)) and create a deployment from the pushed Docker image (avoiding the kubectl steps, you still need the docker steps).
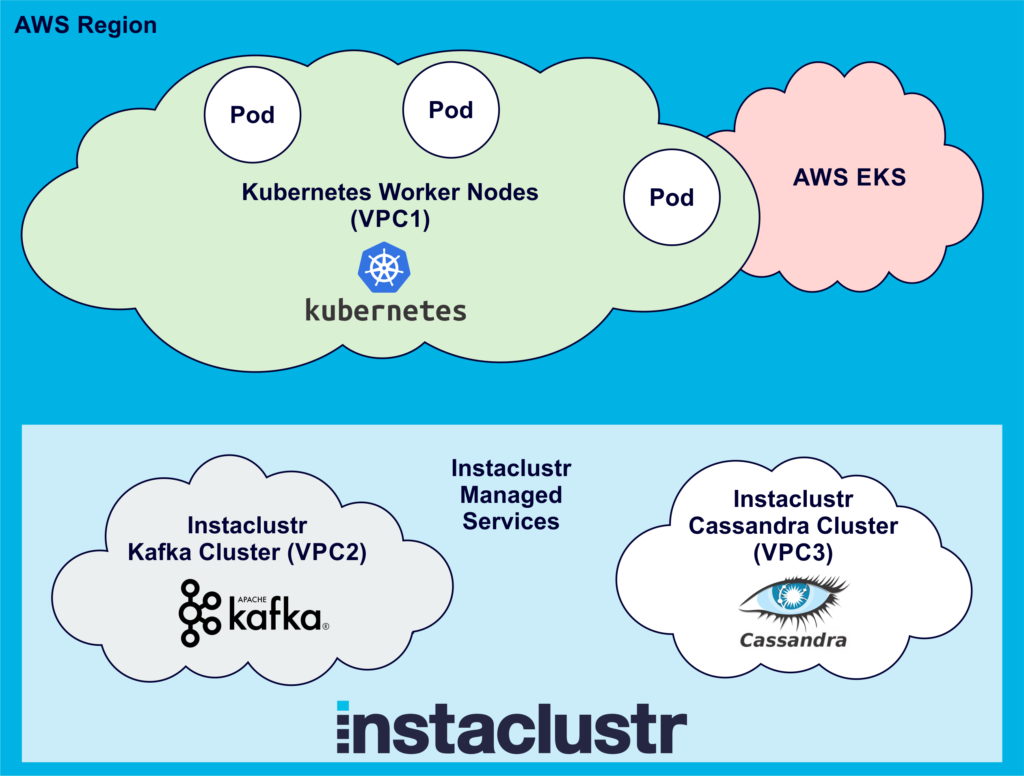
Here’s what our set up looks like so far, assuming we have [already created an Instaclustr Kafka and Cassandra cluster](https://www.instaclustr.com/blog/anomalia-machina-2-automatic-provisioning/) in the same AWS region as AWS EKS (The picture shows 3 Pods to make it more realistic):
[](https://www.instaclustr.com/wp-content/uploads/2021/10/Anomalia-Machina-8-Instaclustr-Managed-Services-1.png)
Connecting From Kubernetes Pods to Instaclustr Kafka and Cassandra Clusters Using VPC Peering
---------------------------------------------------------------------------------------------
Like Odysseus, there are still a few more challenges to overcome before we complete our journey. One challenge with connecting to/from applications running in Kubernetes to other systems is that Kubernetes Pods are ephemeral – they come and go. [Pod IP addresses](https://kubernetes.io/docs/concepts/cluster-administration/networking/) are also dynamic (There’s more information on Kubernetes networking [here](https://sookocheff.com/post/kubernetes/understanding-kubernetes-networking-model/) and [here](https://medium.com/google-cloud/understanding-kubernetes-networking-pods-7117dd28727), but I wonder if you really need to know this much detail about networking just to deploy an application). Each Pod has a unique (dynamic) IP address, even if there are multiple pods running on the same Node (EC2 instance).
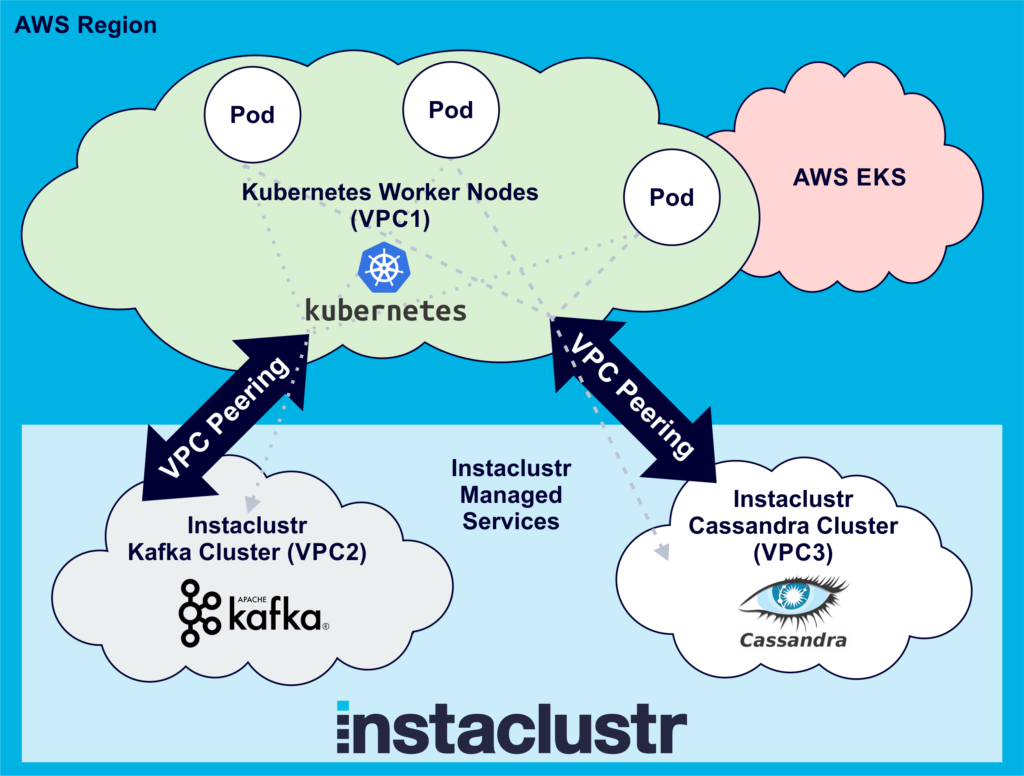
In order for the client application to connect to Kafka and Cassandra clusters, you need to add the IP addresses of the client machines to the Instaclustr cluster firewalls ([instructions for Cassandra](https://www.instaclustr.com/support/documentation/cassandra/using-cassandra/connect-to-a-cluster/), [instructions for Kafka](https://www.instaclustr.com/support/documentation/)). This is what I did for testing the deployment for the previous blog, but this approach obviously won’t work for production with a large number of pods. Luckily, [Instaclustr supports VPC peering](https://www.instaclustr.com/support/documentation/cassandra/using-cassandra/connect-to-cassandra-cluster-vpc-peering-aws/) as a mechanism for connecting directly to your Instaclustr managed cluster.
VPC Peering allows you to access your cluster via private IP and makes for much more secure network setup. For our use case, we need to set up VPC peering from both the Kafka and Cassandra clusters to our [Kubernetes worker node VPC](https://docs.aws.amazon.com/eks/latest/userguide/launch-workers.html) (which was created as part of the AWS EKS steps documented in [the previous blog](https://www.instaclustr.com/blog/anomalia-machina-7-application-deployment-kubernetes/)). These [instructions](https://www.instaclustr.com/support/documentation/cassandra/using-cassandra/connect-to-cassandra-cluster-vpc-peering-aws/) document the steps required. For each cluster (Kafka and Cassandra) you have to submit a VPC Peering request, and then on the AWS side [accept the request](https://www.instaclustr.com/blog/) and add a route to the Instaclustr cluster VPC. Note that the Destination is the “Network”, available on the Cluster details page. It will look something like this: 123.456.0.0/20
Note that once you’ve done this you should change the Kafka and Cassandra client code to connect to the clusters using private IP addresses. These can also be obtained via the Provisioning API (instructions for [Cassandra](https://www.instaclustr.com/support/api-integrations/api-reference/cluster-management-api/), instructions for [Kafka](https://www.instaclustr.com/support/api-integrations/api-reference/cluster-management-api/)).
Now that we’ve set up the VPC peering, the application running on Kubernetes can communicate with the Kafka and Cassandra clusters (if it has the cluster IP addresses):
[](https://www.instaclustr.com/wp-content/uploads/2021/10/Anomalia-Machina-8-VPC-peering-the-application-running-on-Kubernetes-can-communicate-with-the-Kafka-and-Cassandra-clusters.png)
Discovering Instaclustr Kafka and Cassandra Cluster IP Addresses
----------------------------------------------------------------
The next challenge we had to solve is that the application, now running on Kubernetes Pods, needs to know the private IP addresses of the Kafka and Cassandra clusters. Given that we wanted to be able to spin up multiple different sized (number of nodes and node sizes) clusters for testing we needed a way to configure the application while it was running in Kubernetes, or for the application to discover the IP addresses to connect to dynamically. Kubernetes provides a number of approaches for [injecting data into applications](https://kubernetes.io/docs/tasks/inject-data-application/) including: [commands and arguments](https://kubernetes.io/docs/tasks/inject-data-application/define-command-argument-container/), [define environment variables](https://kubernetes.io/docs/tasks/inject-data-application/define-environment-variable-container/), or i[nject a properties file using ConfigMap](https://kubernetes.io/docs/tasks/configure-pod-container/configure-pod-configmap/).
Odysseus and the Sirens (*Source: Shutterstock)*
I tested all of these approaches out and they worked ok, however, they all require manual configuration of the IP addresses and would become unwieldy for clusters with many nodes (although you don’t need all the node IP addresses to bootstrap the clients). For example, here’s a Kubernetes yaml configuration file to inject environment variables (for Cassandra IP addresses) into pods:
apiVersion: v1 kind: Pod metadata: name: testenv spec: containers: - image: myimages/testenv:v1 name: testenv env: - name: CASSANDRA\_IP1 value: “1.2.3.4” - name: CASSANDRA\_IP2 value: “1.2.3.5” - name: CASSANDRA\_IP3 value: “1.2.3.6”
1
2
3
4
5
6
7
8
9
10
11
12
13
14
15
apiVersion: v1
kind: Pod
metadata:
name: testenv
spec:
containers:
- image: myimages/testenv:v1
name: testenv
env:
- name: CASSANDRA\_IP1
value: “1.2.3.4”
- name: CASSANDRA\_IP2
value: “1.2.3.5”
- name: CASSANDRA\_IP3
value: “1.2.3.6”
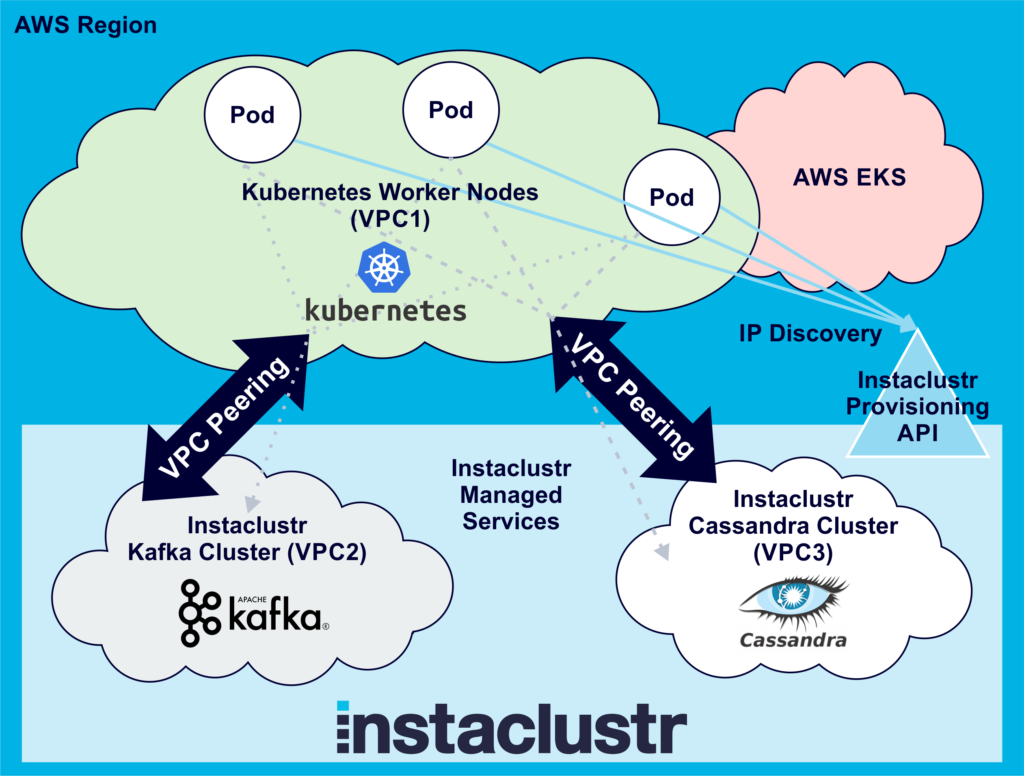
A more general solution is to dynamically discover the IP addresses. Instaclustr provides a [Provisioning API](https://www.instaclustr.com/support/api-integrations/api-reference/cluster-management-api/), which along with enabling remote cluster creation, also allows discovery using two calls. The first call is to “list all clusters” running in an account, which returns an array of clusters, including the cluster ID of each. Other calls are then used to find the “Cluster Status” for each cluster ID. The response includes the privateAddress of each node in the cluster, which is what we need to connect. You can infer which clusters are running Cassandra or Kafka and use the cluster name to pick the correct cluster to connect to if there are multiple clusters of any type (e.g. I make sure I have the word “production” in the clusterName).
Here’s the penultimate solution with dynamic cluster IP address discovery:
[](https://www.instaclustr.com/wp-content/uploads/2021/10/Anomalia-Machina-8-penultimate-solution-with-dynamic-cluster-IP-address-discovery.png)
Enabling Ingress Into Kubernetes: Connecting Prometheus to the Application Running in Kubernetes
------------------------------------------------------------------------------------------------
The next challenge is Prometheus monitoring of the application running in Kubernetes, which we set up and tested in [Machina Anomalia 5](https://www.instaclustr.com/blog/anomalia-machina-5-1-application-monitoring-prometheus/). Prometheus is pull-based and needs the IP addresses and ports of all the application instances to monitor. For this proof of concept, I was running the Prometheus server on my laptop. The challenge for monitoring Kubernetes applications is that the Pod IP addresses are dynamic. We also need to configure the Kubernetes AWS EC2 worker node instances to allow Prometheus to access the Pods from outside.
[](https://www.instaclustr.com/wp-content/uploads/2021/10/Odysseuss-ingress-into-the-Underworld.png)Odysseus’ ingress into the Underworld *(Source: Shutterstock)*
I thought that perhaps adding the Prometheus port number to either (or both!) the Dockerfile ([EXPOSE <port>](https://docs.docker.com/engine/reference/builder/)) and the Kubernetes configuration file ([search on this page for “port”](https://kubernetes.io/docs/concepts/configuration/overview/)) would open the port and enable Prometheus monitoring. Actually, no. At this level the ports are only “informational”, they don’t appear to do actually do anything. E.g. from the Kubernetes documentation:
ports: List of ports to expose from the container. Exposing a port here gives the system additional information about the network connections a container uses, but is *primarily informational.*
A critical step is to open the instances firewall. I added a [custom TCP rule](https://docs.aws.amazon.com/AWSEC2/latest/UserGuide/using-network-security.html) to the EC2 worker nodes security group to open the Prometheus ports to the server that Prometheus is running on.
However, Prometheus still can’t connect. What’s going wrong? Well, the obvious problem is that each Pod has a private IP address (which is dynamic), and all we have is the public IP addresses of the worker nodes. We need some way to map them. Luckily, Kubernetes has something to help. A workaround for the IP addresses is to use a *Kubernetes Service* to enable ingress into the pods. A Kubernetes Service is an abstraction which defines a logical set of Pods and a policy to access them. There are several [Kubernetes service types](https://kubernetes.io/docs/concepts/services-networking/service/#publishing-services-service-types): ClusterIP, NodePort, LoadBalancer, and ExternalName. NodePort looks like what we need:
NodePort: Exposes the service on each Node’s IP at a static port (the NodePort). A ClusterIP service, to which the NodePort service will route, is automatically created. You’ll be able to contact the NodePort service, from outside the cluster, by requesting <NodeIP>:<NodePort>.
This document explains how to set up a [NodePort](https://kubernetes.io/docs/tasks/access-application-cluster/service-access-application-cluster/) service, and [this blog ](https://oteemo.com/2017/12/12/think-nodeport-kubernetes/)explains pros and cons of using NodePort.
I tried an experiment using kubectl to create the service directly:
kubectl expose deployment consumer-deployment --type=NodePort --name=prometheus-service --port=1235 --target-port=1235
1
kubectl expose deployment consumer-deployment --type=NodePort --name=prometheus-service --port=1235 --target-port=1235
And then using kubectl describe to see what the service looks like:
kubectl describe services prometheus-service Name: prometheus-service Namespace: default Labels: app=consumer Annotations: <none> Selector: app=consumer Type: NodePort IP: 12.345.67.890 Port: <unset> 1235/TCP TargetPort: 1235/TCP NodePort: <unset> 31598/TCP Endpoints: 123.123.123.123:1235 Session Affinity: None External Traffic Policy: Cluster Events: <none>
1
2
3
4
5
6
7
8
9
10
11
12
13
14
15
kubectl describe services prometheus-service
Name: prometheus-service
Namespace: default
Labels: app=consumer
Annotations: <none>
Selector: app=consumer
Type: NodePort
IP: 12.345.67.890
Port: <unset> 1235/TCP
TargetPort: 1235/TCP
NodePort: <unset> 31598/TCP
Endpoints: 123.123.123.123:1235
Session Affinity: None
External Traffic Policy: Cluster
Events: <none>
To delete the service:
kubectl delete services prometheus-service
1
kubectl delete services prometheus-service
I noticed that every time I destroyed and created the service again the NodePort changed (it’s a random number from the NodePort range, by default 30000-32767). I also had to add the nodeport range to the worker node security group firewall rules. Then it worked ok, Prometheus could scrape from <workerNodePublicIP:NodePort>. I then wondered if there was some way to force the NodePort to be a specific value each time. There was, but only using a configuration file with nodePort as follows (kubectl doesn’t currently support a nodePort value). Each time the service is created, it uses 30123 as the NodePort. Occasionally it fails after complaining that the port is still in use (even after deleting it).
apiVersion: v1 kind: Service metadata: name: prometheus-service spec: selector: app: consumer type: NodePort ports: - port: 1235 nodePort: 30123 protocol: TCP targetPort: 1235
1
2
3
4
5
6
7
8
9
10
11
12
13
apiVersion: v1
kind: Service
metadata:
name: prometheus-service
spec:
selector:
app: consumer
type: NodePort
ports:
- port: 1235
nodePort: 30123
protocol: TCP
targetPort: 1235
[Labels](https://www.replex.io/blog/9-best-practices-and-examples-for-working-with-kubernetes-labels) and [Selectors](https://kubernetes.io/docs/concepts/configuration/assign-pod-node/) are an important (powerful and complex!) feature of Kubernetes. Note that if there’s something wrong with the selector (e.g. the name is incorrect) the expose command appears to work, but the resulting service doesn’t work (e.g. it has no endpoints).
This approach really only works for small scale testing, as it has significant limitations. You need to manually discover the worker node IP addresses and add them to the Prometheus configuration file along with the expected NodePort number. The more serious problem is that it doesn’t work for multiple Pods per Node, as you only get to connect to one Pod. It is possible to force Kubernetes to deploy a single Pod on each node, but this requires careful consideration about the resources used by each Pod and EC2 instance size selection. The service approach worked ok for the POC up to about 10 worker nodes.
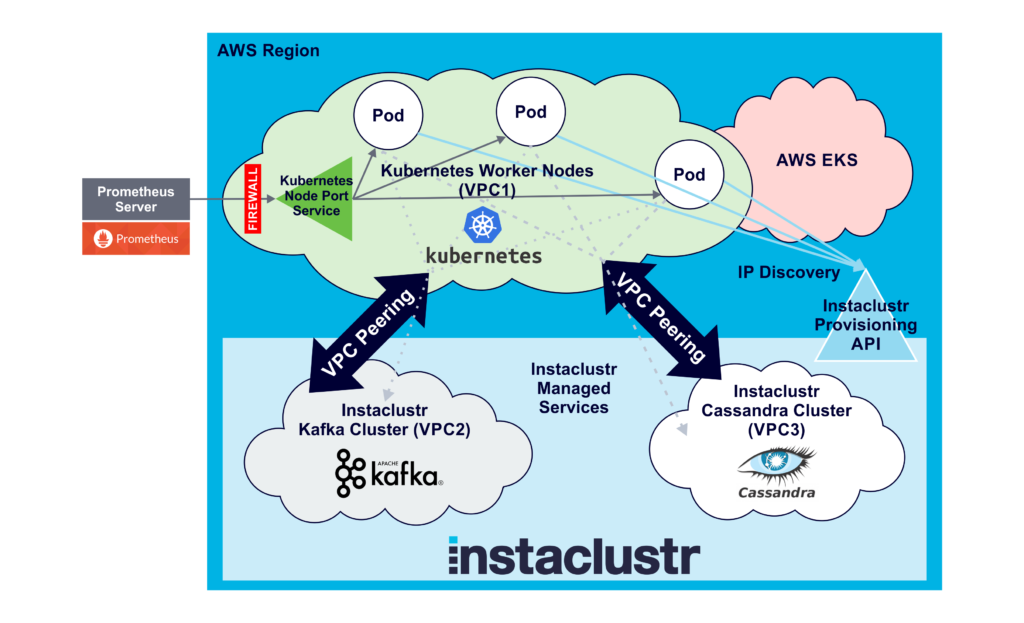
The preferred approach is to either use [Prometheus EC2 service discovery](https://prometheus.io/docs/prometheus/latest/configuration/configuration/#ec2_sd_config), or better still, the [Prometheus operator ](https://github.com/coreos/prometheus-operator)which enables Prometheus to run on EKS.
Here’s the final configuration with everything in place ready to go:
[](https://www.instaclustr.com/wp-content/uploads/2021/10/Anomalia-Machina-8-Prometheus-operator-which-enables-Prometheus-to-run-on-EKS.png)
In the next blog, we start to detect anomalies at scale. Stay tuned and subscribe to our newsletter for regular updates.
### About the author
**[Paul Brebner](https://www.instaclustr.com/blog/author/paul-brebner/)** | Technology Evangelist at Instaclustr
Paul has extensive R&D and consulting experience in distributed systems, technology innovation, software architecture, and engineering, software performance and scalability, grid and cloud computing, and data analytics and machine learning.
![mail icon]()#### Get the latest articles for open sourceIn your inbox
### Related content
[ Zero Downtime Migration to Instaclustr
Yes, we can migrate existing Cassandra clusters to Instaclustr without any downtime. Here's what to expect from the process...
](https://www.instaclustr.com/blog/zero-downtime-migration-to-instaclustr/)
[ Workflow Comparison: Uber Cadence vs Netflix Conductor
When choosing what’s right for your company’s opensource workflow needs it is important to know the difference and similarities ...
](https://www.instaclustr.com/blog/workflow-comparison-uber-cadence-vs-netflix-conductor/)
[ Will Your Cassandra Database Project Succeed?: The New Stack
Open source Apache Cassandra® continues to stand out as an enterprise-proven solution for organizations seeking high availability...
](https://www.instaclustr.com/blog/will-your-cassandra-database-project-succeed-the-new-stack/)
×Sign upto ourNewsletter
-----------------------