# Tracing Apache Kafka® With OpenTelemetry – “Leave Lots of Traces”
[Blog](/blog/)>[Technology](/blog/category/technical/)>Tracing Apache Kafka® With OpenTelemetry – “Leave Lots of Traces”
Tracing Apache Kafka® With OpenTelemetry – “Leave Lots of Traces”
=================================================================
March 15, 2024 | By [ Paul Brebner](https://www.instaclustr.com/blog/author/paul-brebner/)
[ ](https://x.com/intent/tweet?text=Tracing%20Apache%20Kafka%C2%AE%20With%20OpenTelemetry%20%E2%80%93%20%E2%80%9CLeave%20Lots%20of%20Traces%E2%80%9D&url=https://www.instaclustr.com/blog/tracing-apache-kafka-with-opentelemetry/) [ ](https://www.linkedin.com/shareArticle?mini=true&url=https://www.instaclustr.com/blog/tracing-apache-kafka-with-opentelemetry/&title=&summary=Tracing%20Apache%20Kafka%C2%AE%20With%20OpenTelemetry%20%E2%80%93%20%E2%80%9CLeave%20Lots%20of%20Traces%E2%80%9D&source=)
### 1. Introduction
It’s been 5 years since I looked at observability and distributed tracing for Apache Kafka® with open source OpenTracing and Jaeger [in this blog](https://www.instaclustr.com/blog/anomalia-machina-6-application-tracing-opentracing/).
So, I decided it was worth taking another look at tracing Apache Kafka, particularly after discovering that [OpenTracing](https://opentracing.io/) and [OpenCensus](https://opencensus.io/) have merged to form [OpenTelemetry](https://opentelemetry.io/), which handles everything observable: traces, metrics, and logs (although I’m only interested in traces at present).
### 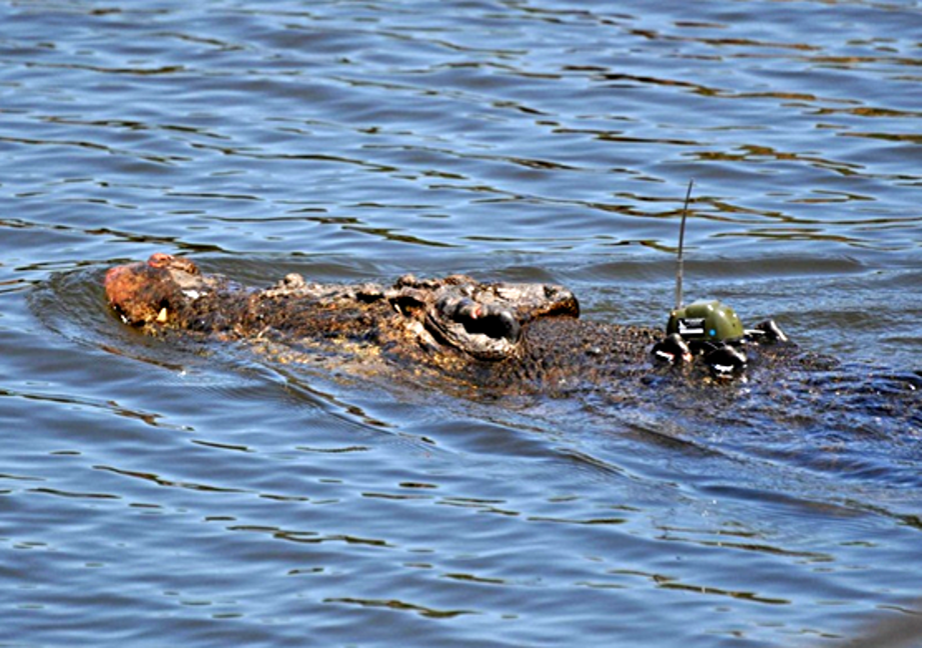
A radio-controlled saltwater crocodile? No, a croc with telemetry – sensors + radio communication!
[*(Source: Wikimedia)*](https://commons.wikimedia.org/wiki/File:Crocodylus_porosus_with_GPS-based_satellite_transmitter_attached_to_the_nuchal_rosette_-_journal.pone.0062127.g002.png)
Why are traces cool? Well, for distributed systems such as Kafka, they give you visibility into end-to-end latency, the time spent in each component, and the overall event flow topology.
And why “Telemetry”? Well, telemetry is from the Greek *tele, “*remote”, and *metron, “*measure”, so *remote measurement* (e.g. like the crocodile telemetry above).
An interesting example of tracing *and* telemetry in the real world is the *seismometer/seismograph—*an instrument to trace the movement of the earth on *seismograms*, where the instrument is remote from the source of the earthquake (potentially anywhere in the world if the earthquake is large enough).
Talking about size, the [Richter scale](https://en.wikipedia.org/wiki/Richter_scale) (used to measure the magnitude of earthquakes) was originally defined and calibrated based on the size of the traces on a seismogram.
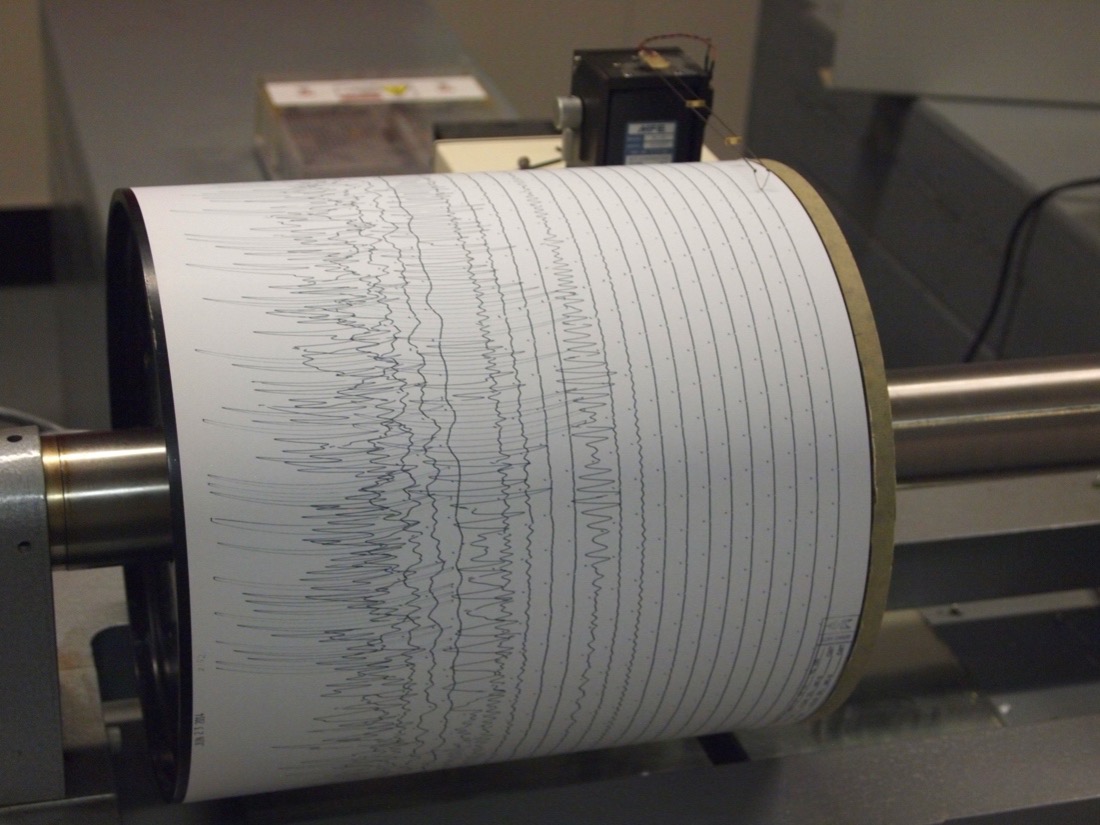
Earthquake traces on a seismogram *(Source:* [*Wikipedia*](https://en.wikipedia.org/wiki/Seismogram)*)*
Just like seismic instruments, there are multiple components to tracing with OpenTelemetry:
1. The observability framework, OpenTelemetry
2. Instrumentation of your application code
3. A backend to collect and visualize the tracing data
Let’s put them to work!
### 2. Instrumentation
Five years ago, the only option for instrumenting Kafka clients was manual instrumentation. This required code changes to be made to the clients, which injected the OpenTracing specific header meta-data into the Kafka headers so that tracing worked across process boundaries.
I was pleasantly surprised to discover [automatic instrumentation is now possible for Java applications](https://opentelemetry.io/docs/languages/java/automatic/), using bytecode injection. Once you have downloaded the
opentelemetry-javaagent.jar
1
opentelemetry-javaagent.jar
you can run your java program as follows:
java -javaagent:opentelemetry-javaagent.jar -Dotel.traces.exporter=jaeger Dotel.resource.attributes=service.name=producer1 - Dotel.metrics.exporter=none -jar producer1.jar
1
2
3
java -javaagent:opentelemetry-javaagent.jar -Dotel.traces.exporter=jaeger
Dotel.resource.attributes=service.name=producer1 -
Dotel.metrics.exporter=none -jar producer1.jar
The options include the path to the
opentelemetry-javaagent.jar
1
opentelemetry-javaagent.jar
file, the name of the tool to export the traces to (initially, jaeger), the “service.name” which is a unique name for this component of the application, and if the metrics are also being exported (not applicable for Jaeger, as it only supports traces).
To produce some interesting OpenTelemetry Kafka traces I reused my latest Kafka application from my [2023 Christmas Special blog](https://www.instaclustr.com/blog/apache-kafka-and-risingwave-stream-processing/) which demonstrated using Apache Kafka Stream processing to help Santa’s Elves pack toys into the correct boxes.
In this application, there are:
- 2 Kafka producers writing toy and box events to 2 Kafka topics
- 1 Kafka Stream processor to read from these topics and join toys and boxes which have matching keys over a window, as candidate packing solutions, writing the solutions out to another Kafka topic.
I added a Kafka consumer which just reads the solutions from the solutions topics and prints them out (which also helps with debugging).
Run the Java components as follows to generate OpenTelemetry data for Jaeger (the first backend we’ll try out):
java -javaagent:opentelemetry-javaagent.jar -Dotel.traces.exporter=jaeger - Dotel.resource.attributes=service.name=consumer - Dotel.metrics.exporter=none -jar consumer.jar java -javaagent:opentelemetry-javaagent.jar -Dotel.traces.exporter=jaeger – Dotel.resource.attributes=service.name=stream\_join - Dotel.metrics.exporter=none -jar join.jar java -javaagent:opentelemetry-javaagent.jar -Dotel.traces.exporter=jaeger - Dotel.resource.attributes=service.name=boxes\_producer - Dotel.metrics.exporter=none -jar boxes.jar
1
2
3
4
5
6
7
8
9
10
11
java -javaagent:opentelemetry-javaagent.jar -Dotel.traces.exporter=jaeger -
Dotel.resource.attributes=service.name=consumer -
Dotel.metrics.exporter=none -jar consumer.jar
java -javaagent:opentelemetry-javaagent.jar -Dotel.traces.exporter=jaeger –
Dotel.resource.attributes=service.name=stream\_join -
Dotel.metrics.exporter=none -jar join.jar
java -javaagent:opentelemetry-javaagent.jar -Dotel.traces.exporter=jaeger -
Dotel.resource.attributes=service.name=boxes\_producer -
Dotel.metrics.exporter=none -jar boxes.jar
This starts the 2 Kafka producers, producing new toy and box events, the stream join that find matches toys and boxes over a 60 second window, and the consumer that prints out the matches.
### 3. Jaeger
To try Jaeger just run [the docker command found here](https://www.jaegertracing.io/docs/1.53/getting-started/), then browse to [https://localhost:8080](https://localhost:8080/) to see the GUI. Did it work as expected? Yes—without any manual instrumentation, which is cool!
There are multiple ways of visualizing traces in Jaeger, basically divided into trace timing and topology views. Here are a couple that I explored.
In Jaeger, you first go to the Search tab, where you can see a pull-down list of all the services found in the traces. Select a service you are interested in (e.g. toys\_producer) and “Find Traces”. In the list of found traces, if you click on one at random you get the Trace Timeline view by default:

What do we notice? That the total time is **103ms**, there are **19 spans**, and **3 services**.
Each [trace](https://opentelemetry.io/docs/concepts/signals/traces/) is made up of 1 or more “[spans](https://opentelemetry.io/docs/concepts/signals/traces/#spans)”, and the 3 [services](https://opentelemetry.io/docs/specs/semconv/resource/#service) in this trace are toys\_producer, stream\_join, and consumer.
Where has the boxes\_producer service gone to? Well, the way tracing works is that the edge components inject a parent trace ID (traceID) which all other spans (with unique spanID’s) are then related to (by a refType, e.g. CHILD\_OF). The boxes and toys producers have different trace IDs so are not shown together in this view.
If we click on the “Trace Graph” tab we get a topology view:
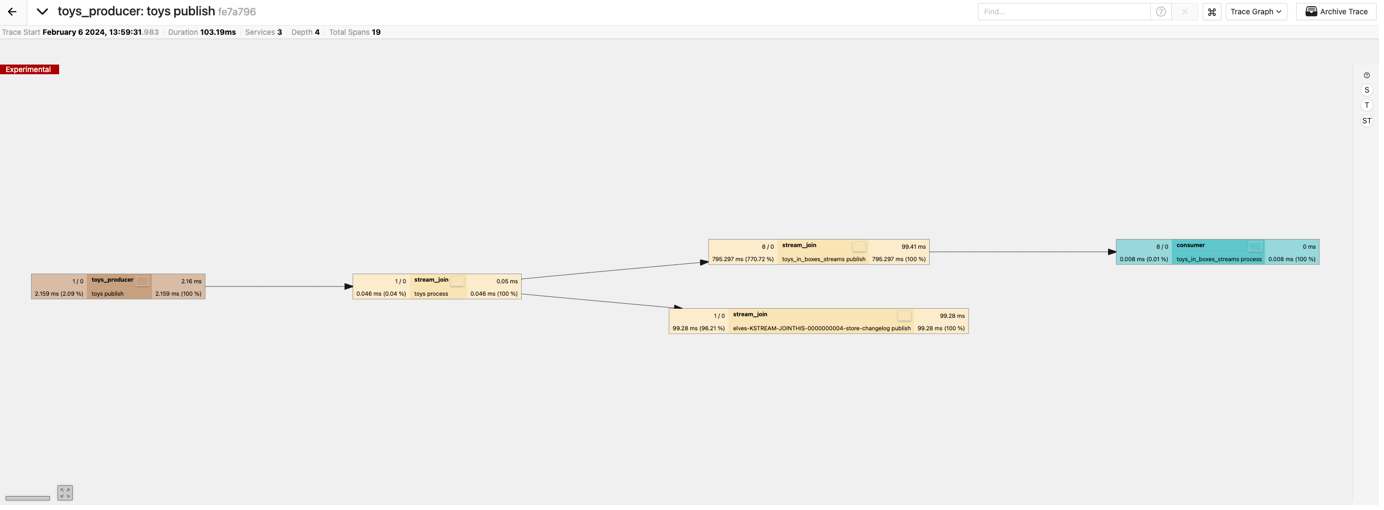
This shows the flow of messages from the left to right, and also shows the extra stream\_join state store span (which stores the stream processor state in Kafka).
If we go to the “System Architecture” tab the complete topology is visible:
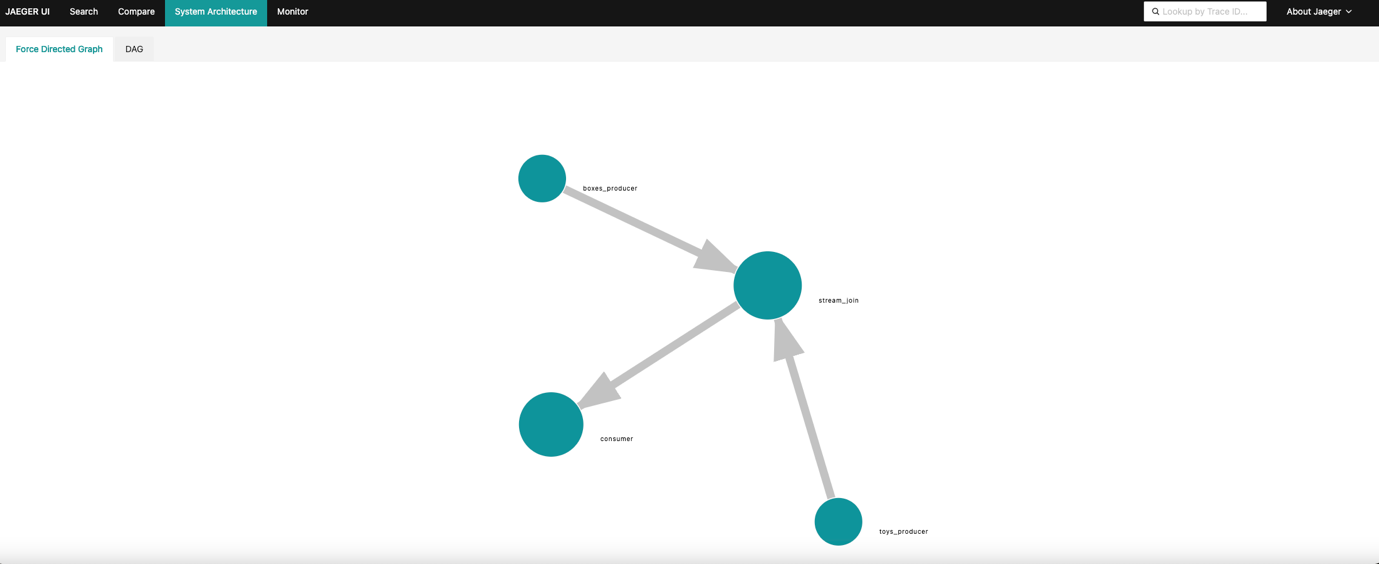
Or the DAG view (which shows the total number of messages for each service):
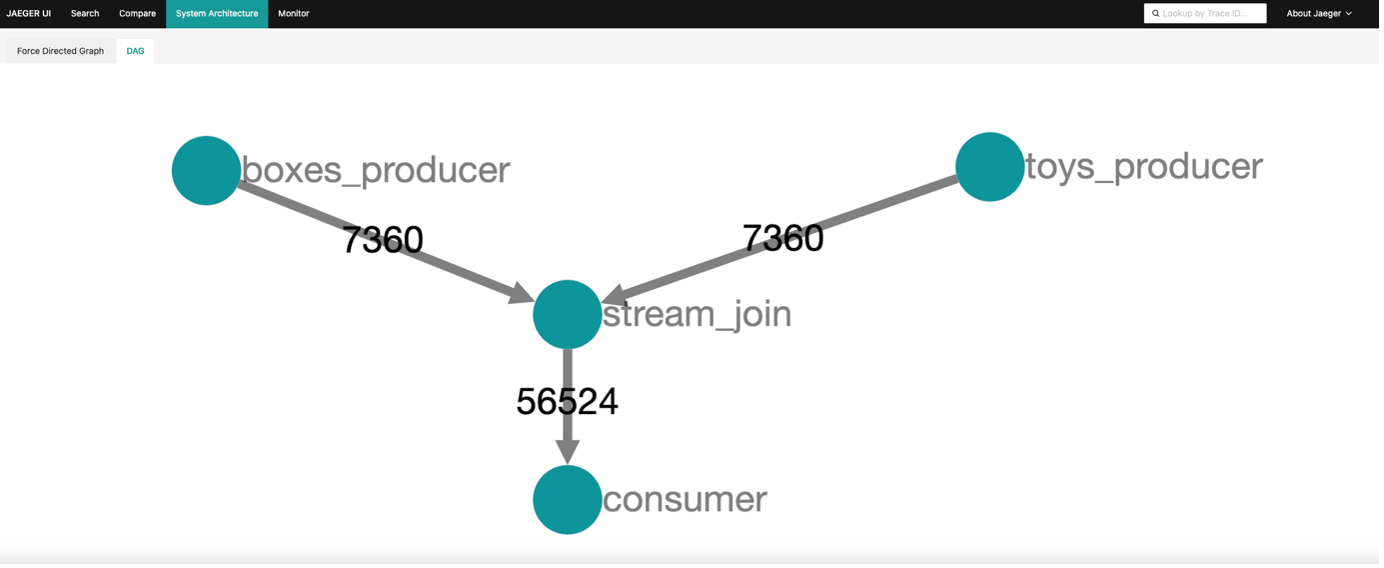
Finally, there’s another view, “Deep Dependency Graph”. However, which services are included seems to depend on the service selected to view (and clicking on “View parents” on the top visible nodes to make more visible, if available). Selecting consumer or stream\_join gave a complete topology similar to the above:
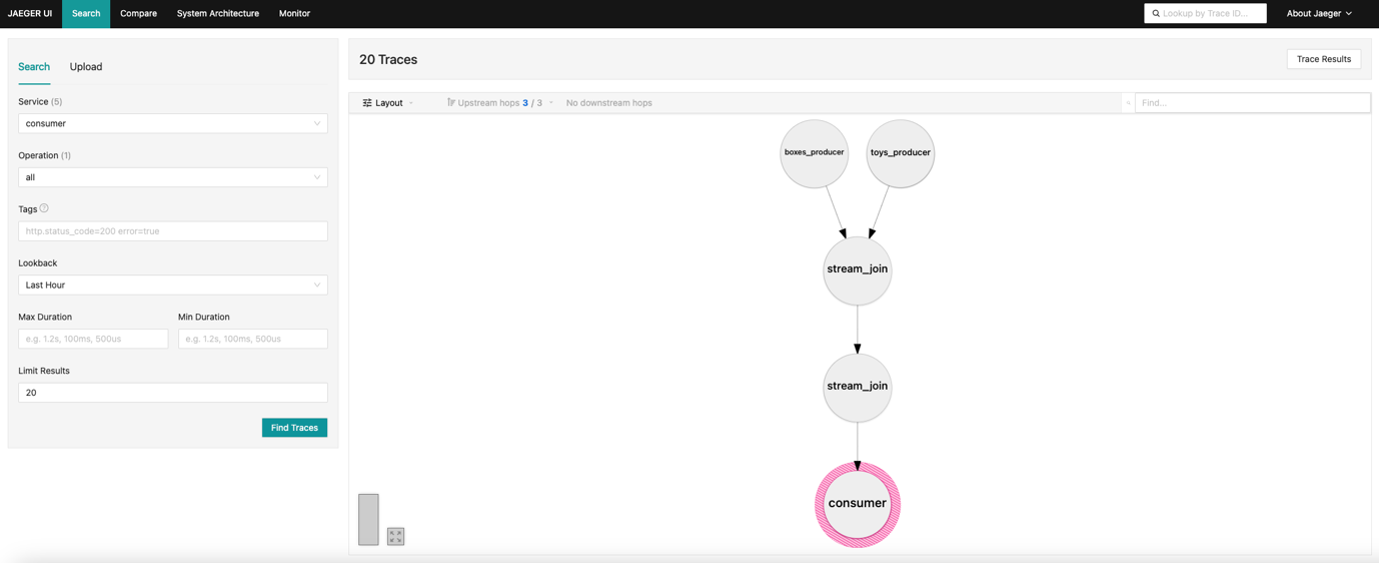
Jaeger has other views (not shown) to explore the times of one or more traces (Compare, Trace Statistics, Trace Spans Table, Trace Flamegraph, and Trace JSON—to see the raw data).
My initial observation is that detailed trace views give lots of information and are useful for discovering flows and times in detail. The topology views are useful for discovery but have less information about performance (limited latency and throughput metrics), and Kafka specific names (e.g. topic names are missing). The topic names are present in the detailed trace/span data as shown in this example (messaging.destination.name):
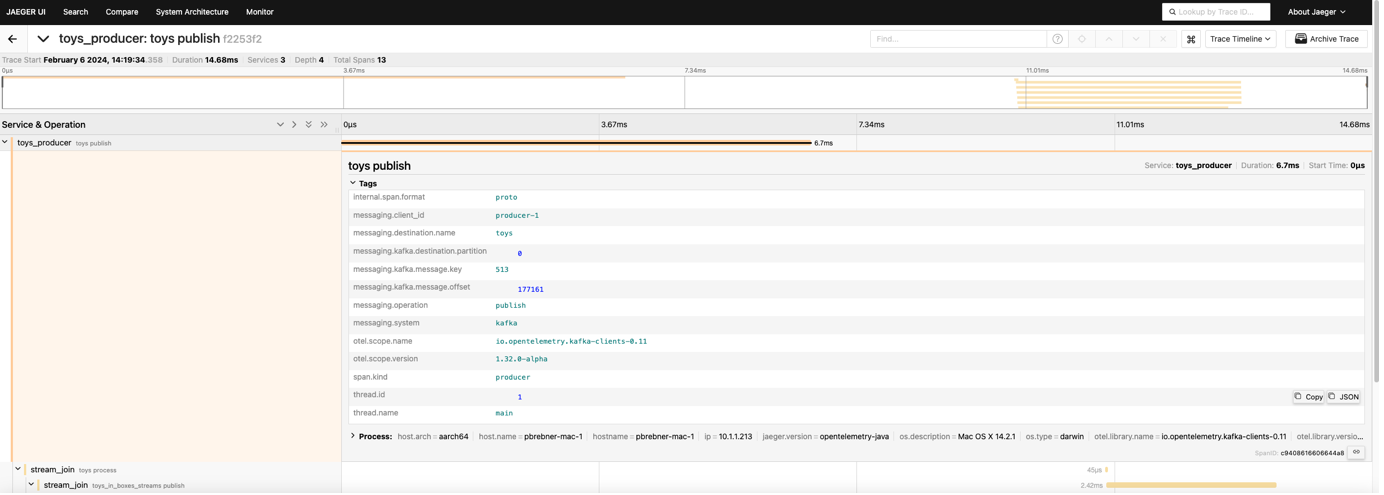
So, that’s Jaeger. It wasn’t my intention to evaluate all the open source OpenTelemetry backends, but I decided to give some of the other options a go just to see if there were significant differences in the way they visualize topologies in particular.
### 4. SigNoz
The next 2 backends I tried both have cloud versions. The procedure is to request access and receive a key to use a trial version. For SigNoz the details are [here](https://signoz.io/).
Some changes are now required to run the Kafka clients configured so that they send OpenTelemetry traces to the SigNoz cloud. Here’s an example for the join:
OTEL\_RESOURCE\_ATTRIBUTES=service.name=stream\_join \\ OTEL\_EXPORTER\_OTLP\_HEADERS="signoz-access-token=123456789" \\ OTEL\_EXPORTER\_OTLP\_ENDPOINT=https://ingest.us.signoz.cloud:443 \\ java -javaagent:opentelemetry-javaagent.jar -jar join.jar&
1
2
3
4
OTEL\_RESOURCE\_ATTRIBUTES=service.name=stream\_join \\
OTEL\_EXPORTER\_OTLP\_HEADERS="signoz-access-token=123456789" \\
OTEL\_EXPORTER\_OTLP\_ENDPOINT=https://ingest.us.signoz.cloud:443 \\
java -javaagent:opentelemetry-javaagent.jar -jar join.jar&
SigNoz has a nice “Service Map” view which also shows a Kafka cluster in this example:
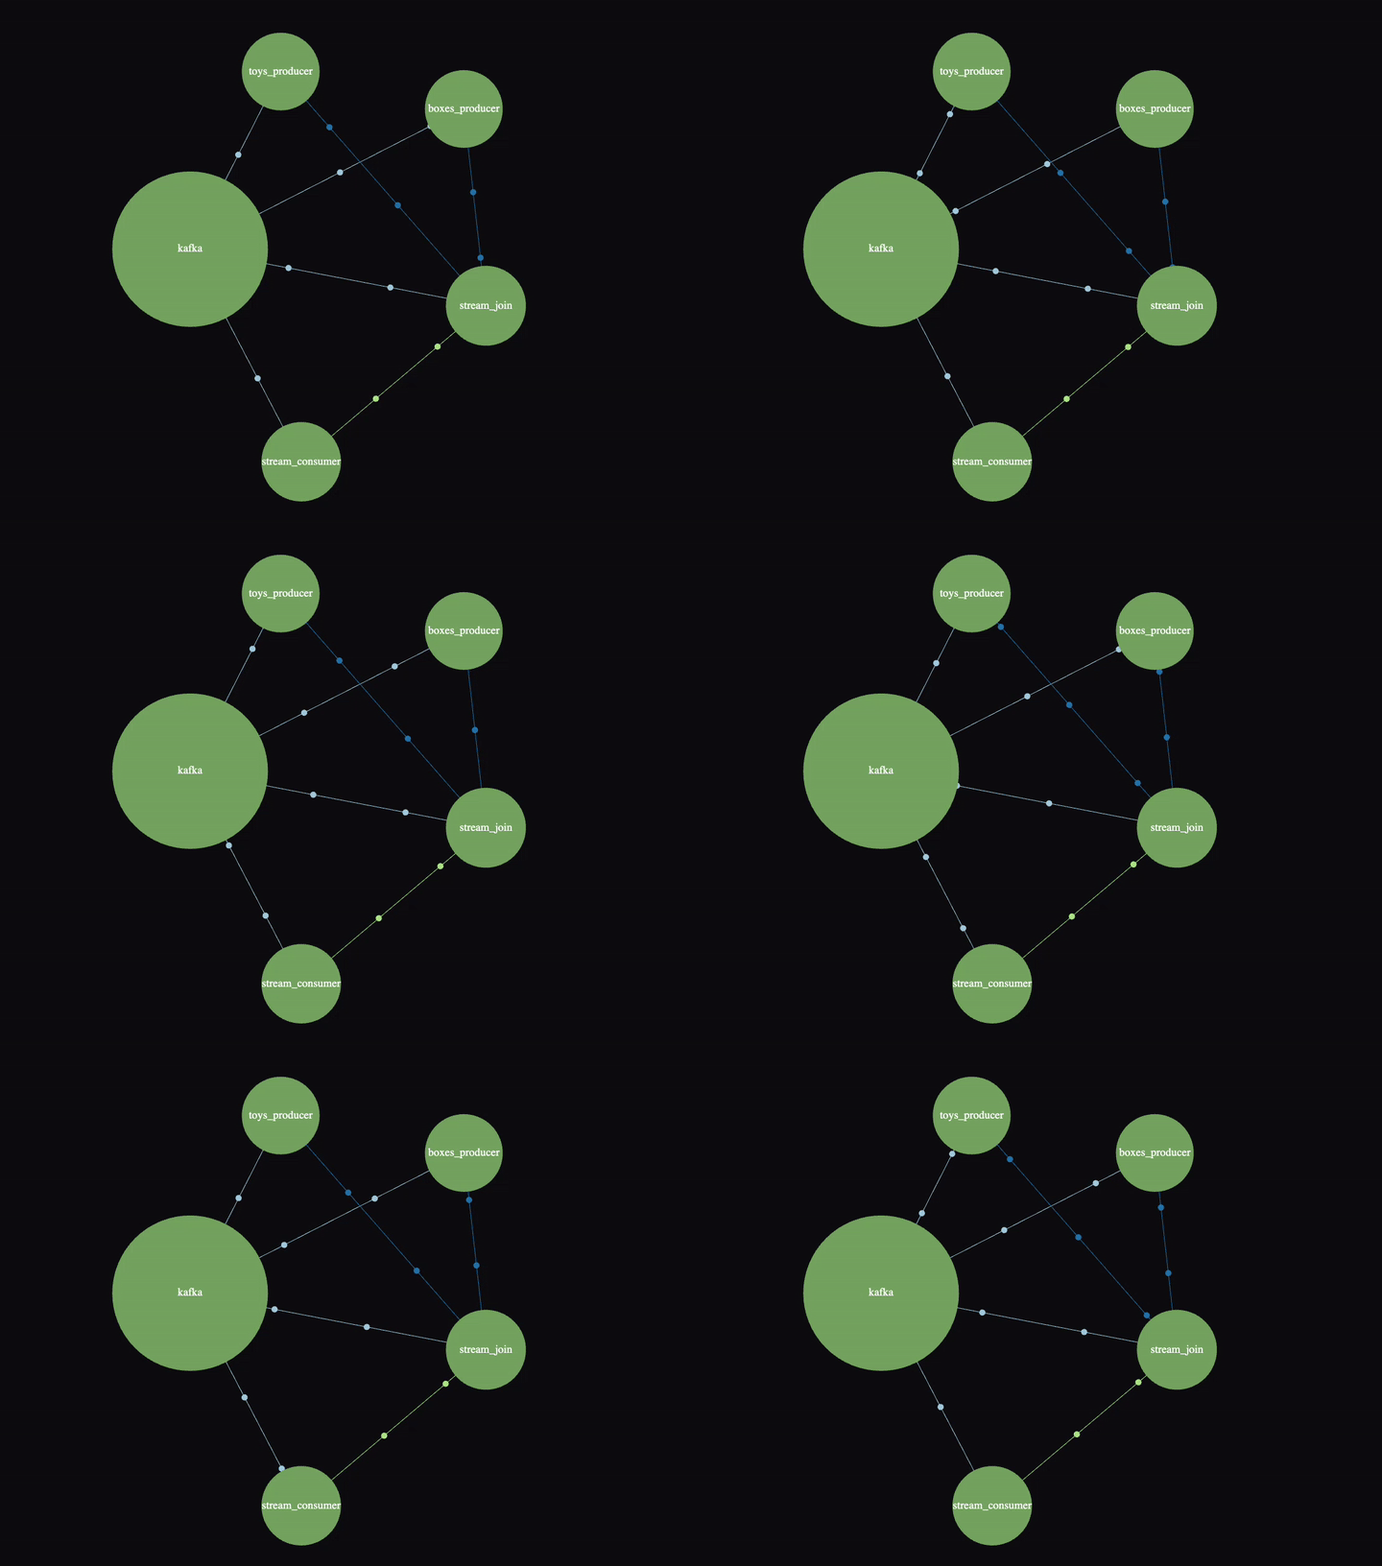
It’s animated, and if you click on the links/nodes you can see P99 latency, throughput and error rates. The Kafka cluster is a bit confusing until you realize that everything really is going via the cluster—it also shows the “direct” connections between producers, join, and consumer (and the Kafka cluster is used directly by the stream processor as well).
### 5. Uptrace
Now let’s check out [Uptrace](https://uptrace.dev/). Again, there’s a cloud version (both SigNoz and Uptrace have online demos you can try out as well), and here’s an example of configuring the join jar to send data to uptrace. This time I put the configurations into a file (join\_uptrace.config):
otel.exporter.otlp.endpoint=https://otlp.uptrace.dev:4317 otel.exporter.otlp.headers=uptrace-dsn=https://yourkey@api.uptrace.dev grpc=4317 otel.resource.attributes=service.name=stream\_join,service.version=1.0.0 otel.traces.exporter=otlp otel.metrics.exporter=otlp otel.logs.exporter=otlp otel.exporter.otlp.compression=gzip otel.exporter.otlp.metrics.temporality.preference=DELTA otel.exporter.otlp.metrics.default.histogram.aggregation=BASE2\_EXPONENTIAL\_BUCKET\_HISTOGRAM
1
2
3
4
5
6
7
8
9
10
otel.exporter.otlp.endpoint=https://otlp.uptrace.dev:4317
otel.exporter.otlp.headers=uptrace-dsn=https://yourkey@api.uptrace.dev
grpc=4317
otel.resource.attributes=service.name=stream\_join,service.version=1.0.0
otel.traces.exporter=otlp
otel.metrics.exporter=otlp
otel.logs.exporter=otlp
otel.exporter.otlp.compression=gzip
otel.exporter.otlp.metrics.temporality.preference=DELTA
otel.exporter.otlp.metrics.default.histogram.aggregation=BASE2\_EXPONENTIAL\_BUCKET\_HISTOGRAM
It’s used as follows:
java -javaagent:opentelemetry-javaagent.jar - Dotel.javaagent.configuration-file=join\_uptrace.config -jar join.jar
1
2
3
java -javaagent:opentelemetry-javaagent.jar -
Dotel.javaagent.configuration-file=join\_uptrace.config -jar
join.jar
The Uptrace “Service Graph” is nice. It shows the correct topology (no Kafka this time) and allows some customization to show values by in/out duration/rates, and filtering for edge times/rates:
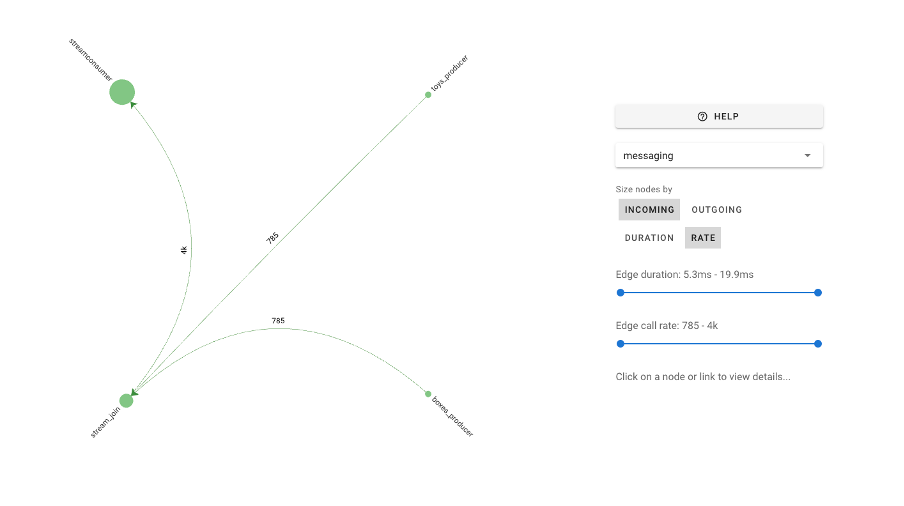
You can also select a node or link to get more information or change focus etc.
### 6. Conclusion: “Leave Lots of Traces”
It’s interesting that none of these tools show topologies between Kafka topics, but they all have good support for trace time viewing and “service name” topologies.
As a “thought experiment”, here’s a Sankey Diagram (built with [https://sankeymatic.com](https://sankeymatic.com/) ) showing an example flow with topic names included, for this example:
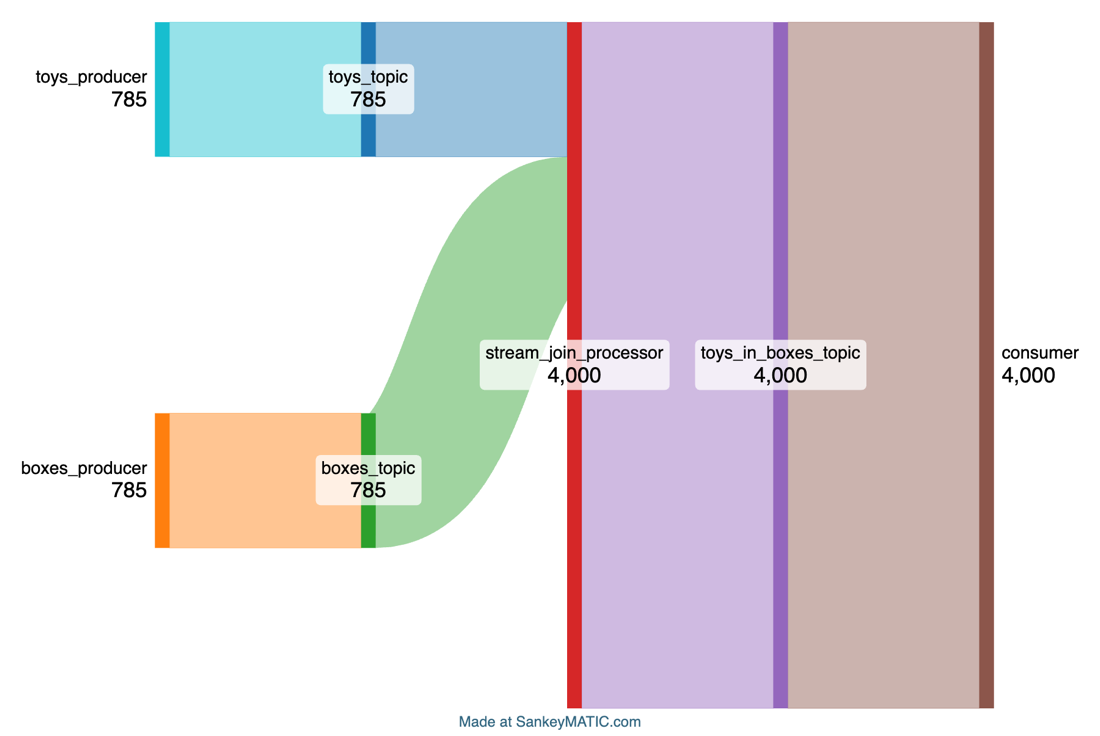
Sankey Diagrams are great for showing flows (in this example, line width is proportional to event/s, and you can easily see the fact that the stream\_join\_processor is producing more outputs than inputs):
Adding another consumer (2 consumer groups) we can see that the outgoing rate from the toys\_in\_boxes\_topic is now double in the incoming rate):
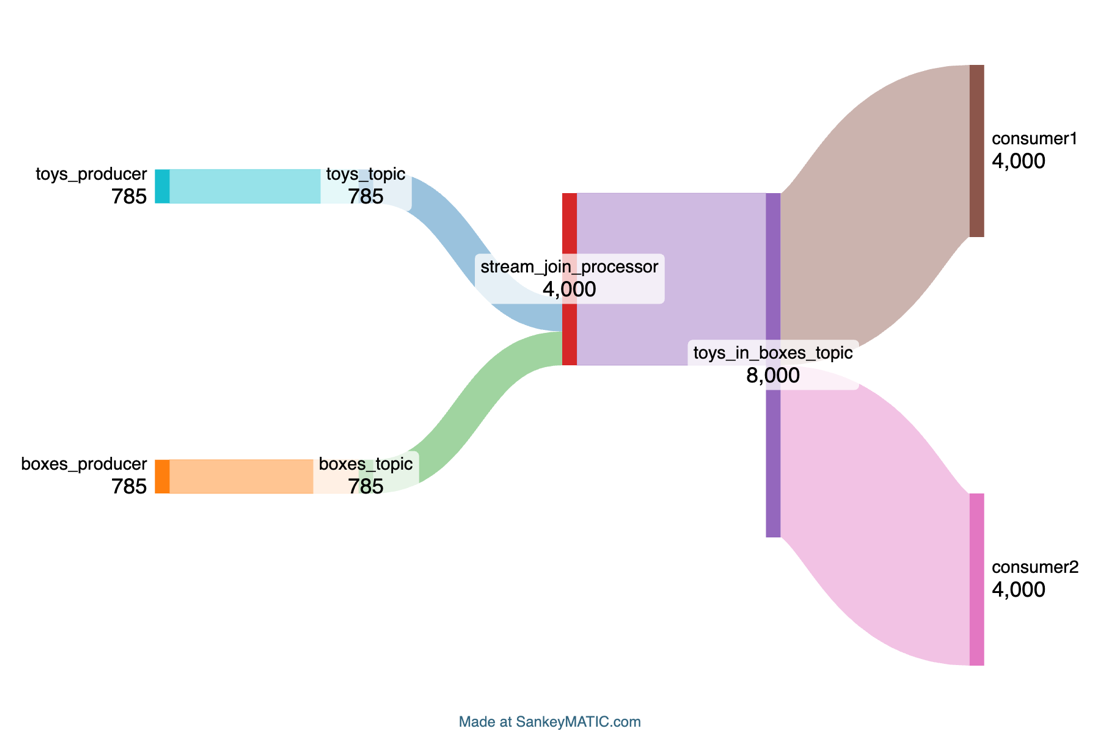
It should be also easy enough to incorporate fine-grained details including consumer groups/individual consumers, and topic partitions in this style of diagram.
For example, here I’ve included topic partitions (2 partitions per topic, p1 and p2), 2 stream processors, and multiple consumers in each group (1 for consumer1, 2 for consumer2)—this is useful to discover imbalanced writes/reads from partitions and sharing of load across stream processors and consumers in a group etc:
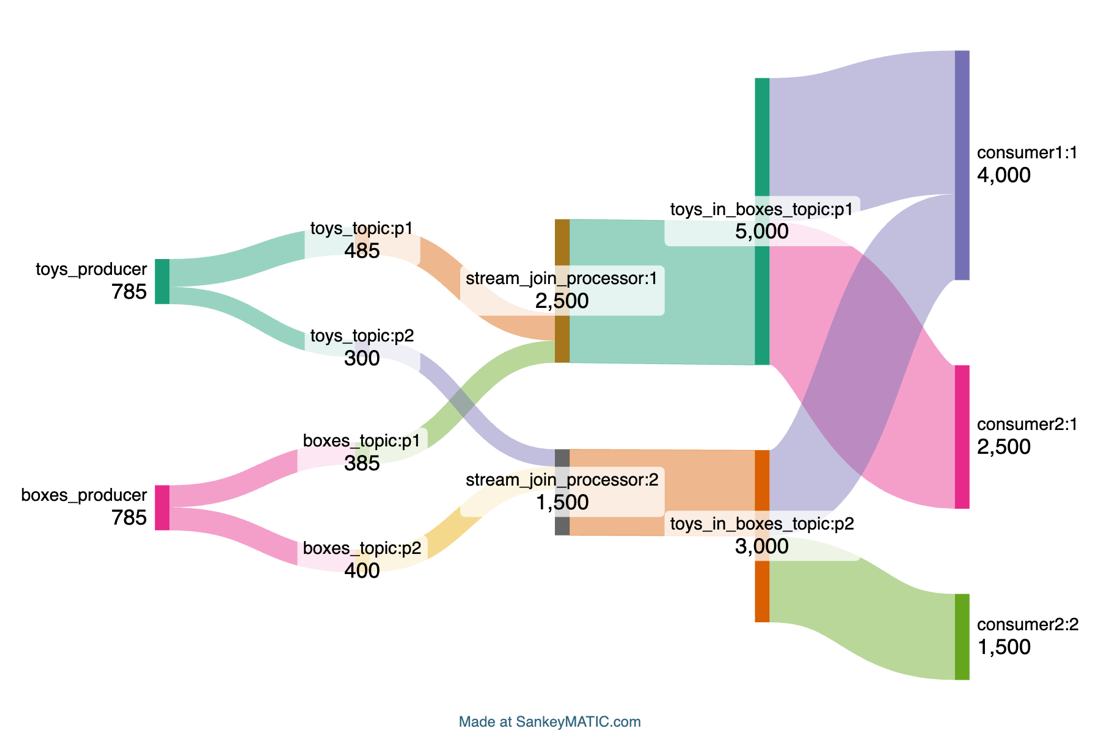
Hopefully, some of the open source OpenTelemetry vendors will explore this style of visualization for Kafka traces in the future.
As a final experiment I tried running a Kafka broker with OpenTelemetry, but it didn’t produce any data. I asked the OpenTelemetry community about this and they said support for Kafka brokers is coming in version 2 (my hope is that it will give visibility into Kafka cluster internals, maybe even replication).
What else did I notice about the performance of my Santa’s Elves packing assistance application using OpenTelemetry?
Something I noticed was that the latency of the last span between the steam join and the consumer is higher than the rest of the spans. Thinking about this I realized this makes perfect sense, as the join is windowed, and only emits matching toy+box solutions when there are matches found in a 60s window —in practice this means that the solutions are produced intermittently, increasing the average latency. The rate of the last span is also higher—this is because each toy often matches multiple boxes (and the matches are often batched with gaps between).
In conclusion, OpenTelemetry is now really easy to use with auto-instrumentation of Kafka Java clients, including Kafka stream processing, and there’s good support with multiple open source backends. I haven’t checked it with every Kafka component however, and it may or may not work with Kafka connect connectors or MirrorMaker2 without some modifications.
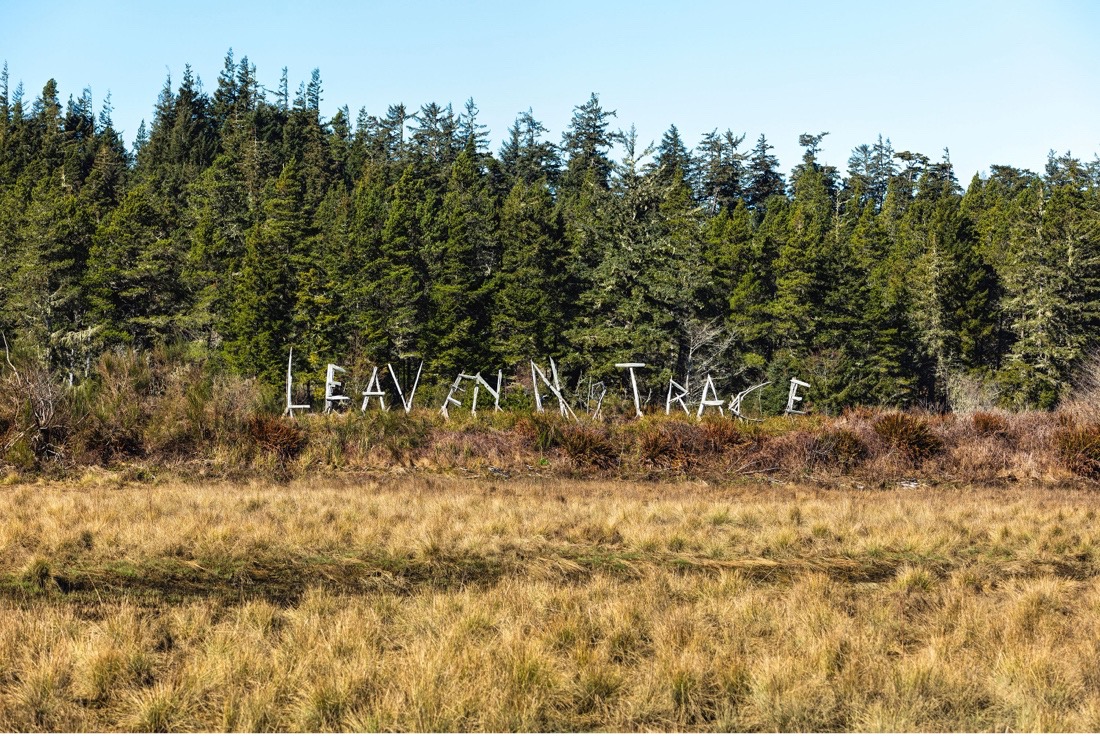
Unlike the “Leave no trace” philosophy for sustainable bushwalking, tracing Kafka applications is a good idea, so “Leave lots of traces”! Why not give it a go today with Instaclustr’s [Managed Kafka](https://www.instaclustr.com/platform/managed-apache-kafka/) service?
(Source: Adobe Stock)
***Thanks to SigNoz and Uptrace for providing access to their free trial versions!***
### Master Apache Kafka with expert insights
Struggling to strike the perfect balance between performance, scalability, and reliability in your Kafka ecosystem? Whether you're optimizing for zero downtime or maximizing resource efficiency, this guide has you covered.>
[ Free download ](/resources/ten-rules-for-managing-apache-kafka/)
### About the author
**[Paul Brebner](https://www.instaclustr.com/blog/author/paul-brebner/)** | Technology Evangelist at Instaclustr
Paul has extensive R&D and consulting experience in distributed systems, technology innovation, software architecture, and engineering, software performance and scalability, grid and cloud computing, and data analytics and machine learning.
![talk with experts icon]()#### Optimize your Kafka performance today!
Connect with our experts for tailored insights and solutions
### Related content
[ Zero Downtime Migration to Instaclustr
Yes, we can migrate existing Cassandra clusters to Instaclustr without any downtime. Here's what to expect from the process...
](https://www.instaclustr.com/blog/zero-downtime-migration-to-instaclustr/)
[ Workflow Comparison: Uber Cadence vs Netflix Conductor
When choosing what’s right for your company’s opensource workflow needs it is important to know the difference and similarities ...
](https://www.instaclustr.com/blog/workflow-comparison-uber-cadence-vs-netflix-conductor/)
[ Will Your Cassandra Database Project Succeed?: The New Stack
Open source Apache Cassandra® continues to stand out as an enterprise-proven solution for organizations seeking high availability...
](https://www.instaclustr.com/blog/will-your-cassandra-database-project-succeed-the-new-stack/)
×Get your
Free consultation
----------------------------