In the third blog of the “Around the World ” series focusing on globally distributed storage, streaming, and search, we build a Stock Broker Application.
1. Place Your Bets!
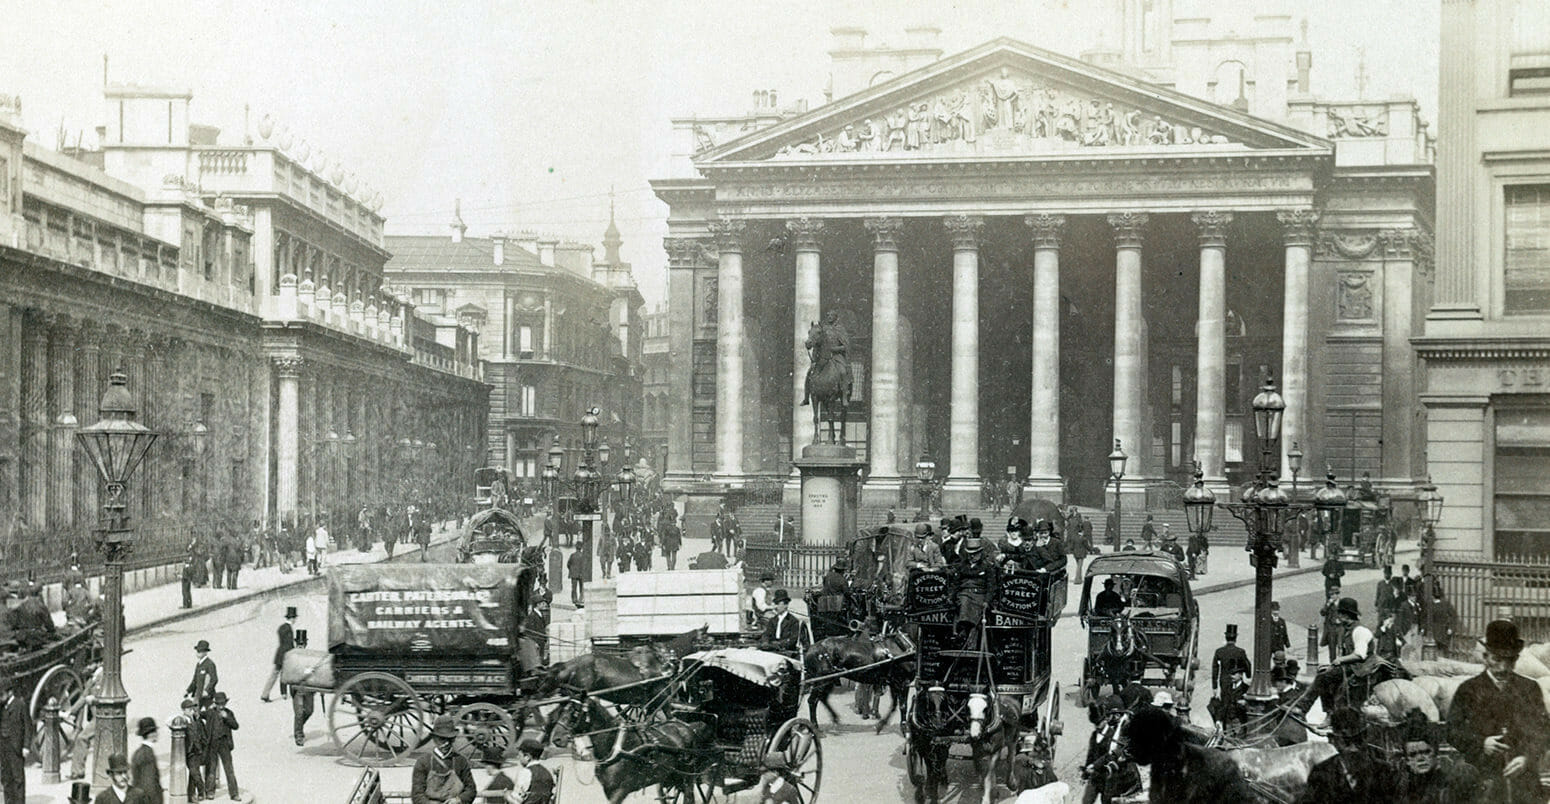
The London Stock Exchange
How did Phileas Fogg make his fortune? Around the World in Eighty Days describes Phileas Fogg in this way:
“Was Phileas Fogg rich? Undoubtedly. But those who knew him best could not imagine how he had made his fortune, and Mr Fogg was the last person to whom to apply for the information.”
I wondered if he had made his fortune on the Stock Market, until I read this:
“Certainly an Englishman, it was more doubtful whether Phileas Fogg was a Londoner. He was never seen on ‘Change, nor at the Bank, nor in the counting-rooms of the “City“‘
Well, even if Fogg wasn’t seen in person at the ‘Change (London Stock Exchange), by 1872 (the year the story is set), it was common to use the telegraph (the internet of the Victorian age, which features regularly in the story) to play the market.
In fact the ability of the telegraph to send and receive information faster than horses/trains/boats etc. had been used for stock market fraud as early as 1814! (The “Great Stock Exchange Fraud of 1814”). Coincidentally (or not?), the famous London Stock Exchange Forgery, also involving the telegraph, also occurred in 1872! Perhaps this explains the ambiguity around the origin of Fogg’s wealth!
“Not only the members of the Reform, but the general public, made heavy wagers for or against Phileas Fogg, who was set down in the betting books as if he were a race-horse. Bonds were issued, and made their appearance on ‘Change; “Phileas Fogg bonds” were offered at par or at a premium, and a great business was done in them. But five days after the article in the bulletin of the Geographical Society appeared, the demand began to subside: “Phileas Fogg” declined. They were offered by packages, at first of five, then of ten, until at last nobody would take less than twenty, fifty, a hundred!”
The 1870’s also saw the introduction of a new technological innovation in Stock Trading, the Stock Ticker Machine. Stock tickers were a special type of telegraph receiver designed to print an alphabetical company symbol and the current price of that company’s stock on a paper roll called ticker tape. This enabled stock prices to be communicated closer to real-time across vast distances and revolutionized trading.
Fast forward 128 years from 1872 to 2000 and technology looked a bit different. I’m taking inspiration from an earlier project I worked with from 2000-2003 at CSIRO (Australia’s national science research agency) called “StockOnline”. This was an online Stock Broker application designed to benchmark new component-based middleware technologies, including Corba and Enterprise Java (J2EE). The original version simulated traders checking their stock holdings and current stock prices, and then buying and selling stocks, resulting in revised stock holdings. The benchmark could be configured with different workload mixes, and the number of concurrent traders could be scaled up to stress the system under test. Metrics captured included the relative number, throughput, and response time of each of the operations.
Some of the technology innovations that the project was designed to give insights into included:
the use of application servers to provide easy to manage and scalable container resourcing (yes, containers are at least 20 years old);
how portable the application was across multiple different vendors application servers (sort of);
the impact of JVM choice and settings (lots);
explicit support for component configuration (e.g. wiring components together); and
deployment into containers, rich container services, and multiple persistence models to manage state and allow database portability (e.g. Container Managed Persistence vs. Bean Managed Persistence).
At the end of the project, we made the StockOnline code and documentation open source, and I recently rediscovered it and made it available on Github. I was surprised to learn that Enterprise Java is still going strong and is now run by the Eclipse Foundation and called “Jakarta EE”. Also interesting is that there is support for persistence to Cassandra.
Modern stock markets are fast-moving, ultra-competitive environments. Orders are sent to the market by high speed networks and executed almost instantly. This makes low-latency trading a key to profitability. Trade related latency is any delay in the time it takes for a trader to interact with the market and includes distance related network delays, delays in receiving and acting on information, and delays caused by brokers (e.g. queuing of orders, delays interacting with the stock exchange to trade the orders, etc.). Some of the key solutions to reducing latency are broker side hosting of orders (orders are hosted on brokers and automatically traded when conditions are met), and Direct Market Access (brokers are as close as possible to stock exchanges, with super-fast network connections).
A new type of US Stock Exchange (IEX) was even created to address some of the issues around the fairness of stock trading due to latency. Some brokers are able to take advantage of even small latency differences – “price snipping”, or so called “dark pools” which fill orders from within a pool rather than via public stock exchanges, to make huge profits. Although, somewhat oddly, the IEX leveled the playing field by introducing delays to ensure that no one playing the market has more up-to-date information than anyone else.
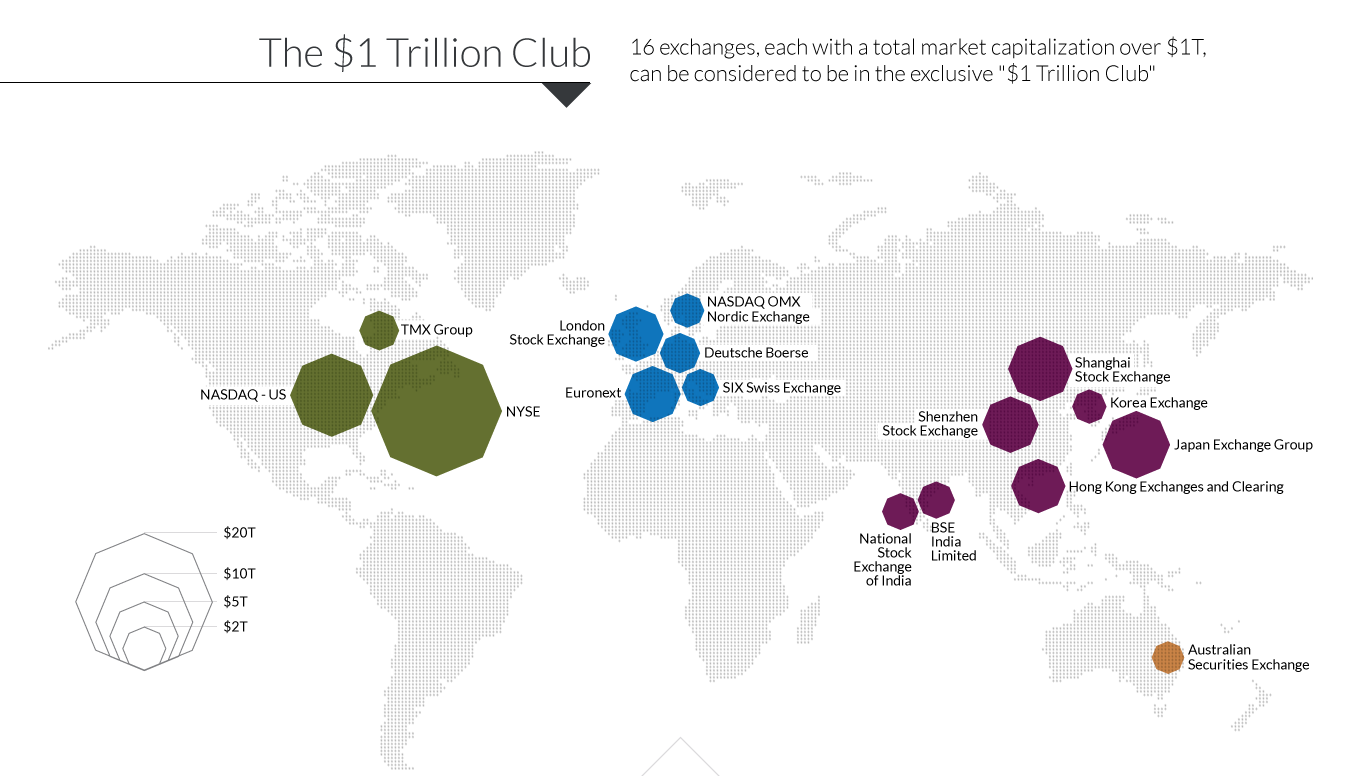
Latency is partially caused by the global location of stock exchanges. Where are stock exchanges located? There are 60 exchanges around the world on every continent with a total value of $69 Trillion, and 16 worth more than $1 Trillion each!
4. Initial Application Design
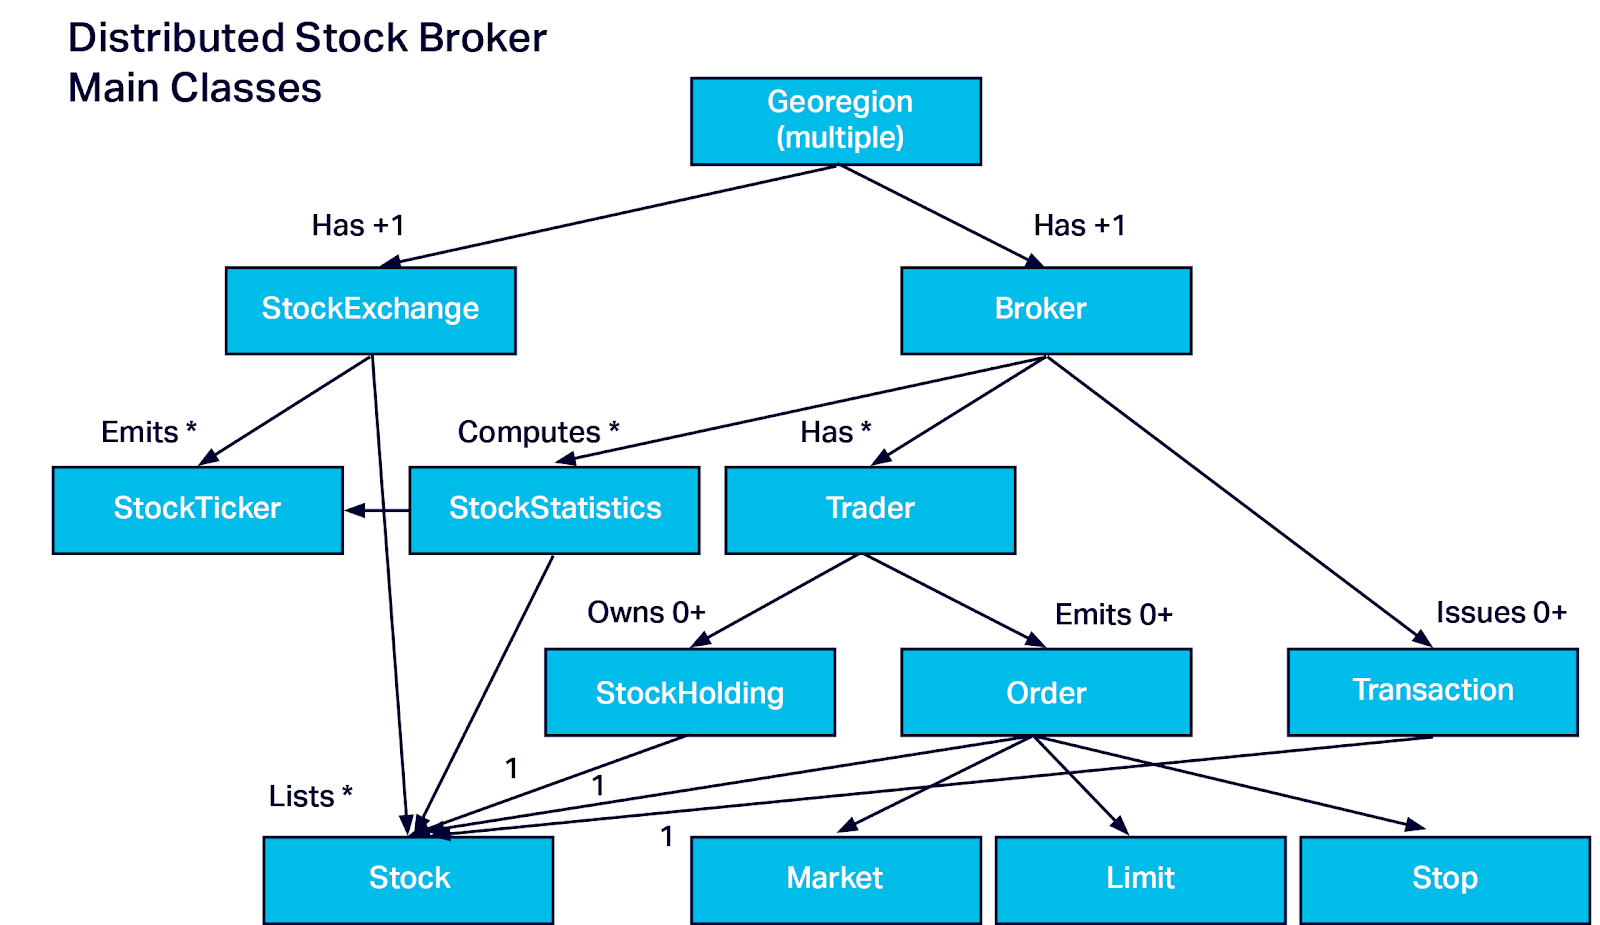
I had already started writing a new version of StockOnline before I rediscovered the original, so the new version doesn’t share any of the original code. However, it does turn out to have similar entities, but with some significant differences to model multiple StockExchanges and Brokers. Here’s the UML Class diagram of my new prototype code:
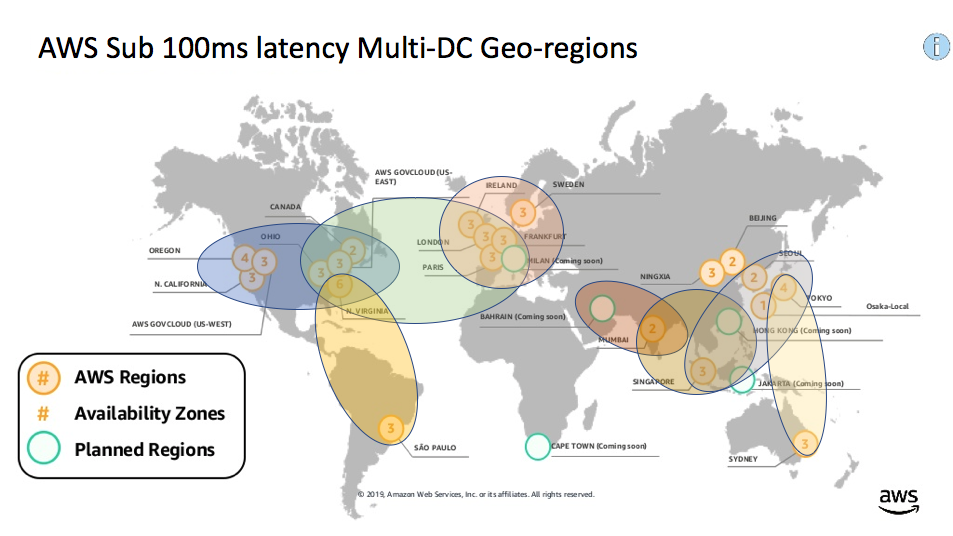
The first major difference is that it’s designed to model and simulate distributed stock brokers across multiple global “georegions”. We introduced the concept of georegions in blog 1 (called “latency regions”) and blog 2 (called “georegions”). A georegion is a geographic region that has at least two AWS regions (for data center redundancy), and ensures that applications within the same georegion are within 100ms latency of each other and users in the same georegion in case of failure of one region. Here’s the map from the previous blogs showing the eight sub 100ms latency georegions that we identified (North America, South America, Atlantic, Europe, Middle East, Central Asia, East Asia, Australasia):
This means that I have to explicitly model multiple StockExchanges. Each StockExchange is in a particular location in a georegion. Each StockExchange is responsible for listing some stocks, providing meta-data about the stocks, publishing changes to stock prices as StockTickers, and matching buy/sell orders (i.e. executing trades). For simplicity, we assume that each stock is only listed on a single StockExchange.
Each georegion has one or more StockBrokers which are co-located in the same georegion as some StockExchanges to ensure low-latency (and potentially redundancy). The StockBrokers are responsible for discovering StockExchanges, all the stocks listed for trading, obtaining StockTickers to update current price data, and computing trends and longer-term Stock Statistics that inform traders making decisions about buying and selling. They are also responsible for keeping track of trader data, updating StockHoldings for Traders, keeping track of orders and trading them on the appropriate StockExchanges, and keeping records of trades (transactions). Also different to the original version (which only had a single Market Order type), I wanted to have multiple different order types including Market, Limit and Stop Orders. This is important for the latency story as market orders are traded “manually” and immediately, but Limit and Stop Orders are traded automatically when they meet specific conditions, so can be traded very quickly and in larger volumes, this is a good explanation).
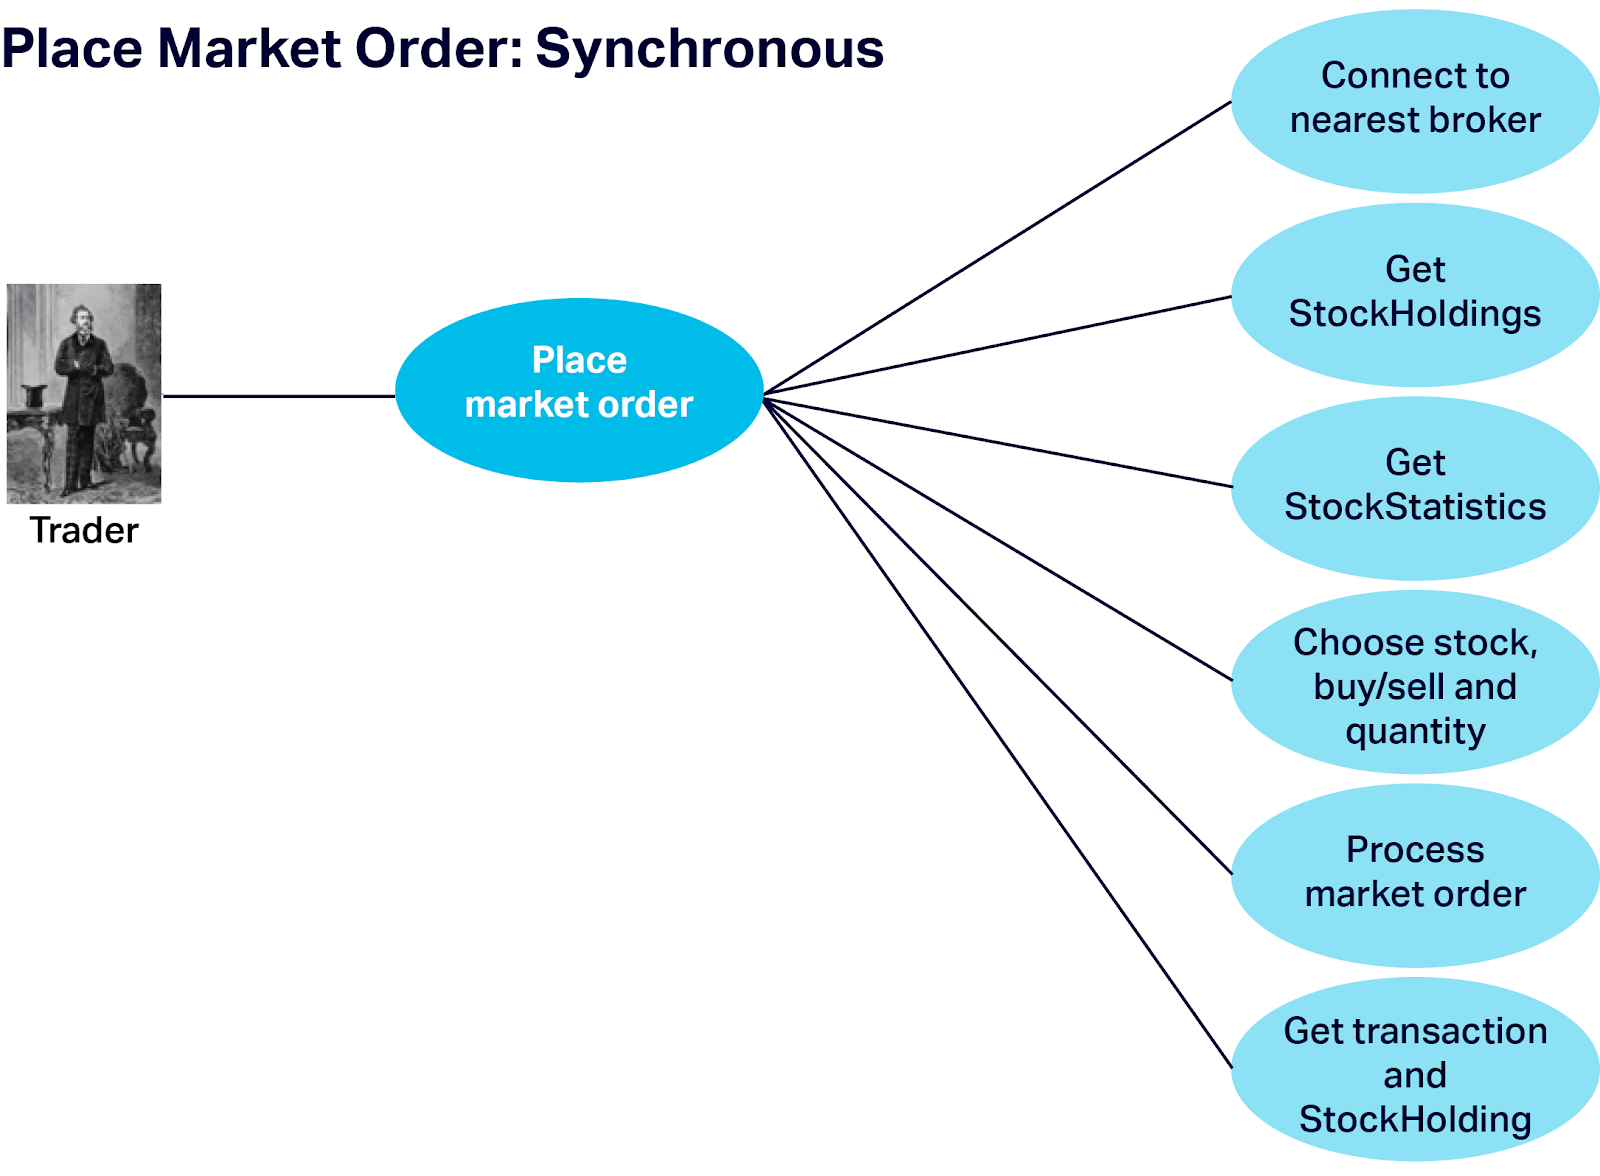
We assume that traders connect to their nearest StockBroker (to reduce latency and possibly to satisfy local financial rules). There is a series of operations supported by StockBrokers for traders, and also for interacting with the StockExchanges as follows. First let’s look at the workflow for trading Market Orders, “Place Market Order”. These are essentially synchronous and immediate trades. The trader connects to the nearest broker, gets their current StockHoldings and current StockStatistics (for their holdings and possibly for other stocks they don’t currently own). Based on this information they decide what stocks to trade, whether to buy or sell, and the number of stocks, and create a Market Order. The broker then processes the Market Order (which may involve sending it to another broker), and receives confirmation that the trade occurred (including price, quantity, transaction ID, etc.), and finally update the trader’s StockHoldings for the stock traded.
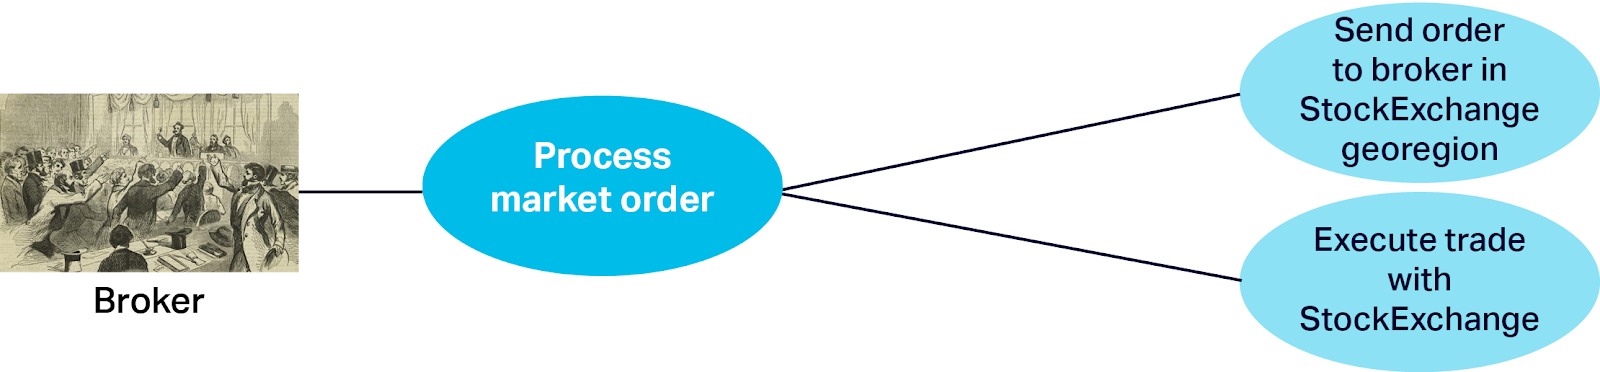
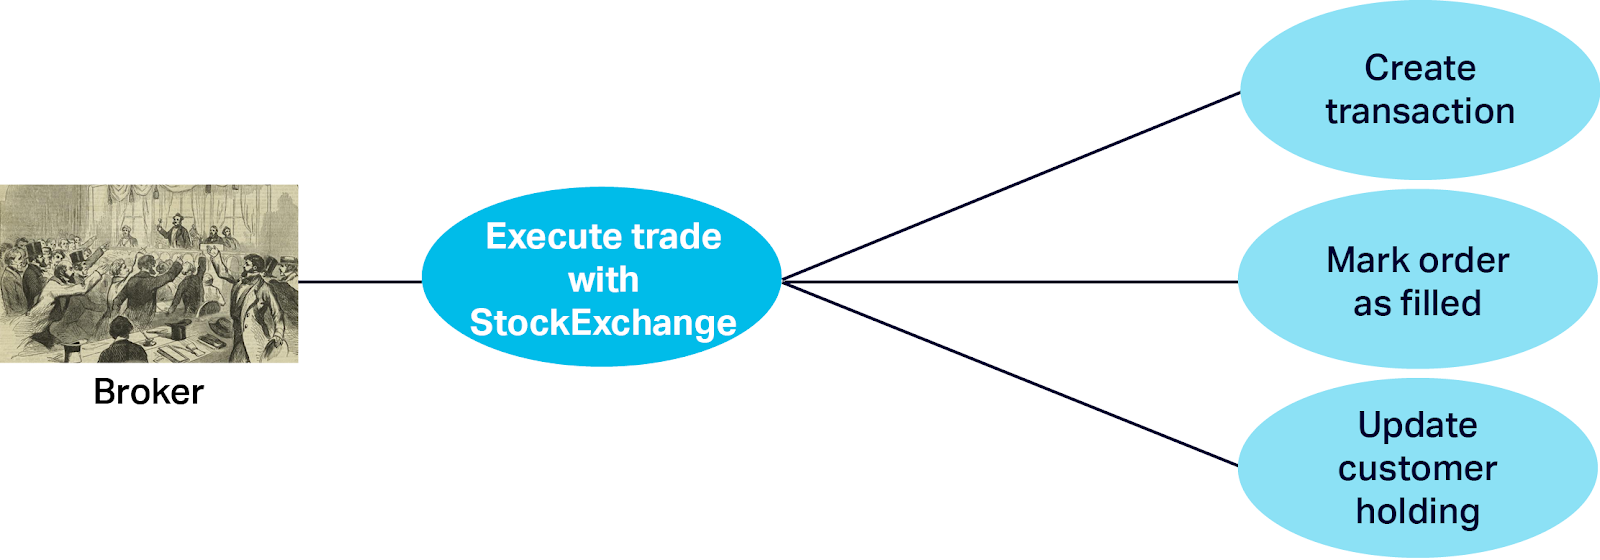
The steps to “Process Market Order” are as follows. The order is sent to a broker in the same Georegion as the StockExchange listing the stock. This broker then immediately executes the trade (buys or sells) with the StockExchange, gets the transaction details, marks the order as filled (so it isn’t processed more than once), and updates the StockHolding amounts for the trader.
The “Execute Trade with StockExchange” assumes that trade is always possible (at the current price) and will occur instantaneously and completely, and has the following substeps:
Market Orders are potentially a slow process due to all the synchronous steps, “think time” for the trader, and cumulative latencies due to the trader to broker, broker to broker, and broker to StockExchange communication paths.
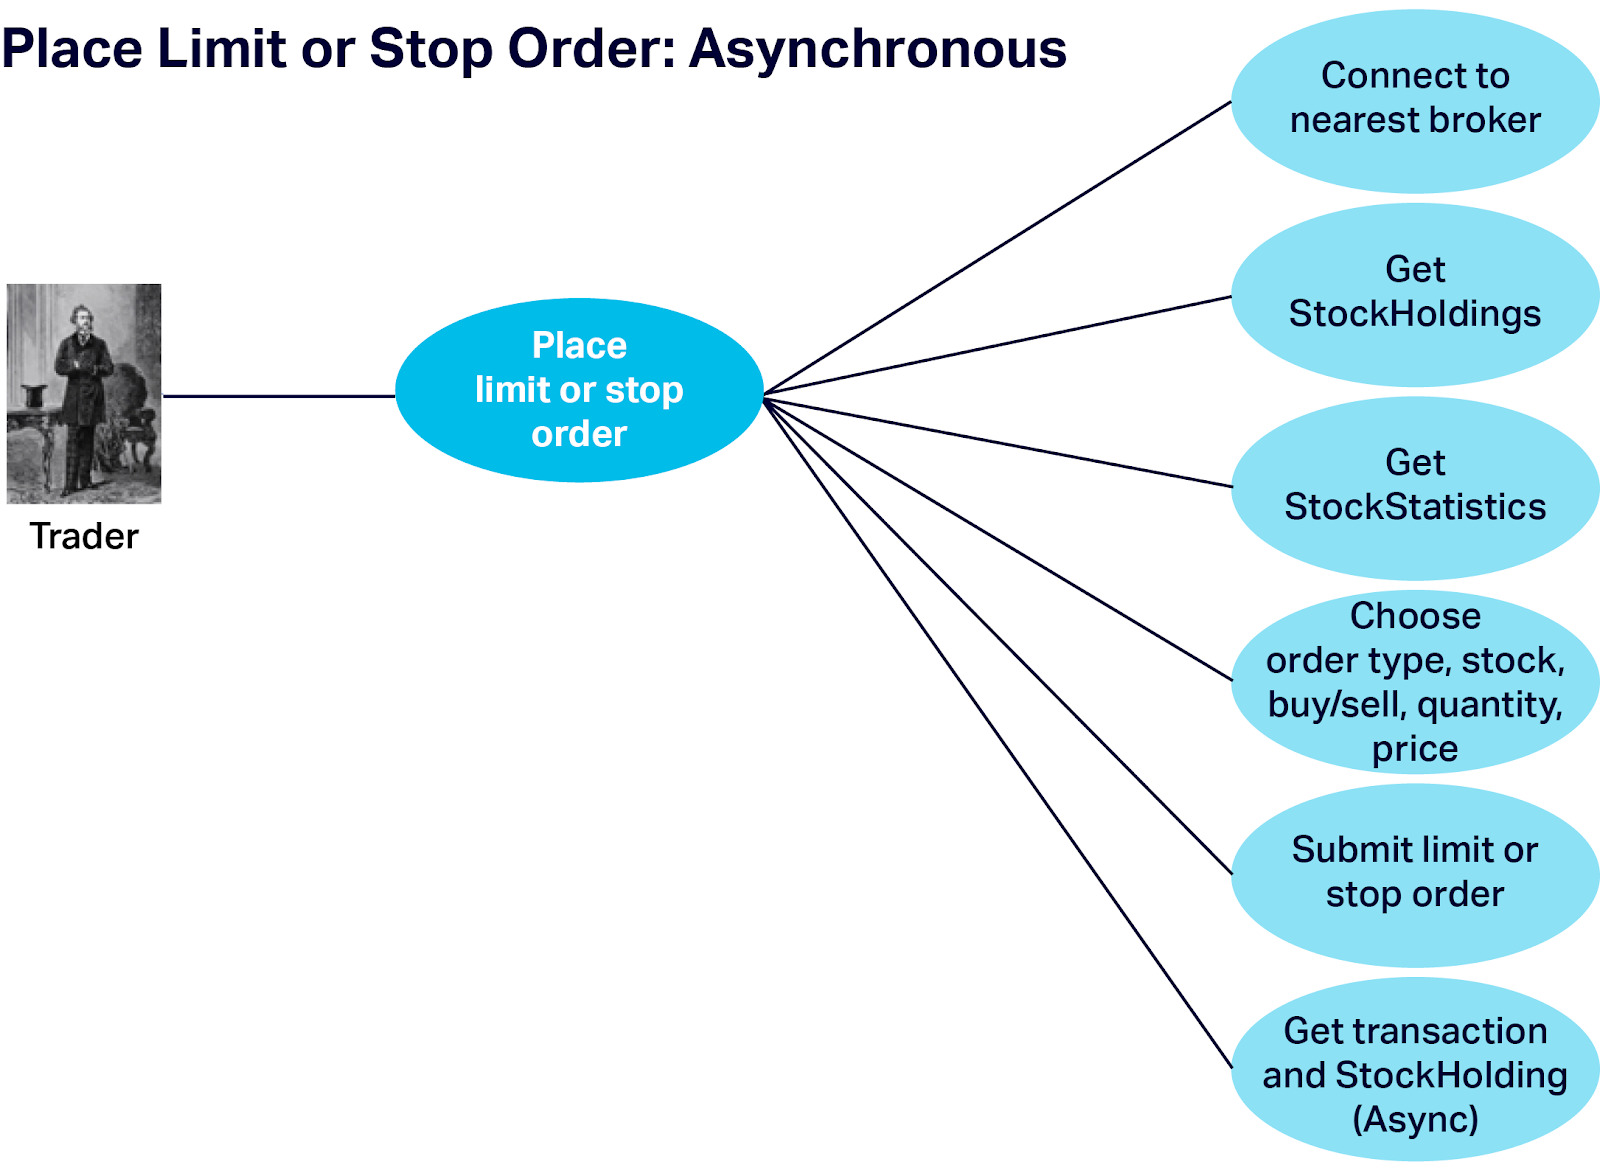
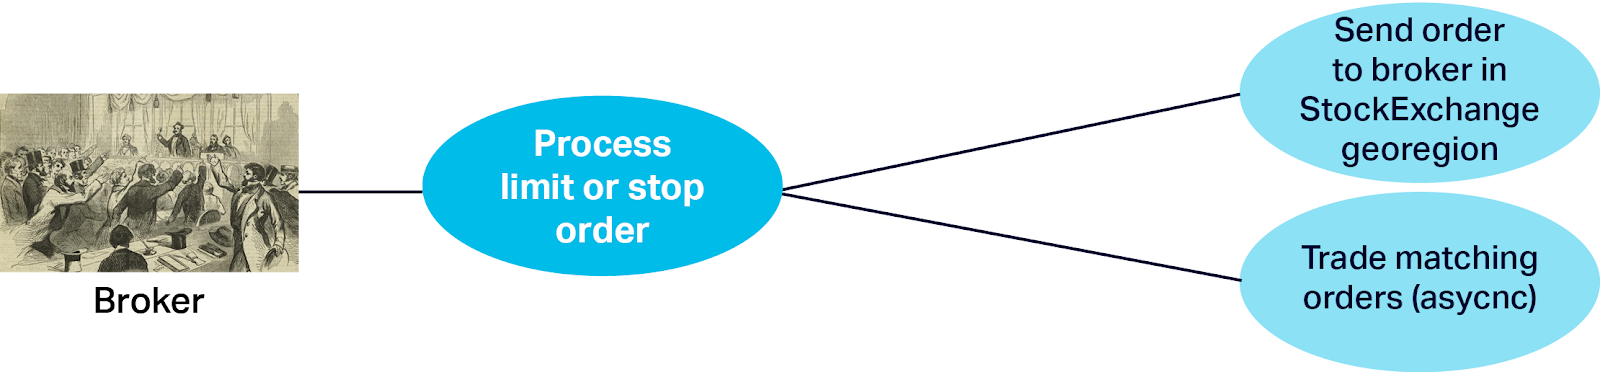
As an alternative, we also provide some asynchronous Order types: Limit and Stop. These order types are only traded when the conditions are met, but then need to be executed as quickly as possible to prevent losses in a fast moving market.
We assume that the initial steps are mostly the same as “Place Market Order”, but with the added choice of Limit of Stop Order, and the limit price and the final step (notification of eventual Trade) is asynchronous:
Once the Order placed, it is processed by sending it to the correct broker (as for Market Orders), and then that broker is responsible for continuously checking orders to see if they match:
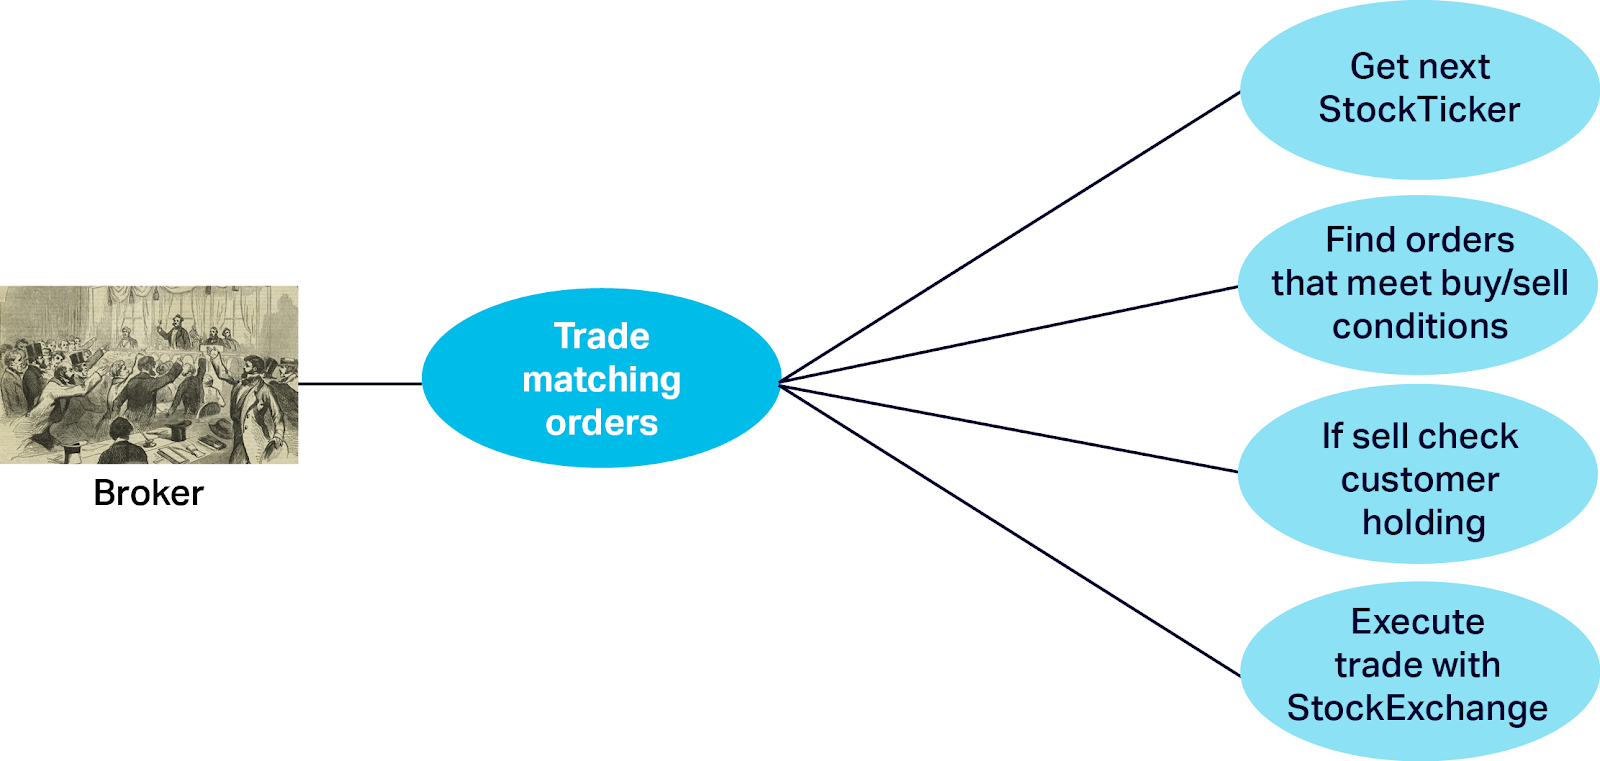
This is done as follows (“Trade Matching Orders”) and relies on each broker receiving a stream of StockTicker updates from the StockExchanges in the same georegion. For each StockTicker the broker finds orders for that stock, and checks which orders meet the buy/sell conditions (the logic depends on the order type, if the price is rising or dropping, and if the current price is less than or greater to the order limit price). If the matching order(s) are Sell Orders then an extra step is to check that the trader still has sufficient holdings of that stock (they may have already sold some stock due to other orders being executed first). If all conditions are met then the broker initiates an immediate “Market” trade with the StockExchange as before.
The initial prototype application code is written in pure Java and just simulates the expected behavior of the traders, brokers, and StockExchanges. It creates a specified number of georegions, brokers, StockExchanges, stocks, and traders with initial data. Then the simulation runs lots of rounds (seconds) for a specified period (e.g. a day). Each round results in traders checking their holdings and StockStatistics, and creating orders (about ⅓ of each type, but only if the type matches the specific stock and market conditions). The orders are sent to the correct brokers. Each round the brokers receive simulated StockTickers from StockMarkets in the same georegion (using a pseudo-random walk which keeps the stock direction for the majority of the time, but occasionally changing direction). Some stocks are more volatile than others so change faster. Each round the brokers immediately Trade Market Orders, and check the conditions and trade matching Limit or Stop Orders.
5. Initial Simulation Results—“Time Is Money”!
The simulation computes business level metrics including a number of trades, value of trades, etc., and expected end-to-end latency based on deploying brokers in 8 georegions, and using the AWS inter-region latencies from blog 1 of this series. This gives us a baseline to eventually compare the real results with. The average latency to get the current stock price from a remote StockExchange and “Process Market Orders” is 700ms (max 1.2s), which includes multiple times for intra-region and inter-region networking. The average latency for Limit and Stop “Trade Matching” Orders is shorter at 100ms (max 200ms), as it only includes times to get StockTicker updates and the time to trade;. i.e. it doesn’t include any AWS inter-region latencies as the operation is asynchronous and processed entirely within the georegion of the broker/StockExchange (we expect this to be slightly higher in practice due to the eventual overhead of database lookups and condition checking on the broker).
So is the saying “Time Is Money!” true in the context of low latency trading, and how much money exactly? I added a calculation to the simulation to compute potential profit losses assuming high volatility in the prices of some stocks, and higher latency times to trade. Due to potentially high volumes of trades, even a small profit loss per trade can add up to big losses in profit very quickly. For one simulation run with 2,101 completed trades, the potential profit loss for the higher latency Market Orders was 0.7% of the trade value (or Market Orders), but for the lower latency Limit and Stop Orders it was significantly less at 0.1% of the trade value (for those order types). For an average order size of $20,000, this corresponds to a $140 profit loss per Market Order, compared with only a $20 profit loss for each Limit and Stop Order. Over hundreds or even thousands of trades per day (typical of HFT) this would quickly add up to significant amounts of money! Moreover, to make a profit, High Frequency Trading (HFT) relies on conducting a high volume of trades to rapidly take advantage of very small movements in prices, with potentially smaller profits per trade. So it’s easy to see why minimizing latency is a worthwhile goal in Fintech applications such as this.
6. What Next?
In the next few blogs, we’ll continue our journey “Around the World” and explore how to refine the initial simple design of the application so as to deploy and run it across multiple georegions using multiple AWS regions.
Initially, this will involve mapping the components to Cassandra tables on a single data center. Once it’s working correctly with a single Cassandra data center, we’ll extend it to use multiple Cassandra data centers, which will require the use of multiple keyspaces for different replication topologies (e.g. replication across pairs of data centers vs. all data centers). We’ll also work out if, and how, to load-balance the application across multiple data centers in the same georegions, and how to enable redundancy, failover, and recovery at the application level. It’s possible that a Kubernetes federated microservices mesh framework will help in doing this. We also plan to put Kafka to use to enable streaming StockTickers, so we’ll be investigating Kafka’s multi data center replication.
7. Further Resources
IBM also has a StockTrader demonstration application, and an in-depth series about deploying it using Cassandra, Kafka, Redis, and Kubernetes.
There’s an example of stock analysis using Elasticsearch (I’m planning on using Elasticsearch to analyse the stock trends, and provide some map-based visualisation of the data).