


Prometheus and Grafana are both open source tools that can be used to monitor and set up alerting for your clusters. Although Instaclustr does do monitoring and alerting if you are using our managed service, these tools let you do your own monitoring and alerting for your clusters.
Creating a Cluster in the Console
Creating an Instaclustr Account
If you have an Instaclustr account, you can go ahead and move onto the next step.
In order to create an account, you can get started by going to the sign up page here and entering your email, username, full name, company name, and password: https://console.instaclustr.com/user/signup.
MFA (Multi-Factor Authentication) is optional but it’s use is highly encouraged. This can be done using an App such as Authy, Google Authenticator, or Duo Security.
Creating a Cluster Within the Instaclustr Console
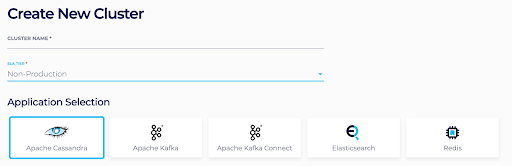
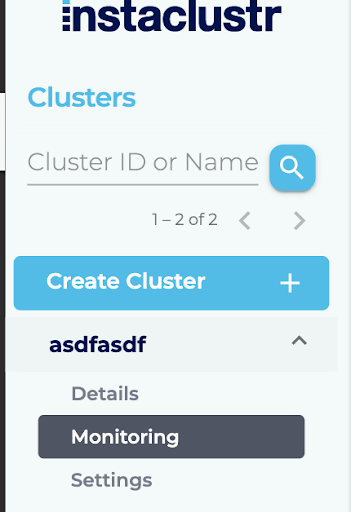
In order to create a cluster within the Instaclustr Console, you should first click on “Create Cluster” on the left side panel.
The next step is to create a name for the cluster, note if it is a production or non-production cluster, and then select what type of cluster you want to create. The options are Redis, Apache Cassandra, ZooKeeper, Kafka, Kafka Connect, or Elasticsearch. Additionally, you can select the version that you wish to create.
Non-Production clusters have half the management cost, but can only be used for non-production purposes such as testing and QA. They also do not apply to our normal Service Level Agreements and go by “best effort” in regards to uptime.
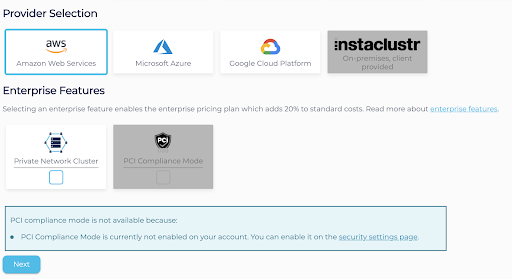
The next step is to select the cloud provider that you wish to use with the application. The primary providers are Amazon Web Services, Microsoft Azure, and Google Cloud Platform. In some cases you can use IBM cloud or on premise by contacting us.
Additionally, you are able to select Private Network Cluster or PCI Compliance Mode. Selecting any one of these will add a 20% uplift to your account and classify it as an Enterprise plan. However, with this you will be able to use all the enterprise features.
From here you are able to select the version that you wish to deploy, the replication factor, as well as several options that will be different depending on what you chose. Additionally, you are able to choose among the enterprise add-ons, which work just like the enterprise features.
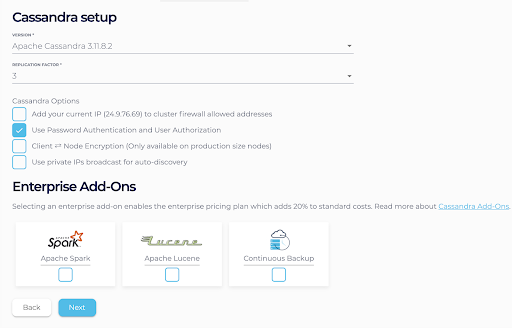
If you select any one of the enterprise add-ons or enterprise features there will be a 20% uplift to your account and it will be put on the enterprise plan. However, after one is selected you will be able to use the others at no additional cost.
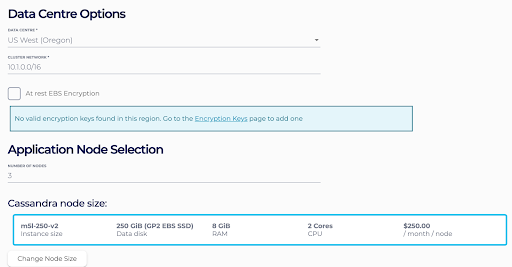
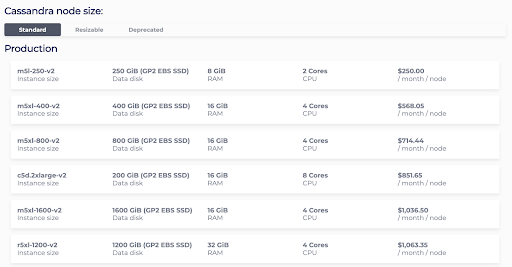
Next, you are going to select the Data Centre (Cloud Region), cluster network, the number of nodes, and which node size you would like. Please keep in mind that the number of nodes must be equal or greater than the replication factor. You can see that there are many different node sizes to select from.
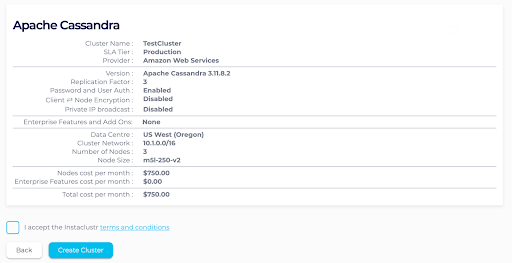
From here you will be able to get a summary of what you have selected. If everything looks good, you then will be able to accept the terms and create the cluster. Cluster creation should take a few minutes for a small cluster, and the longer the larger the cluster is.
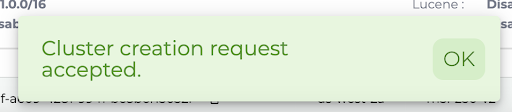
The provisioning system will then begin to create your cluster, which should be deployed and running within a relatively short period of time. The cluster should now be ready for development or production.
Looking at Metrics
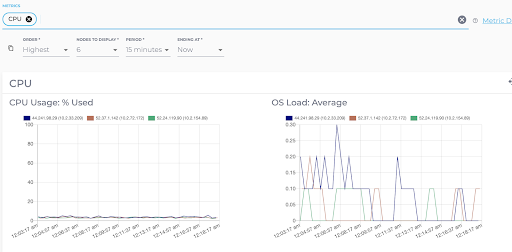
Metrics can be viewed through the Instaclustr Console and additionally via the Instaclustr API. In order to view the metrics in the Instaclustr Console, click on the monitoring tab under the cluster you wish to view in the left sidebar.
You will then be able to view metrics including CPU usage, disk usage, reads/sec, writes/sec, and more.
In the next section we will take a look at how to use the Monitoring API with Prometheus and Grafana for data visualization and monitoring.
Connecting to the Instaclustr API
Getting Your API Keys
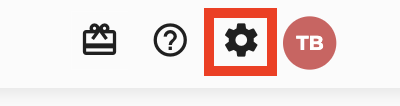
The Instaclustr API utilizes REST APIs to provision clusters, monitor clusters, and more in your Instaclustr account. In order to get authenticated with your account and be able to connect, you will need to access the keys within your account. To start this process, log into your account and click the account settings button in the top right of your account page. It is the gear icon.
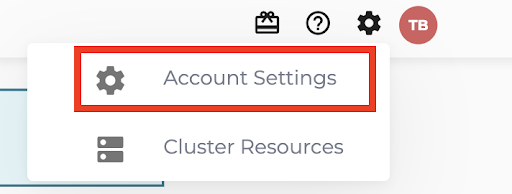
Then click the account settings in the menu that drops down.
From here click the “API Keys” tab in the menu. 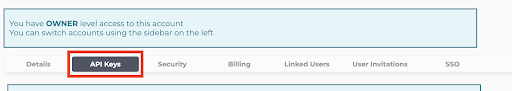
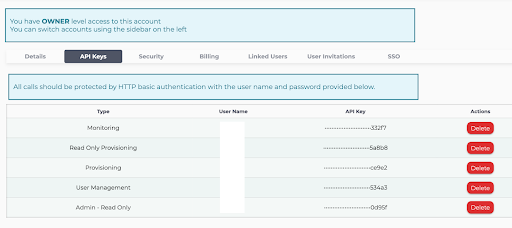
From here you are able to generate API keys for monitoring, read-only provisioning, provisioning, user management, and admin read-only. In this case we will need the provisioning API key. The user name and API key are needed to authenticate. Please remember to save the API key when it is generated as it will only be shown once.
After you have received and saved your API keys, you can use them to authenticate with the Instaclustr API.
Provisioning API
The Instaclustr Provisioning API allows users to provision resources through a REST API. You have full control of what you deploy, delete, and more and implement it directly into your code. You can view the Provisioning API documentation here.
Instaclustr Terraform Provider
Terraform can also be used to manage and provision resources with Instaclustr’s Terraform provider. Instaclustr has a Terraform provider that allows you to use Terraform to manage your infrastructure within Instaclustr. More information on this can be found in the Instaclustr Terraform Provider github.
Connecting to the Monitoring API
The Instaclustr Monitoring API is commonly used to view different metrics within your Instaclustr cluster. It is a REST API that allows you to monitor many things with your cluster such as CPU usage, disk utilization, and more. The benefit of this is that you are able to use tools such as Prometheus or Grafana and put the data into action or usable formats.
For more information and on how to use the Monitoring API, please view the Monitoring API documentation here.
Using External Tools With the API
Grafana and Prometheus are popular open source tools that are very effective at visualizing data, monitoring, alerting, and more. Grafana is an analytics and monitoring solution that is primarily used for visualization. A good use for it is to help someone understand complex data through charts and other visual means. Grafana can be downloaded here and the quick start setup can be found here.
Prometheus is an event monitoring and alerting tool. Prometheus was made with the idea of monitoring multiple microservices at once. It stores data locally, and then runs over the data to set up alerts. Prometheus can be downloaded here and the quick start setup can be found here.
Using Prometheus for Alerting
Prometheus can be used for monitoring and altering when used with the Instaclustr Monitoring API. After you have set up Prometheus using the instructions that are linked above, you need to set up the prometheus.yml file to be able to connect to Instaclustr. The prometheus.yml file should be placed in the data folder within the prometheus installation folder.
If you are using a managed service with Instaclustr we automatically monitor and have alerts to ensure that there are no problems with your cluster. You are free to monitor them as well however. In other cases, prometheus is a very popular and free to use tool for alerting.
If you don’t see a prometheus.yml file, go ahead and create one with the code below. If there is one, edit the current one. The code below should be the prometheus.yml fine with your appropriate information in the “<” and “>” brackets:
1 2 3 4 5 6 7 8 9 10 11 12 13 14 | global: scrape_interval: 1m scrape_configs: - job_name: 'instaclustr_prometheus_example' scheme: https basic_auth: username: <your_user_name> password: <your_monitoring_api_key> params: format: ['prometheus'] metrics: [<your_metrics_string>] metrics_path: /monitoring/v1/clusters/<cluster_id> static_configs: - targets: ['api.instaclustr.com'] |
The “<your_metrics_string>” placeholder should have all of the metrics that you would like to pull out, with each metric as a single string separated by a comma. There is a maximum of 20 metrics that you can export to Prometheus. The other tags should have your user name and Monitoring API key which are obtained from the previous parts of this guide.
In order to run Prometheus, head to the folder where Prometheus is installed, and run the command in the terminal:
1 | `./prometheus --config.file=prometheus.yml` |
You can view Prometheus by heading to: localhost:9090 by typing it into your URL bar. In order to view the graphs, you can head to localhost:9090/graph. From here you have your Instaclustr nodes connected, and you can now use Prometheus with the data and, if you wish, attach Grafana to Prometheus.
For more information on Prometheus, the documentation can be found here.
Using Grafana for Visualization
Grafana can be used for data visualization when used with the Instaclustr Monitoring API. Grafana cannot directly connect to the Instaclustr node; it must instead go through Prometheus after it has connected to an Instaclustr node. This effectively queries the data from Prometheus and brings it into Grafana.
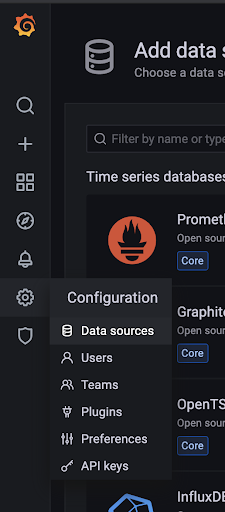
After downloading and setting up Grafana you can access it by typing localhost:300 into your URL bar. On the left, find and click Data Sources.
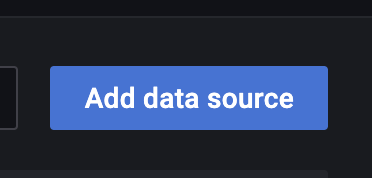
From here click on Add data source, and then select Prometheus.
Then enter the location of the Prometheus cluster. If it is installed locally, the default location is http://localhost:9090/. After it is saved, data should then be viewable in Grafana.
For more information on Grafana, documentation can be found here.
Conclusion
The process of setting up an Instaclustr node and setting up monitoring with external platforms is a straightforward process. The different open source frameworks we provide are extremely similar to set up, with the main difference being what you are able to monitor within them.
Additional Resources:
- Provisioning API Documentation: https://developer.instaclustr.com/?_ga=2.80450900.297976923.1625584410-1900875864.1623996233#tag/Provisioning-API
- Monitoring API Documentation:
- Grafana Documentation: https://grafana.com/docs/
- Grafana Download: https://grafana.com/grafana/download
- Grafana Setup: https://prometheus.io/docs/prometheus/latest/getting_started/
- Prometheus Documentation: https://prometheus.io/docs/introduction/overview/
- Prometheus Download: https://prometheus.io/download/
- Prometheus Setup: https://prometheus.io/docs/prometheus/latest/getting_started/
- Instaclustr Terraform Provider Github: https://github.com/instaclustr/terraform-provider-instaclustr