


Instaclustr Monitoring API provides integration with Prometheus for Apache Cassandra and Kafka metrics
We are pleased to announce support for the seamless integration of monitoring data from the Instaclustr Managed Platform to the Prometheus monitoring system.
The Instaclustr Managed Platform collects and monitors thousands of metrics from your data-layer clusters like Apache Kafka and Apache Cassandra. The spread of metrics ranges from the generic infrastructure and operating system metrics like CPU, disk, memory and network usage to technology-specific, advanced and in-depth cluster performance and load metrics.
There are hundreds of metrics exposed by Cassandra and Kafka from which we have curated a list of metrics that are considered most important for application owners. These metrics are made available on the monitoring page of the Instaclustr console.
In addition to viewing metrics through the Instaclustr console, many of our customers wish to have a single monitoring system to simultaneously view their application metrics alongside the metrics from their Instaclustr-managed cluster. To support this, Instaclustr provides a set of monitoring APIs which can be used to integrate Instaclustr metrics with third-party monitoring systems.
Prometheus is an open-source monitoring solution that is very popular and widely deployed by our customer base. Up until this release, the only way to integrate metrics from the Instaclustr Managed Platform with Prometheus was to use a third-party open source Instaclustr metrics exporter that collected metrics from the Instaclustr Managed Platform and converted them into a Prometheus-compatible format. While you can continue to use that mechanism, there is now an easy and convenient way to achieve this natively by configuring Prometheus to scrape metrics directly from the Instaclustr monitoring APIs.
We have introduced a new input “format” parameter in our monitoring APIs that accepts “Prometheus” as a value which tells the monitoring component of the Instaclustr platform to return the metrics data in a format that is compatible with Prometheus. To consume this from Prometheus, you simply have to update the prometheus.yml file on the machine running your Prometheus instance with a few configuration values. You can find out more information about how to configure and build this integration with Prometheus using our support documentation here – Using Instaclustr Monitoring API with Prometheus.
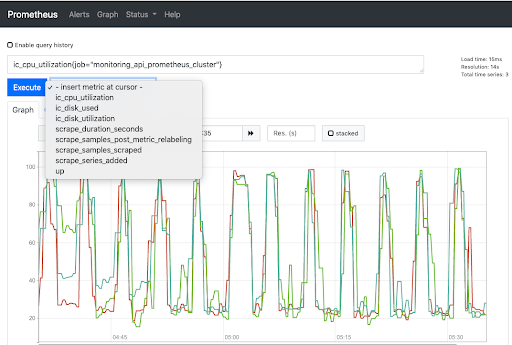
Once Prometheus is configured to pull metrics from your Instaclustr managed clusters, you can visualize and analyze those metrics on the Prometheus user interface or a tool that works with Prometheus, such as Grafana. You can also set up alerts on specific conditions as supported by Prometheus. It should be noted that Instaclustr’s monitoring system is already providing alerting to our technical operations teams on a wide range of proven health indicators and will respond, triage, fix and inform you as required.
At Instaclustr, we strive hard to deliver reliable and high-performance data-layer services supported by our capable operations team of technology experts. At the same time, we are continually working to improve the dev-ops experience through the Instaclustr console and via our APIs including any integrations our customers need. If you have questions on the Prometheus integration or related to another integration, you can reach out to our support team or shoot an email to [email protected].