


Overview
Instaclustr has just released a substantial upgraded monitoring capability as part of our management console application. This monitoring capability has been designed to provide you easy access to the information you need to manage your use of Apache Cassandra when Instaclustr is taking care of the gory details for you.
This blog post provides a walkthrough of our new monitoring capability and explains the scenarios when the particular monitoring functions should be used to help understand the performance of Cassandra with your application.
Go straight to our Console and signup to take a free trial test run, no credit card required.
Screens
Instaclustr monitoring is provided through three basic screens:
- Cluster Summary: provides a summary view of key metrics to understand the health of your cluster at a glance
- Metrics Lists: provides a tabular view of key metrics which is great for understanding relatively static information (for example, tombstones per read over the last 5 minutes)
- Metrics Graphs: provides a graphical view of metric values over time – ideal for pinpointing the time when there was a sudden change in a metric value or identifying trends over time
Cluster Summary View
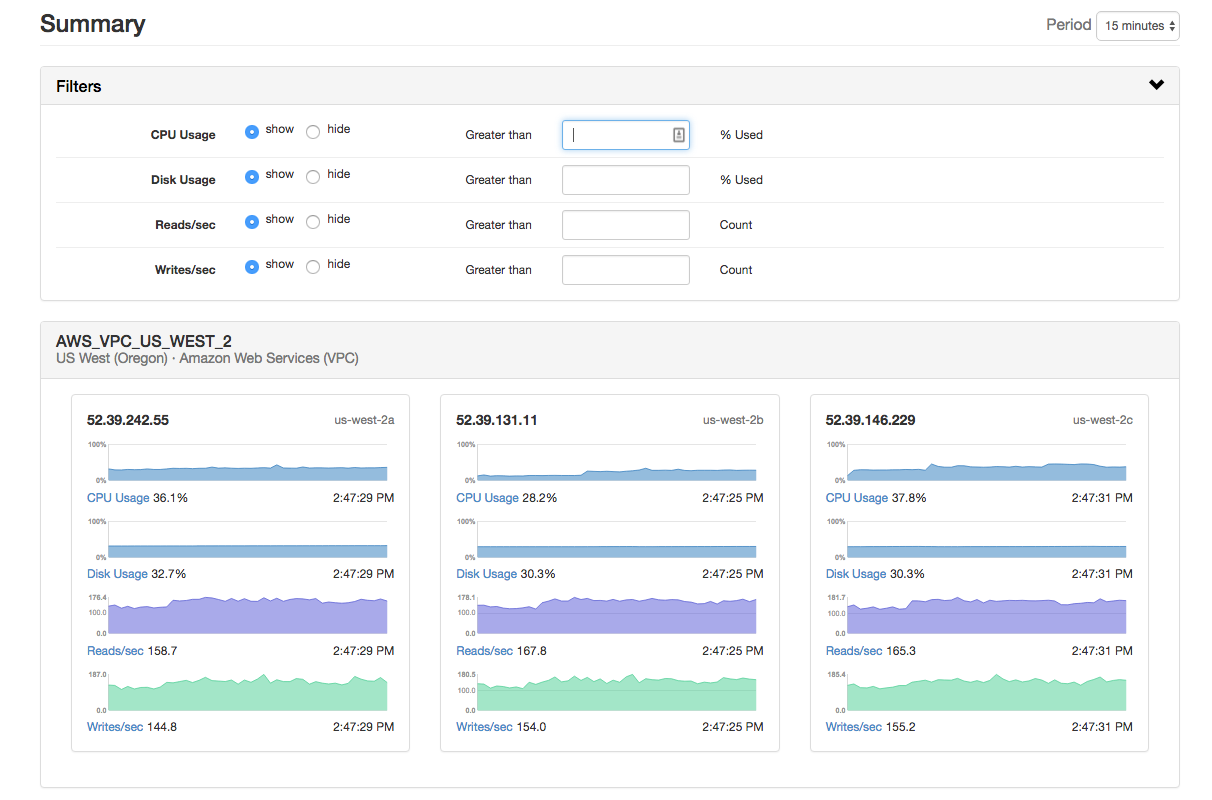
The cluster summary view shows you a set of graphs for each node in the cluster, with 4 key metrics shown for each node:
- CPU Usage: sustained high CPU usage is one indicator that your cluster is reaching processing capacity and you may need to consider adding capacity to cope with any increase in load
- Disk Usage: we recommend maintaining disk usage at less than 70% during normal operations and require disk usage to be kept at less than 80% to maintain SLAs. While Instaclustr Support will advise you when you exceed disk space recommendations, keeping an eye on disk usage should be a key part of your capacity planning.
- Reads + Writes per Second: enables you to identify changing levels of load on your cluster. In particular, look out for significantly uneven distribution which could indicate misconfiguration of the driver or data model issues.
The cluster summary page has a set of filters which are useful for large clusters. For example, enter “80” in the CPU usage filter and only those nodes with CPU usage greater than 80% at some point in the selected period will be displayed.
Metrics List View
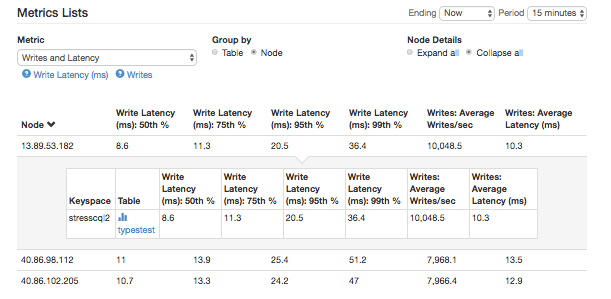
The metrics list view provides summary tables of statistics to allow you to see the latest reported value of a range of metrics or the values aggregated over a selected period (15 minutes to 30 days). The metrics sets available are:
- Per Table Information (can drill down to per node as well):
- Reads and Latency: rate of local reads and distribution of local request latency – great for diagnosing whether read issues are impacting all tables (capacity or infrastructure issue) or a single table (data issue)
- Writes and Latency: rate of local writes and distribution of local request latency
- Table Info: tombstones returned, live cells returned and sstables scanned per read and data size – table demographics info to help you diagnose the cause of table specific issues
- Per Node Information:
- CPU Usage: CPU used
- Disk Usage: Disk used
- Client Reads and Latency: rate of the client read request and total operation latency (from the coordinator node)
- Client Writes and Latency: rate of client write request and total operation latency (from the coordinator node)
- Background Tasks: pending compactions operations and pending and in-progress repairs. Compactions are a continuous, background process in Cassandra – a high or increasing number of pending compactions indicate that your cluster does not have sufficient capacity to process the level of operations it is processed. Repairs are scheduled operations and represent an additional load on the cluster.
Clicking on the ‘?’ icon will take you to a help page for the selected metrics set that explains the metrics, how to interpret them, and any actions to take based on the metric information.
Metrics Graphs View
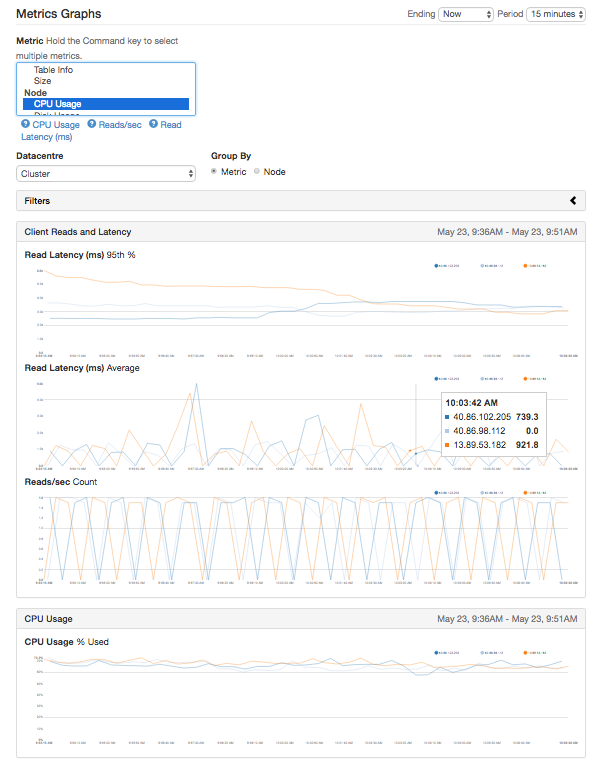
The metrics graphs view provides the ability to display time-series graphs of the same information as available in the metrics list view. You can use the time selectors to select the period that you want to graph and use filters so that the graphs will only display outlier values. A couple of handy features that you might miss at first glance:
- you can control/command click on the metrics list to display multiple metrics sets at once;
- Click on a node’s IP in the legend to display/hide the line for that node;
- double-click on a node’s IP in the legend to display only that nodel; and
- use the filters to only display nodes exceeding a certain metric value.
Looking Ahead
After a lot of hard work, we think Instaclustr managed Apache Cassandra and Apache Spark based monitoring architecture now has a UI that is a tailor-made fit for what our customers actually need and will allow most of our users to use it as their primary monitoring tool. We expect we’ll add a few more metrics over time but our aim is not to overwhelm our users with every possible metric but rather to provide the curated set of metrics that are most useful when running a Cassandra-based application when Instaclustr is taking care of the gory infrastructure details. If you need to dig further, our tech-ops team ([email protected]) is here to work with you to understand more in-depth issues.
Got a feature request for Instaclustr monitoring? Drop me an email: [email protected].