Cadence History Metrics
These metrics are specific to the History service.
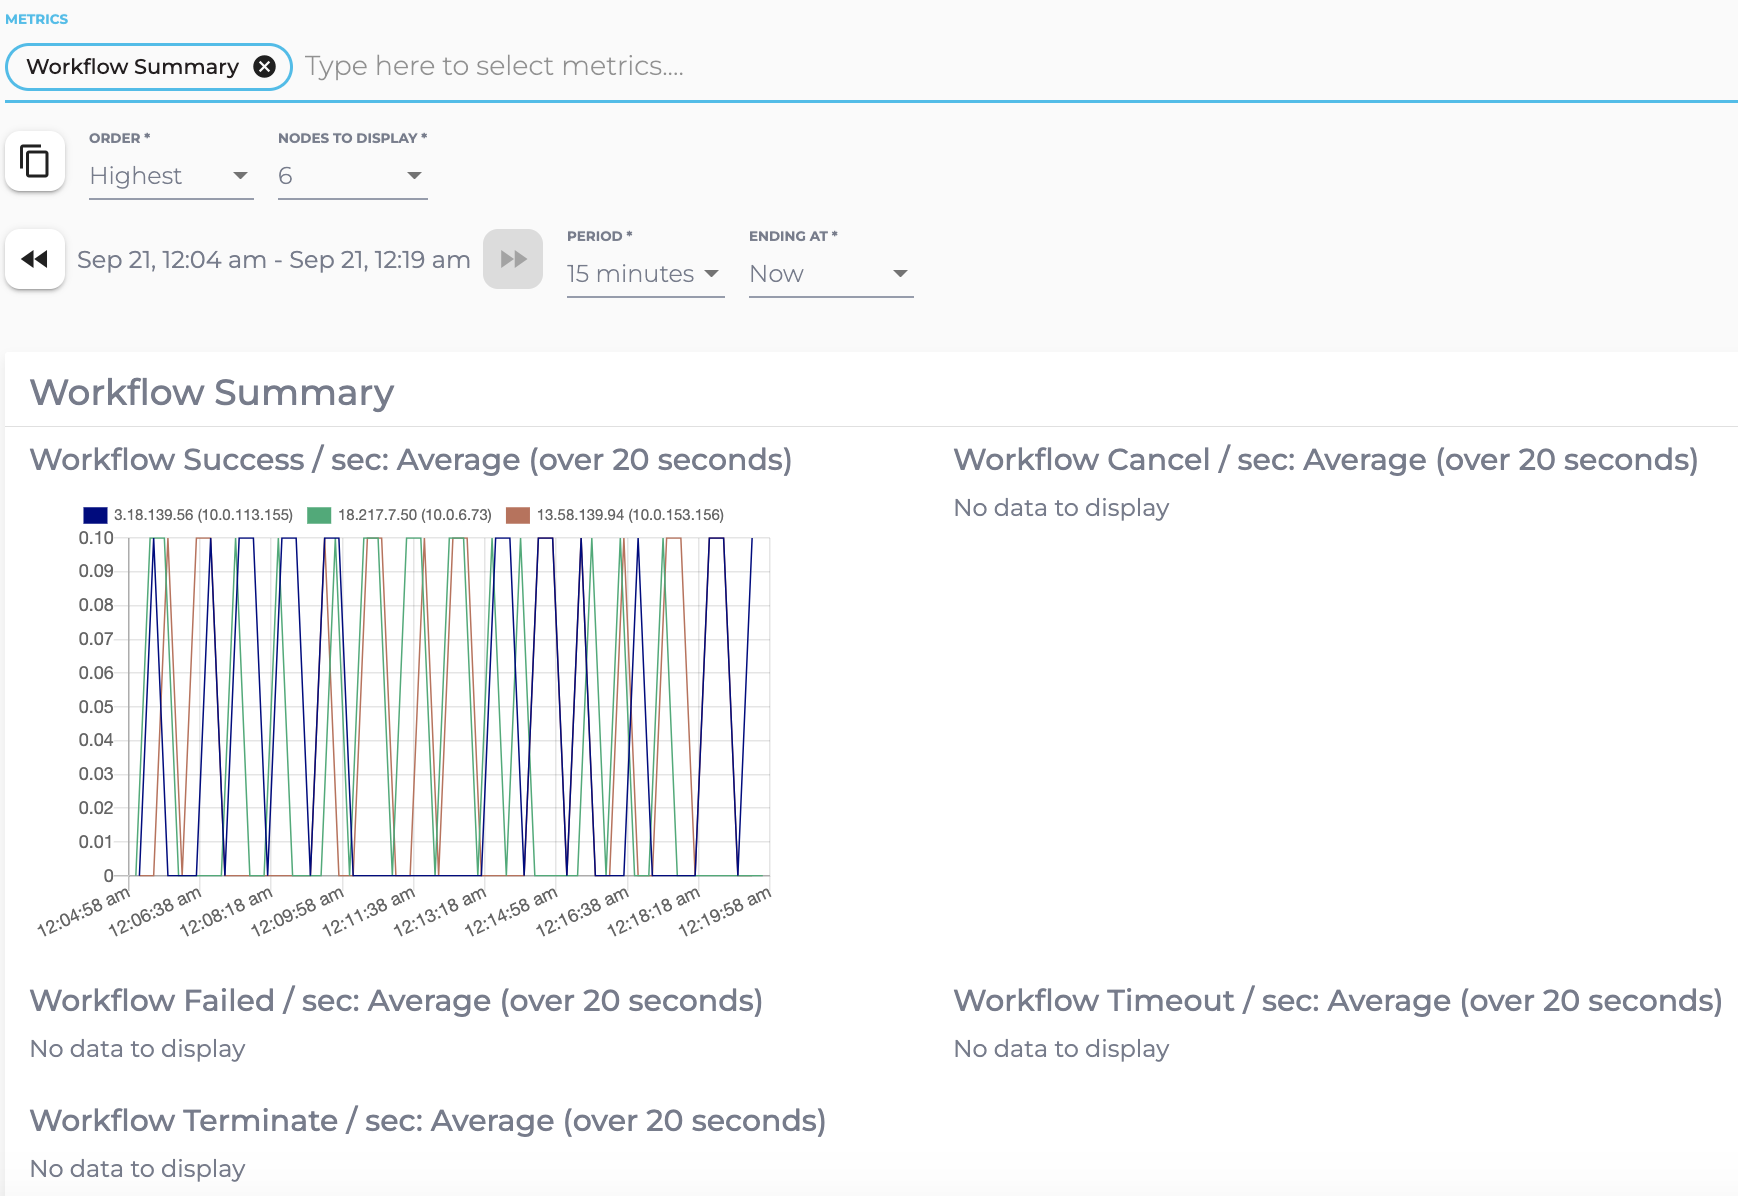
Workflow Summary
These 5 metrics represent the final state of workflows, i.e. whether they succeeded or failed or cancelled or timed out or terminated. Each metric is represented as an average rate of the corresponding final workflow state. For example, Workflow Success / sec represents the average number of workflows successfully completed per second over the last 20 seconds period. Similar definitions apply for the other 4 workflow (final) states.
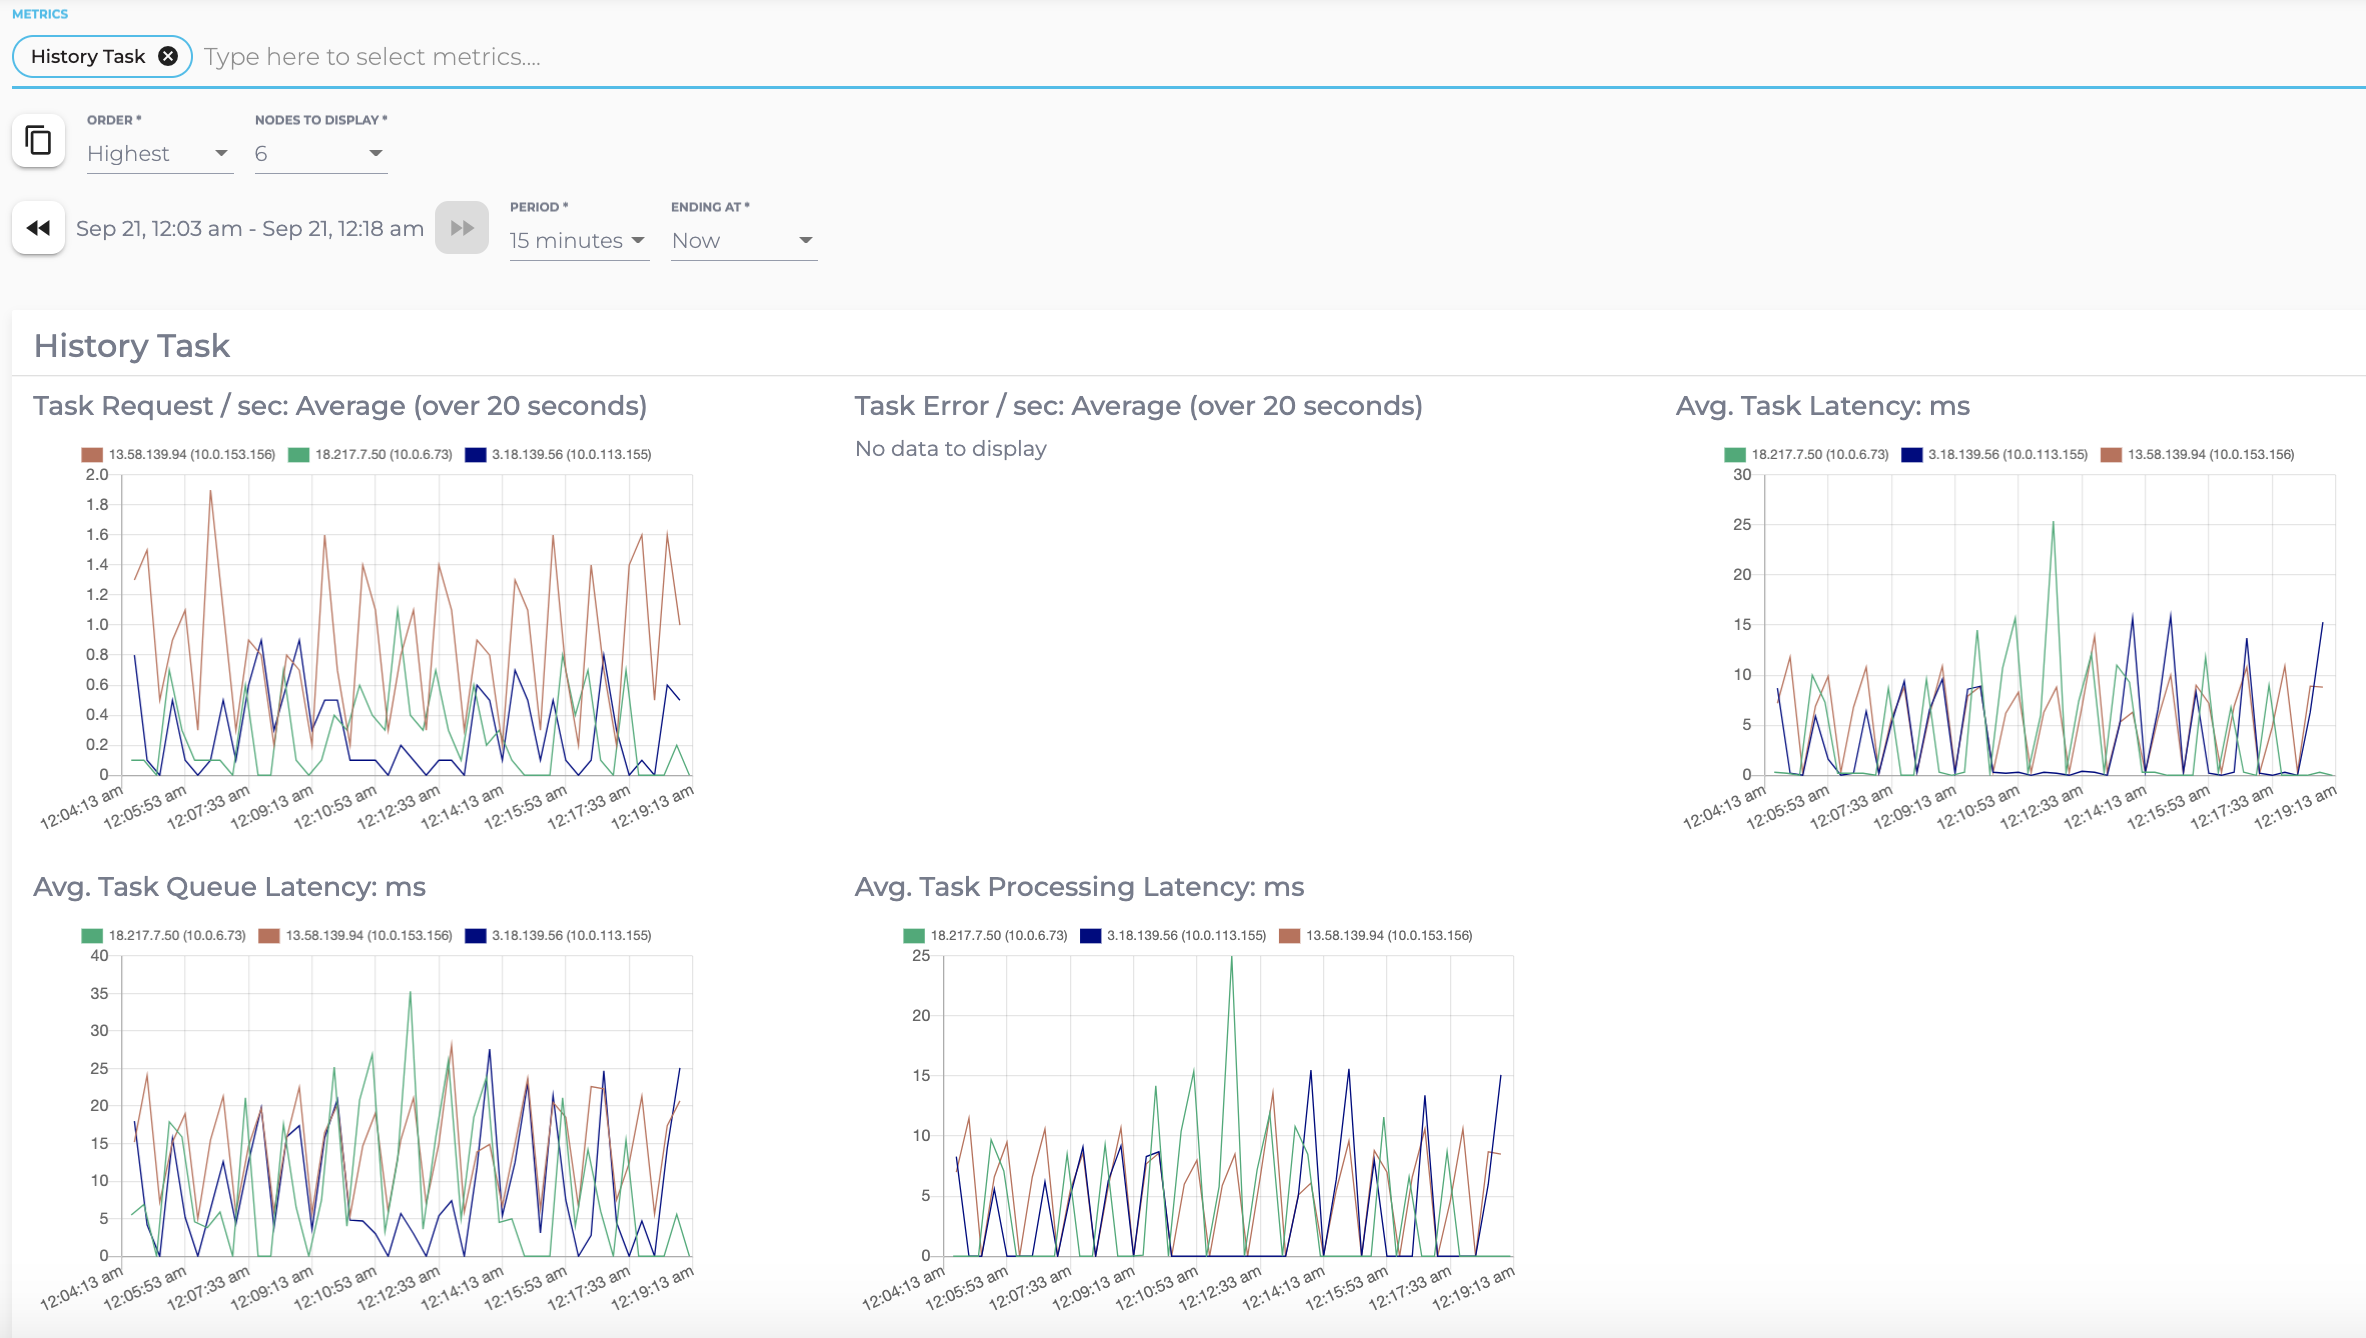
History Task
The Task metrics are related to both Transfer Tasks and Timer Tasks.
- Transfer Task: is an internal background task that moves workflow state and transfers an action task from the history engine to another service(e.g. Matching service).
- Timer tasks: are tasks that are scheduled to be triggered at a given time in future. For example, workflow.sleep() will wait an x amount of time then the task will be pushed somewhere for a worker to pick up.
The Task Request graph represents the average number of transfer and timer task requests generated per second. Similar definition applies for the Task Error graph.
The 3 Task Latency graphs (in milliseconds) indicate the 3 types of latencies experienced by both transfer and timer tasks.
- Task Latency: It is the time from submission to executing pool to completion. It includes scheduling, retry and processing time of the task.
- Task Queue Latency: This is “end to end” latency for users. The latency could go to several minutes during deployment because of metrics being re-emitted (but the actual latency is not that high).
- Task Processing Latency: It is the processing time of the task of a single attempt (without retry).