End-to-end distributed tracing of complex applications is a critical pillar of modern distributed systems observability development and operations. Previously, I’ve used OpenTelemetry to trace a complex Kafka application, including Kafka Streams, and looked at the traces in several open source OpenTelemetry GUIs, including Jaeger, Uptrace, and SigNoz. And earlier, I used its predecessor, OpenTracing, to trace Anomalia Machina.
In part 1 of this blog, I explored option 1 using Jaeger. That approach was relatively easy to do, but it didn’t give the full functionality of the OpenSearch Trace Analytics visualizations. Now it’s time to investigate option 2 using a Data Prepper pipeline and see if we can unlock the full functionality.
OpenTelemetry Java Auto instrumentation recap
In part 1, we ran some Kafka clients with Java OpenTelemetry auto-instrumentation enabled. To recap, on the Kafka client side, this is what you have to run to automatically produce traces from a Java program:
|
1 2 3 |
java -javaagent:opentelemetry-javaagent.jar -Dotel.traces.exporter=otlp -Dotel.resource.attributes=service.name=test_producer -Dotel.metrics.exporter=none -jar producer.jar |
The documentation and opentelemetry-javaagent.jar are available here.
For a more interesting use case and topology, I ran a producer (service.name=lotsofboxes) writing to a topic, and two consumers in different groups (service.name=consumerg1, service.name=consumerg2) reading from the topic.
Option 2: A complete and robust pipeline using OpenTelemetry Collectors and OpenSearch Data Prepper
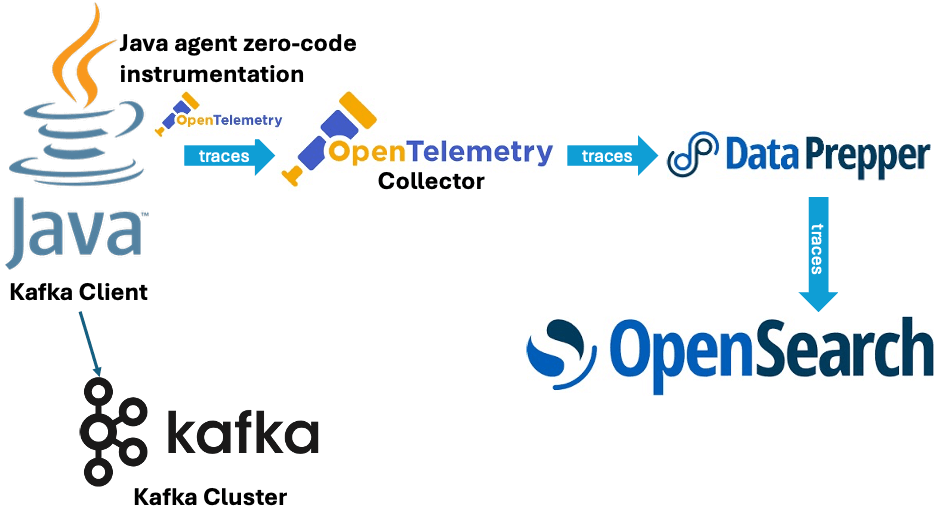
In practice, the preferred way of getting OpenTelemetry traces into OpenSearch is as follows:
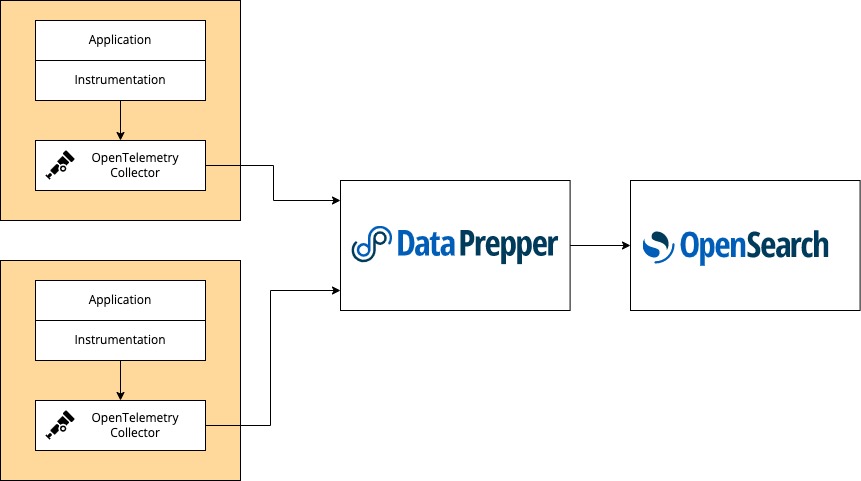
It looks like I need two extra components/steps: OpenTelemetry Collectors on the application side, and OpenSearch Data Prepper between the Collectors and OpenSearch to collect the traces from the Collectors, process them, and insert the data correctly in OpenSearch to enable visualizations.
Why is Data Prepper essential for this workflow? From this diagram, it looks like three internal pipelines are needed to process the traces correctly for use by OpenSearch:
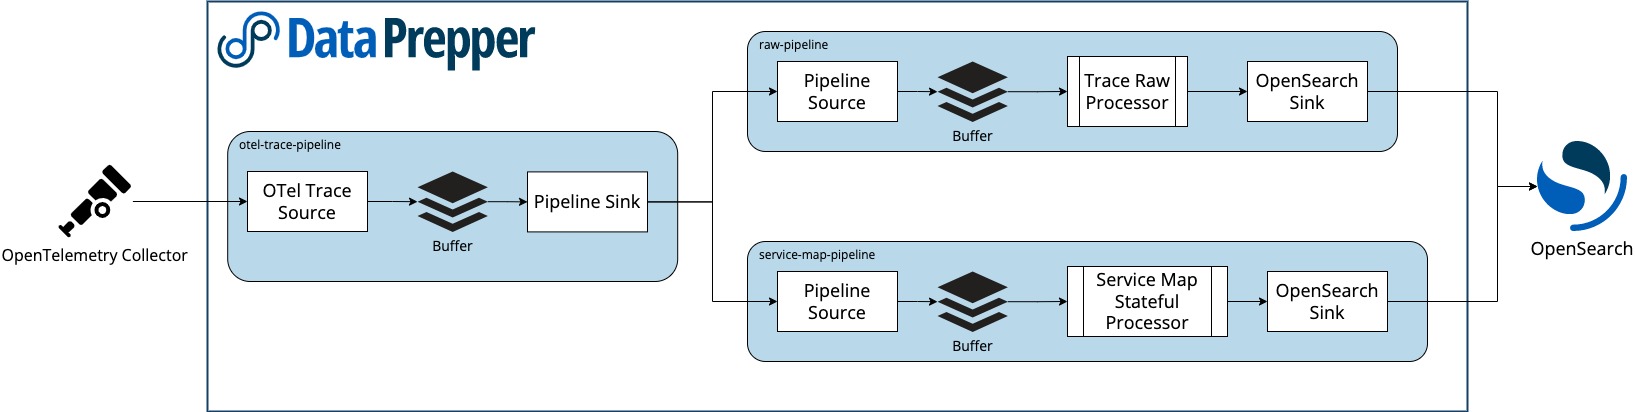
The documentation explains them as follows. There are three processors for the trace analytics feature:
otel_traces- The
otel_tracesprocessor receives a collection of span records fromotel-trace-source, and performs stateful processing, extraction, and completion of trace-group-related fields. - I assume this is part of the
otel-trace-pipeline.
- The
otel_traces_group- The
otel_traces_groupprocessor fills in the missingtrace-group-relatedfields in the collection of span records by looking up the OpenSearch backend. - I was getting an error about “missing trace groups” in option 1 above, so this is presumably the missing step.
- The
service_map- The
service_mapprocessor performs the required preprocessing for trace data and builds metadata to display theservice-mapdashboards. - I assume this is part of the
service-map-pipeline.
- The
I was puzzled about “trace groups” (as this is not an OpenTelemetry concept), but the documentation is sparse. AI suggested the following explanation:
In OpenSearch, when integrating with OpenTelemetry for distributed tracing, a trace group refers to a logical grouping of related traces or spans that share common characteristics or are associated with a particular service, operation, or application. It provides a way to organize and filter your trace data for easier analysis and visualization.
And groups are apparently customizable:
Trace groups can be defined based on various common characteristics, such as:
- Service Name: All traces originating from or passing through a specific service can belong to a particular trace group (this appears to be the default).
- Operation Name: Traces related to a specific operation within a service (e.g., “checkout,” “login”) can form a trace group.
- Application: Traces from a particular application can be grouped together.
- Custom Attributes: You can leverage custom attributes added to your OpenTelemetry spans to create highly specific trace groups based on business logic or other relevant metadata.
OpenSearch provides a generic sink that writes data to OpenSearch as the destination. The OpenSearch sink has configuration options related to the OpenSearch cluster, such as endpoint, SSL, username/password, index name, index template, and index state management.
The sink provides specific configurations for the trace analytics feature. These configurations allow the sink to use indexes and index templates specific to trace analytics. The following OpenSearch indexes are specific to trace analytics:
otel-v1-apm-span- The
otel-v1-apm-spanindex stores the output from theotel_tracesprocessor.
- The
otel-v1-apm-service-map- The
otel-v1-apm-service-mapindex stores the output from theservice_mapprocessor.
- The
So, a lot is going on in these pipelines, which explains why the service maps were not working using just Jaeger in option 1.
Get, configure, and run Data Prepper
According to the documentation, Data Prepper is:
- A server-side data collector and processor
- And is vertically and horizontally scalable and can be clustered for redundancy.
In practice, this probably means you would be running it on substantial servers and/or in the cloud. However, I just wanted to test the pipeline, so I ran it locally on my Mac. The getting started guide is here, and I got a local copy with this command:
|
1 |
docker pull opensearchproject/data-prepper:latest |
Given the number of pipelines needed, and to run it with our managed OpenSearch, you need to write a specific configuration file; here’s an example.
Here’s my configuration file (opensearch_otel_config.yaml):
|
1 2 3 4 5 6 7 8 9 10 11 12 13 14 15 16 17 18 19 20 21 22 23 24 25 26 27 28 29 30 31 32 33 34 35 36 37 38 39 40 41 42 43 44 45 46 47 48 49 |
entry-pipeline: delay: "100" source: otel_trace_source: ssl: false buffer: bounded_blocking: buffer_size: 10240 batch_size: 160 sink: - pipeline: name: "raw-trace-pipeline" - pipeline: name: "service-map-pipeline" raw-trace-pipeline: source: pipeline: name: "entry-pipeline" buffer: bounded_blocking: buffer_size: 10240 batch_size: 160 processor: - otel_traces: sink: - opensearch: hosts: ["https://ip:9200"] insecure: true username: user password: password index_type: trace-analytics-raw service-map-pipeline: delay: "100" source: pipeline: name: "entry-pipeline" buffer: bounded_blocking: buffer_size: 10240 batch_size: 160 processor: - service_map: sink: - opensearch: hosts: ["https://ip:9200"] insecure: true username: user password: password index_type: trace-analytics-service-map |
This pipeline takes data from the OpenTelemetry Collector (entry-pipeline) and uses two other pipelines as sinks. These two separate pipelines serve two different purposes and write to different OpenSearch indexes. The first pipeline (raw-trace-pipeline) prepares trace data for OpenSearch and enriches and ingests the span documents into a span index within OpenSearch. The second pipeline (service-map-pipeline) aggregates traces into a service map and writes service map documents into a service map index within OpenSearch.
Note that because there are 2 sinks, you need to provide the OpenSearch cluster host IP address and user/password twice (bolded)! Note that I changed the default sink configurations for insecure from false to true, as I was just testing. In production, you will likely set this back to false (The Data Prepper configuration documentation has more details).
You run Data Prepper like this (note the mapping of port 21890):
|
1 2 3 4 |
docker run --name data-prepper \ -p 21890:21890 -v ${PWD}/opensearch_otel_config.yaml:/usr/share/data- prepper/pipelines/opensearch_otel_config.yaml \ opensearchproject/data-prepper:latest |
Note that on a Mac (with Apple Silicon) you will get the following warning, but it still works ok:
|
1 2 3 |
WARNING: The requested image's platform (linux/amd64) does not match the detected host platform (linux/arm64/v8) and no specific platform was requested |
If everything is configured correctly then you will get the following message when starting Data Prepper:
|
1 2 |
org.opensearch.dataprepper.plugins.source.oteltrace.OTelTraceSource - Started otel_trace_source on port 21890 |
Get, configure and run the OpenTelemetry Collector
The final piece of the puzzle is the OpenTelemety Collector. To understand why the Collector is important, we need to backtrack a bit and have a look at the OpenTelemetry architecture. Here’s the high-level diagram, which clearly shows the central role of the Collector:
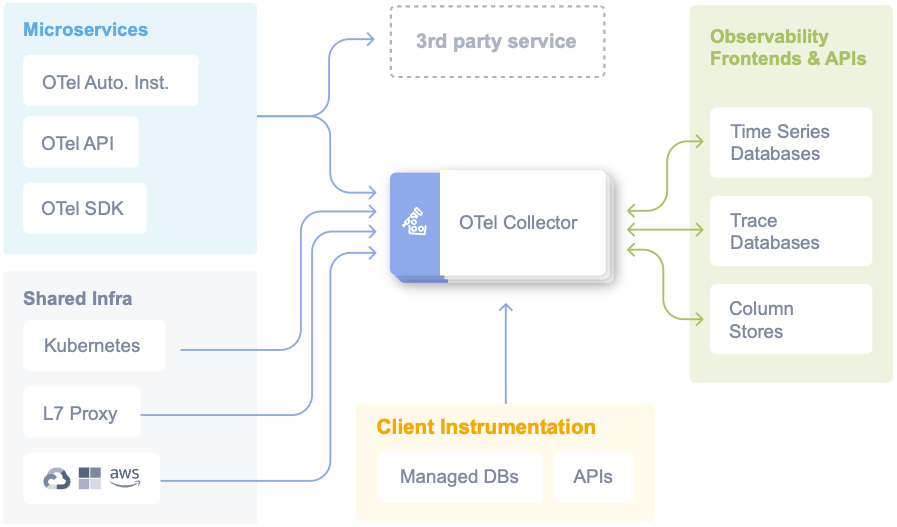
Source: https://opentelemetry.io/docs/
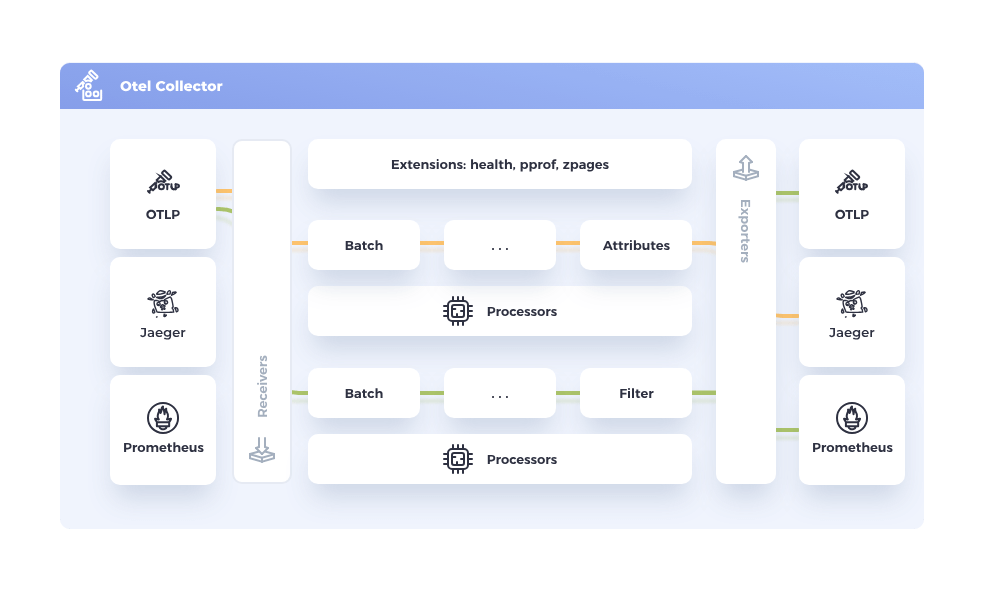
The Collector functions like a spider in a web and is documented further here. The Collector offer a vendor-agnostic implementation of how to receive, process and export telemetry data. It removes the need to run, operate, and maintain multiple agents/collectors. This works with improved scalability and supports open source observability data formats (e.g. Jaeger, Prometheus, etc.), sending to one or more backends (also called frontends in the above diagram). Collectors are complex and support multiple components, including Receivers, Processors and Exporters, as shown in this diagram:
I installed a Mac version of the Collector and used these installation instructions.
Next, you need to configure it to send data to Data Prepper according to these instructions (you also need to add otlp: protocols: http). Here’s my configuration file (otel-collector-config.yaml):
|
1 2 3 4 5 6 7 8 9 10 11 12 13 14 15 16 17 18 19 20 21 22 23 24 25 26 27 |
receivers: jaeger: protocols: grpc: otlp: protocols: grpc: http: zipkin: processors: batch/traces: timeout: 1s send_batch_size: 50 exporters: otlp/data-prepper: endpoint: localhost:21890 tls: insecure: true service: pipelines: traces: receivers: [jaeger, otlp, zipkin] processors: [batch/traces] exporters: [otlp/data-prepper] |
And run it like this:
|
1 |
./otelcol --config=otel-collector-config.yaml |
If you get an error about the port being in use, then it’s likely that you already have another Collector running. I did – by accident! It turns out that the version of Jaeger I was using has a Collector built in – which was why it was working without an extra Collector and getting traces directly from the Java clients. Shutting down Jaeger (or running it on a different port) solves the problem and allows the new dedicated Collector to start running with Data Prepper as the sink.
If it’s working correctly, then you will see messages like these:
|
1 2 3 4 5 6 7 |
Starting GRPC server {"resource": {"service.instance.id": "…", "service.name": "otelcol", "service.version": "0.137.0"}, "otelcol.component.id": "otlp", "otelcol.component.kind": "receiver", "endpoint": "127.0.0.1:4317"} info otlpreceiver@v0.137.0/otlp.go:179 Starting HTTP server {"resource": {"service.instance.id": "…", "service.name": "otelcol", "service.version": "0.137.0"}, "otelcol.component.id": "otlp", "otelcol.component.kind": "receiver", "endpoint": "127.0.0.1:4318"} |
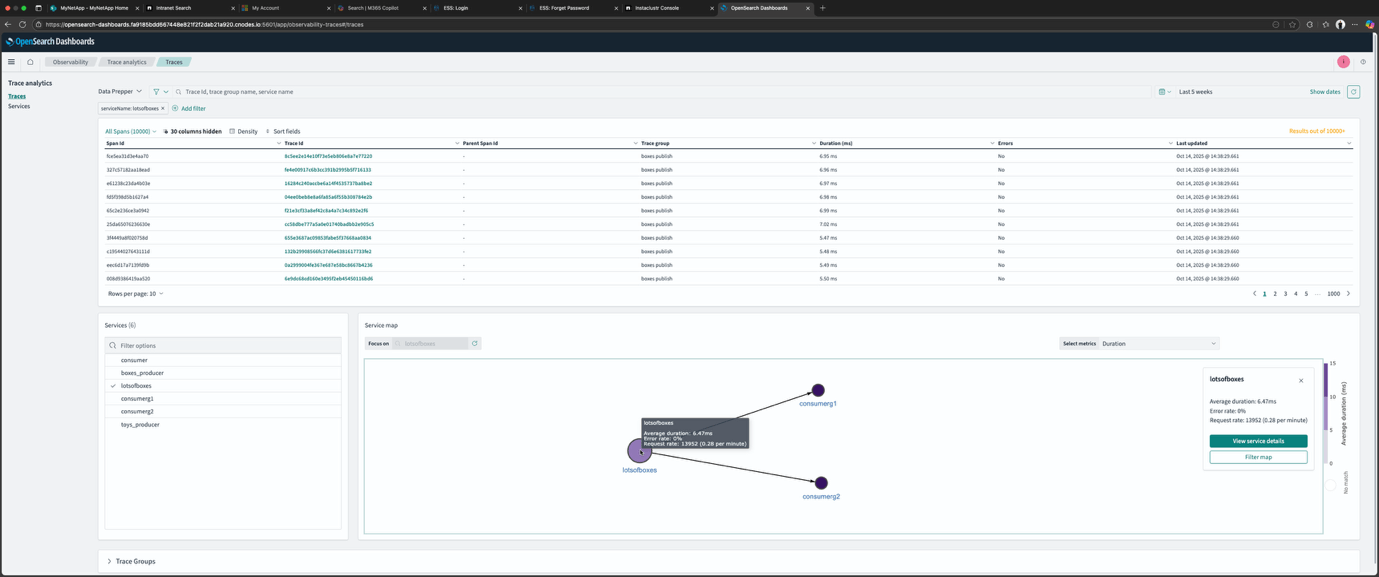
Finally, go to the OpenSearch Dashboard Trace page and select Data Prepper as the data source. And now the full functionality of the OpenSearch Dashboard Trace Analytics should be available, including the Service Map, which visualizes the dependencies and service topologies as shown in this screenshot:
Here’s a diagram of the final setup showing all the components and their relationships:
Note that the order of running this pipeline matters. You have to work backwards from the final component to the first in this order for everything to work correctly:
- OpenSearch
- Data Prepper
- OpenTelemetry Collector
- Kafka Clients
That’s it for part 2 of this exploration of how to get OpenTelemetry traces into OpenSearch. To summarize:
- Option 1 (part 1), using OpenSearch as a Jaeger database, works for an experiment with limited trace visualisation functionality.
- Option 2 is more effort, has more components (Data Prepper and OpenTelemetry Collectors), requires more configuration, but unlocks the full OpenSearch Trace Analytics visualisation functionality, and is more scalable and robust for a production deployment.
In a future article, we’ll explore how to use OpenSearch Observability and Trace Analytics with Apache Kafka in more detail, including what’s missing and what could be improved.