OpenSearch Dashboards offer powerful tools for exploring and making sense of your data. Among its robust features is the Discover Tool, an essential part of the OpenSearch Dashboard suite, designed to help you query, analyze and visualize data easily. Whether you’re a seasoned user or just starting out, this blog will empower you to make the most out of this tool.
By the end of this blog, you’ll learn how to:
- Set up the OpenSearch Discover Tool on an Instaclustr OpenSearch 3.0 cluster
- Search your data effectively with filters and queries
- Visualize your findings
- Share insights with your team quickly and securely
Getting started with the OpenSearch Discover Tool
The Discover Tool is intuitive and versatile, enabling users to search, sort, and analyze data rapidly. For this walkthrough, we’ll use a sample dataset using Instaclustr for OpenSearch 3.0. However you can use any OpenSearch 3.x cluster to replicate these steps.
You can even use the OpenSearch Dashboards playground if you’d prefer not to spin up a cluster.
Setting up sample data
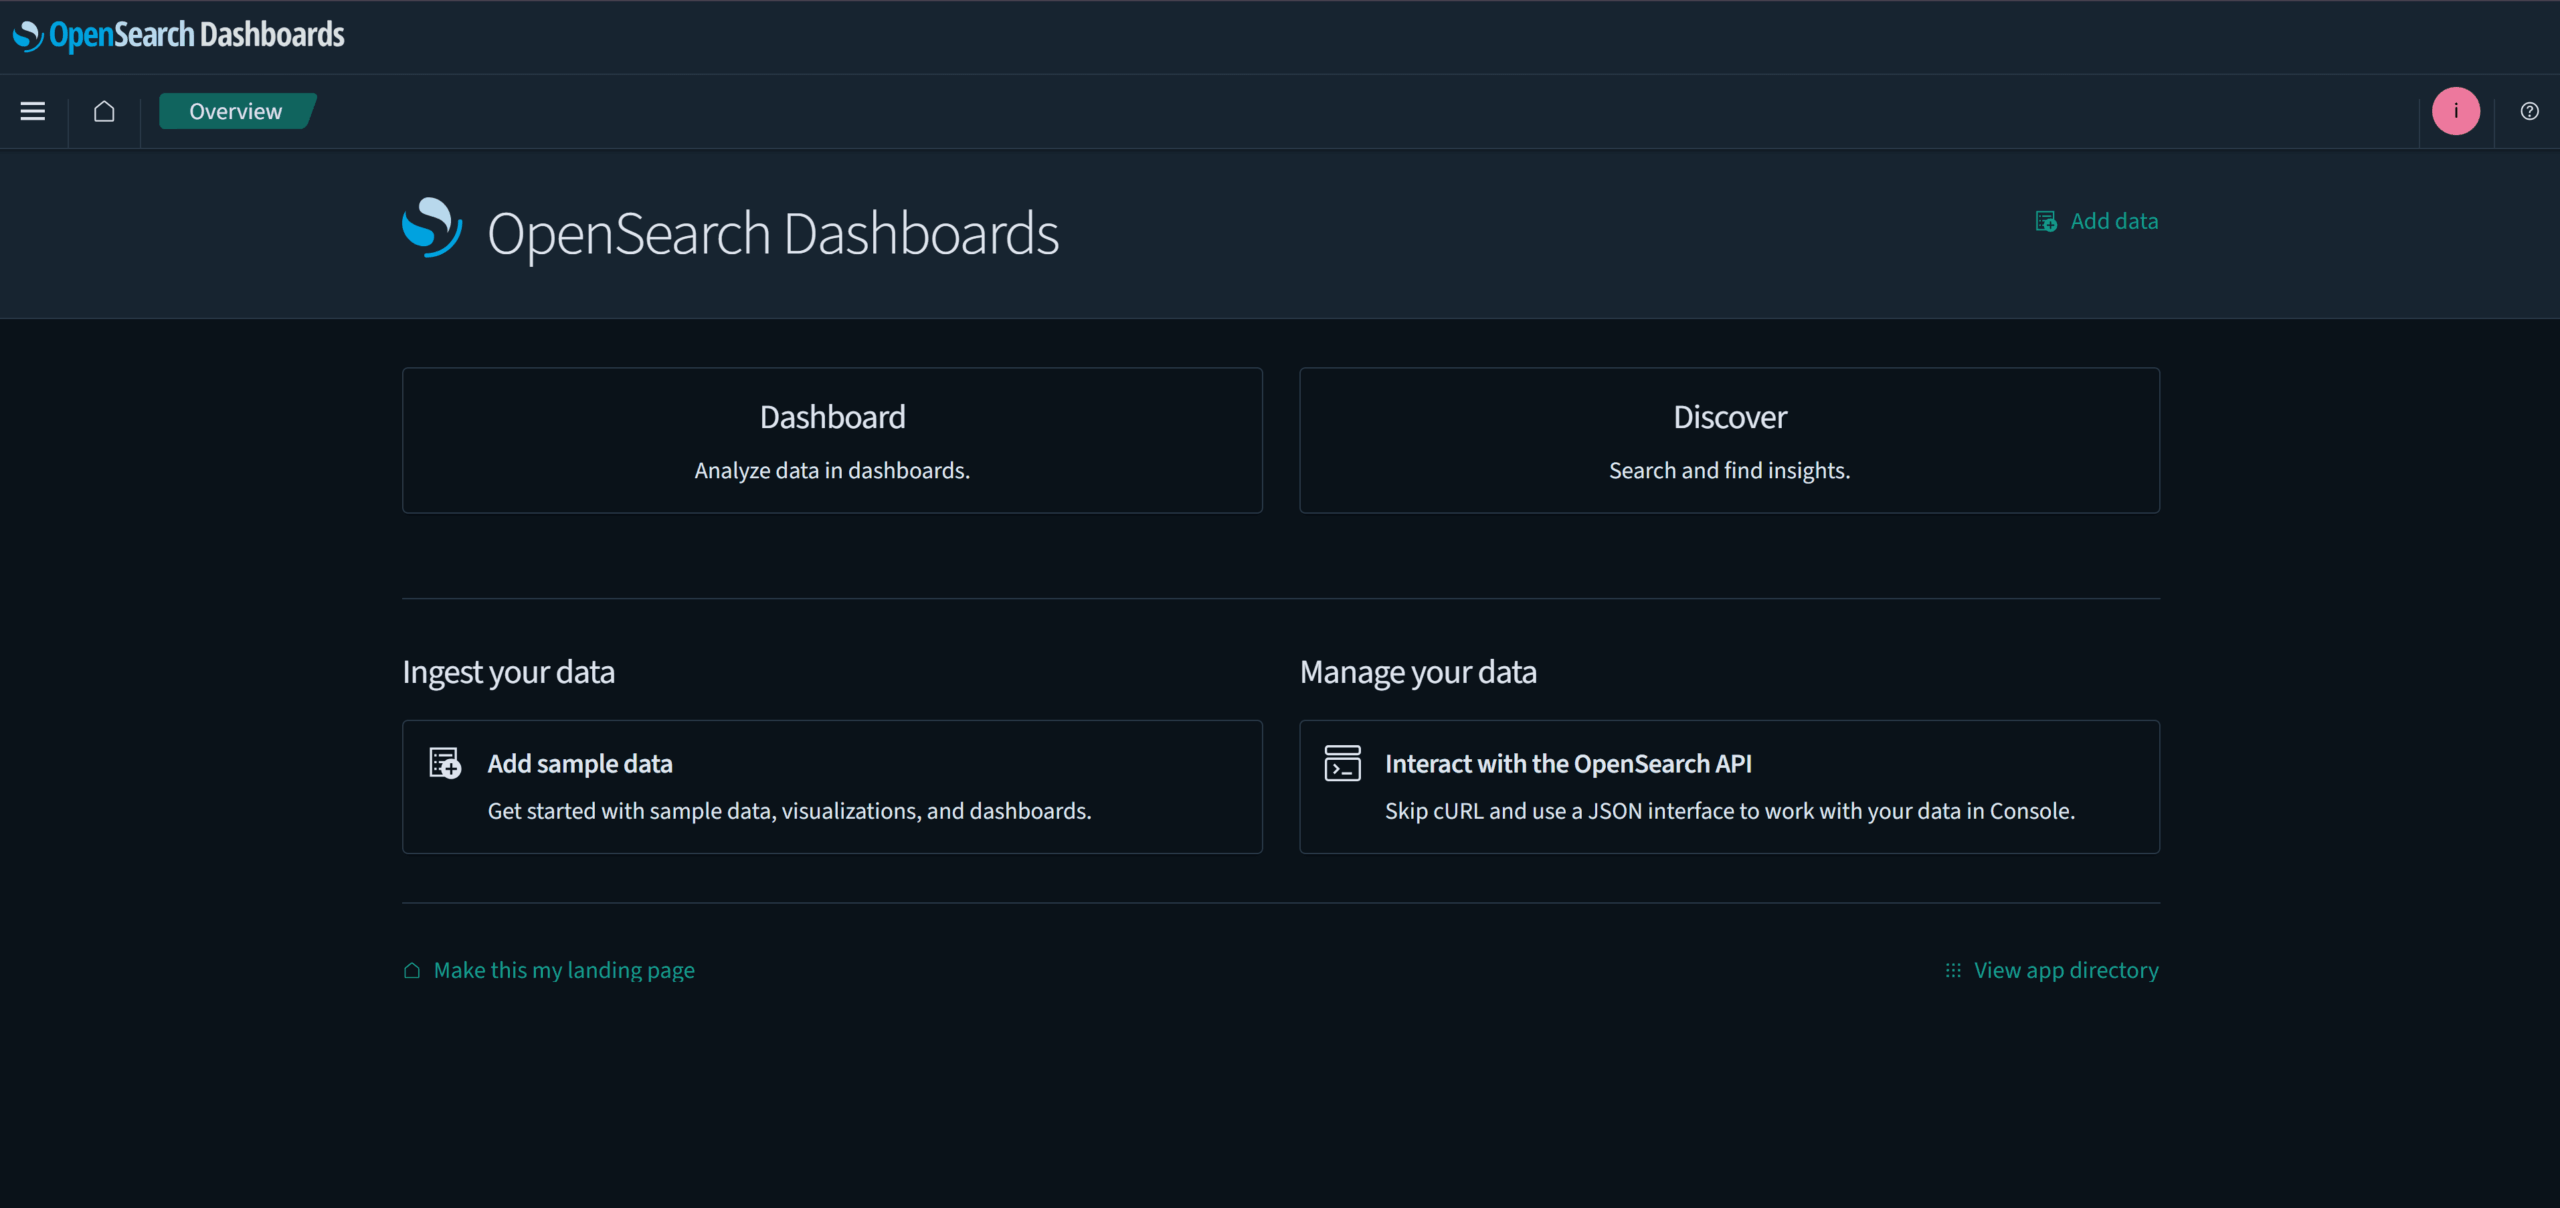
To begin you need a running OpenSearch 3.0 cluster. Once you have your cluster running, populate the e-commerce sample data set: from the Dashboards landing page, select Add sample data at the left near the bottom:
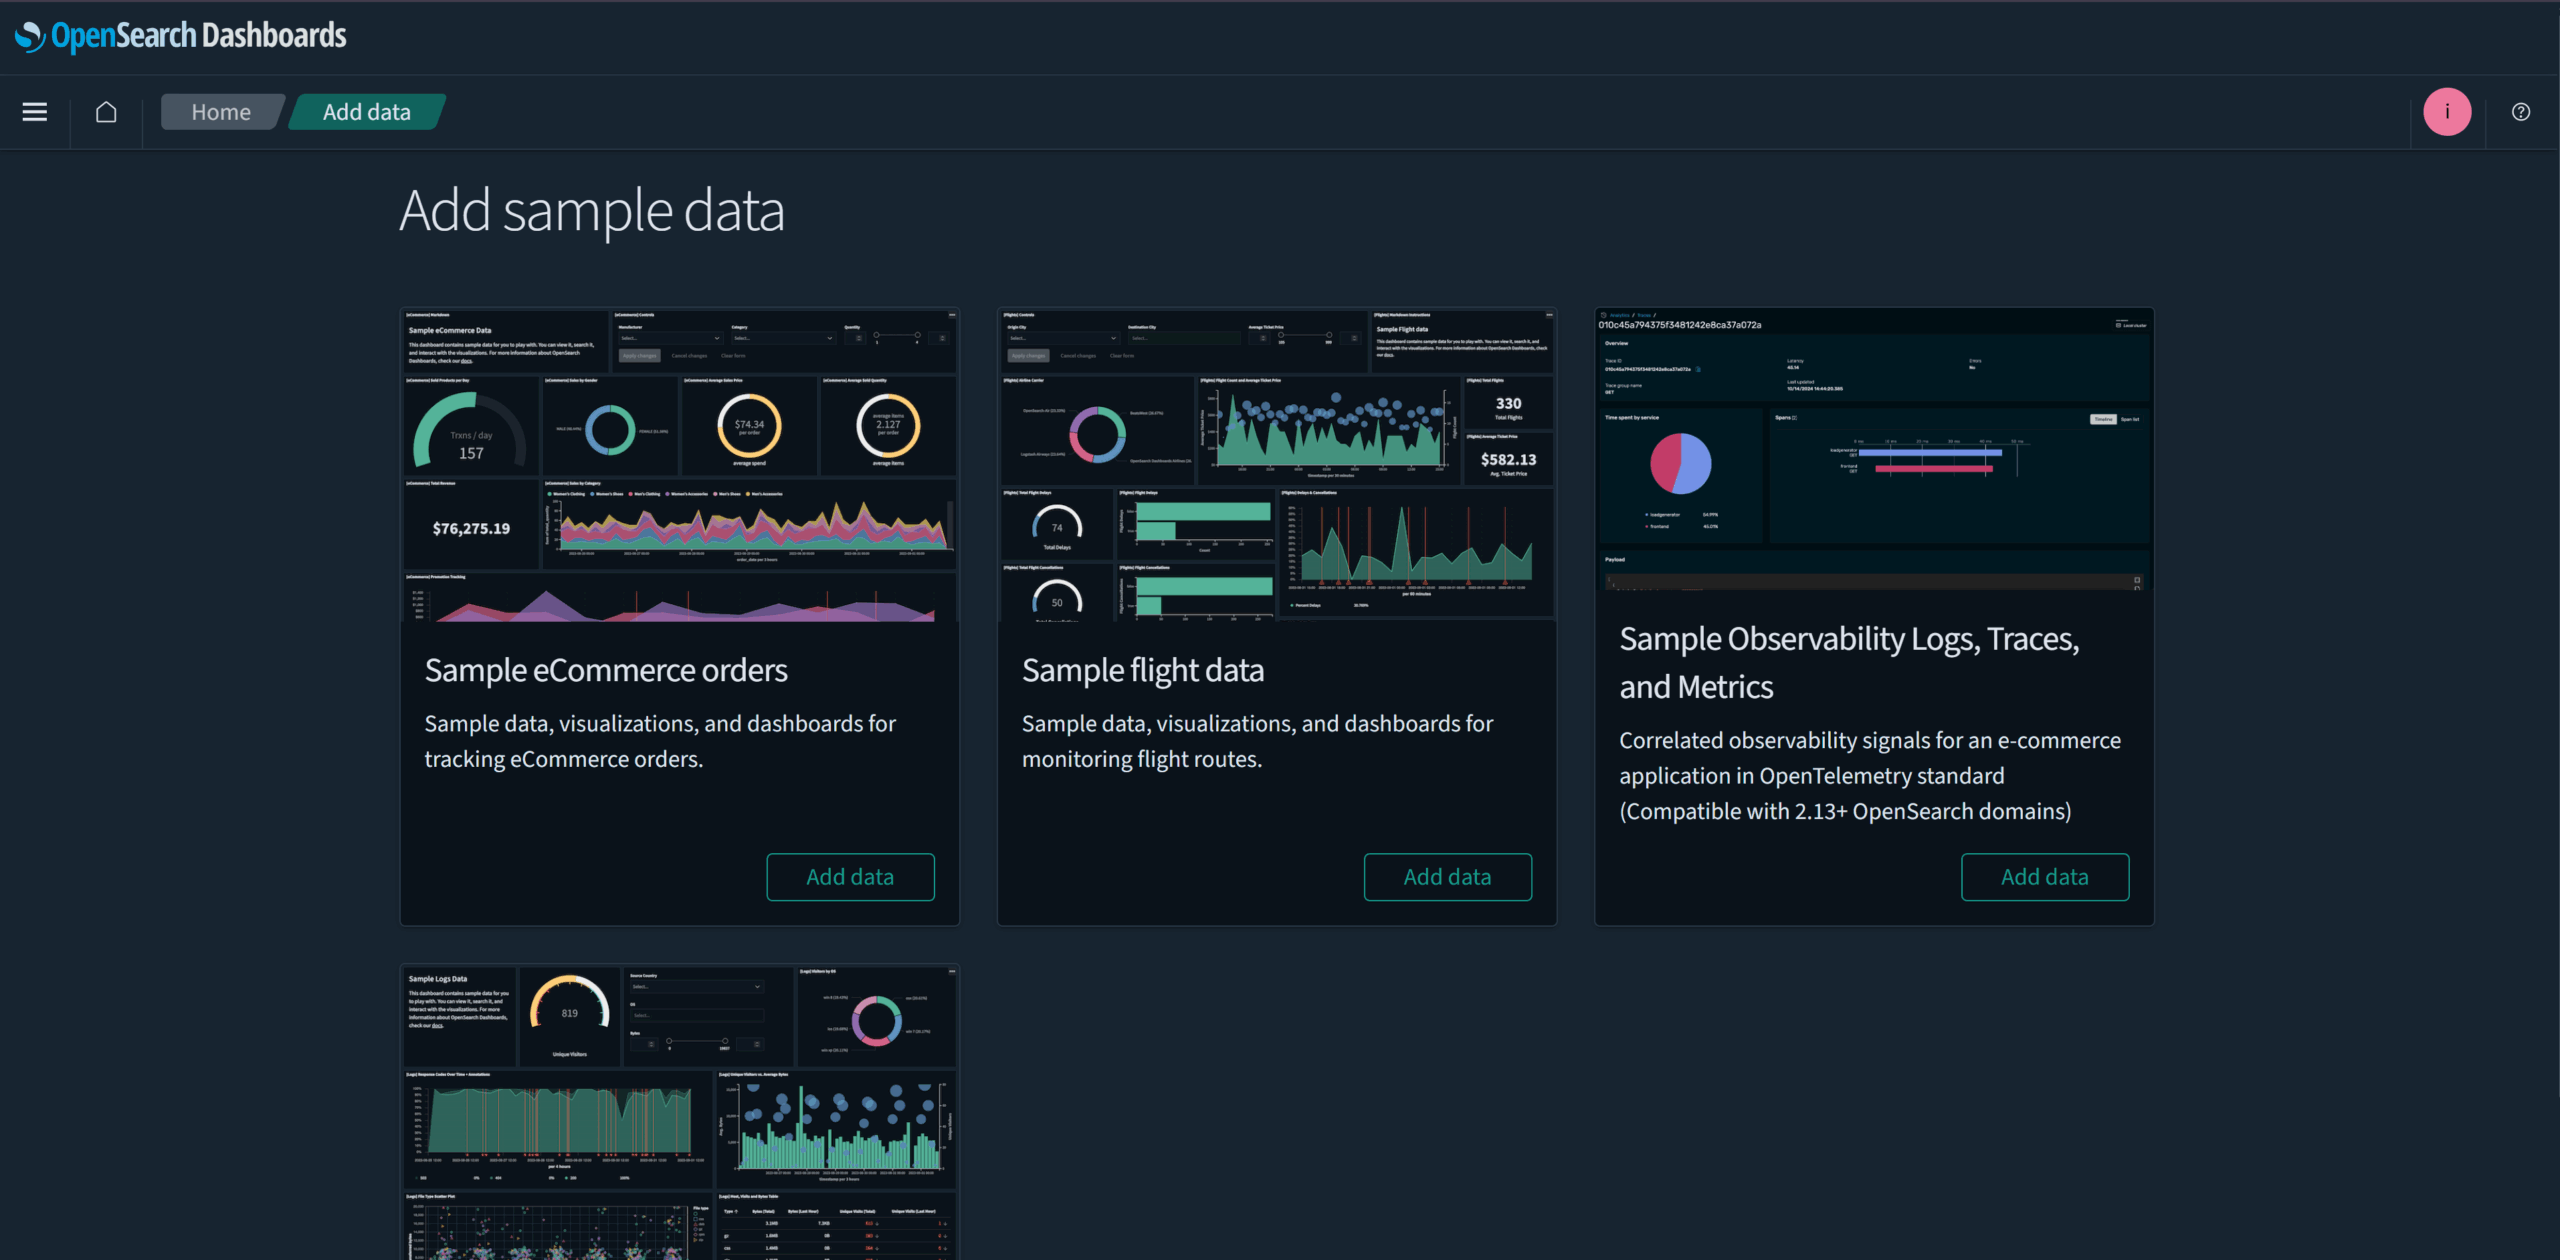
Then, click the Add data button under the Sample eCommerce orders heading:
Then, click the Home tablet in the top navigation bar:
And you’ll be taken to the home screen. Select OpenSearch Dashboards, then Discover to open the Discover tool:
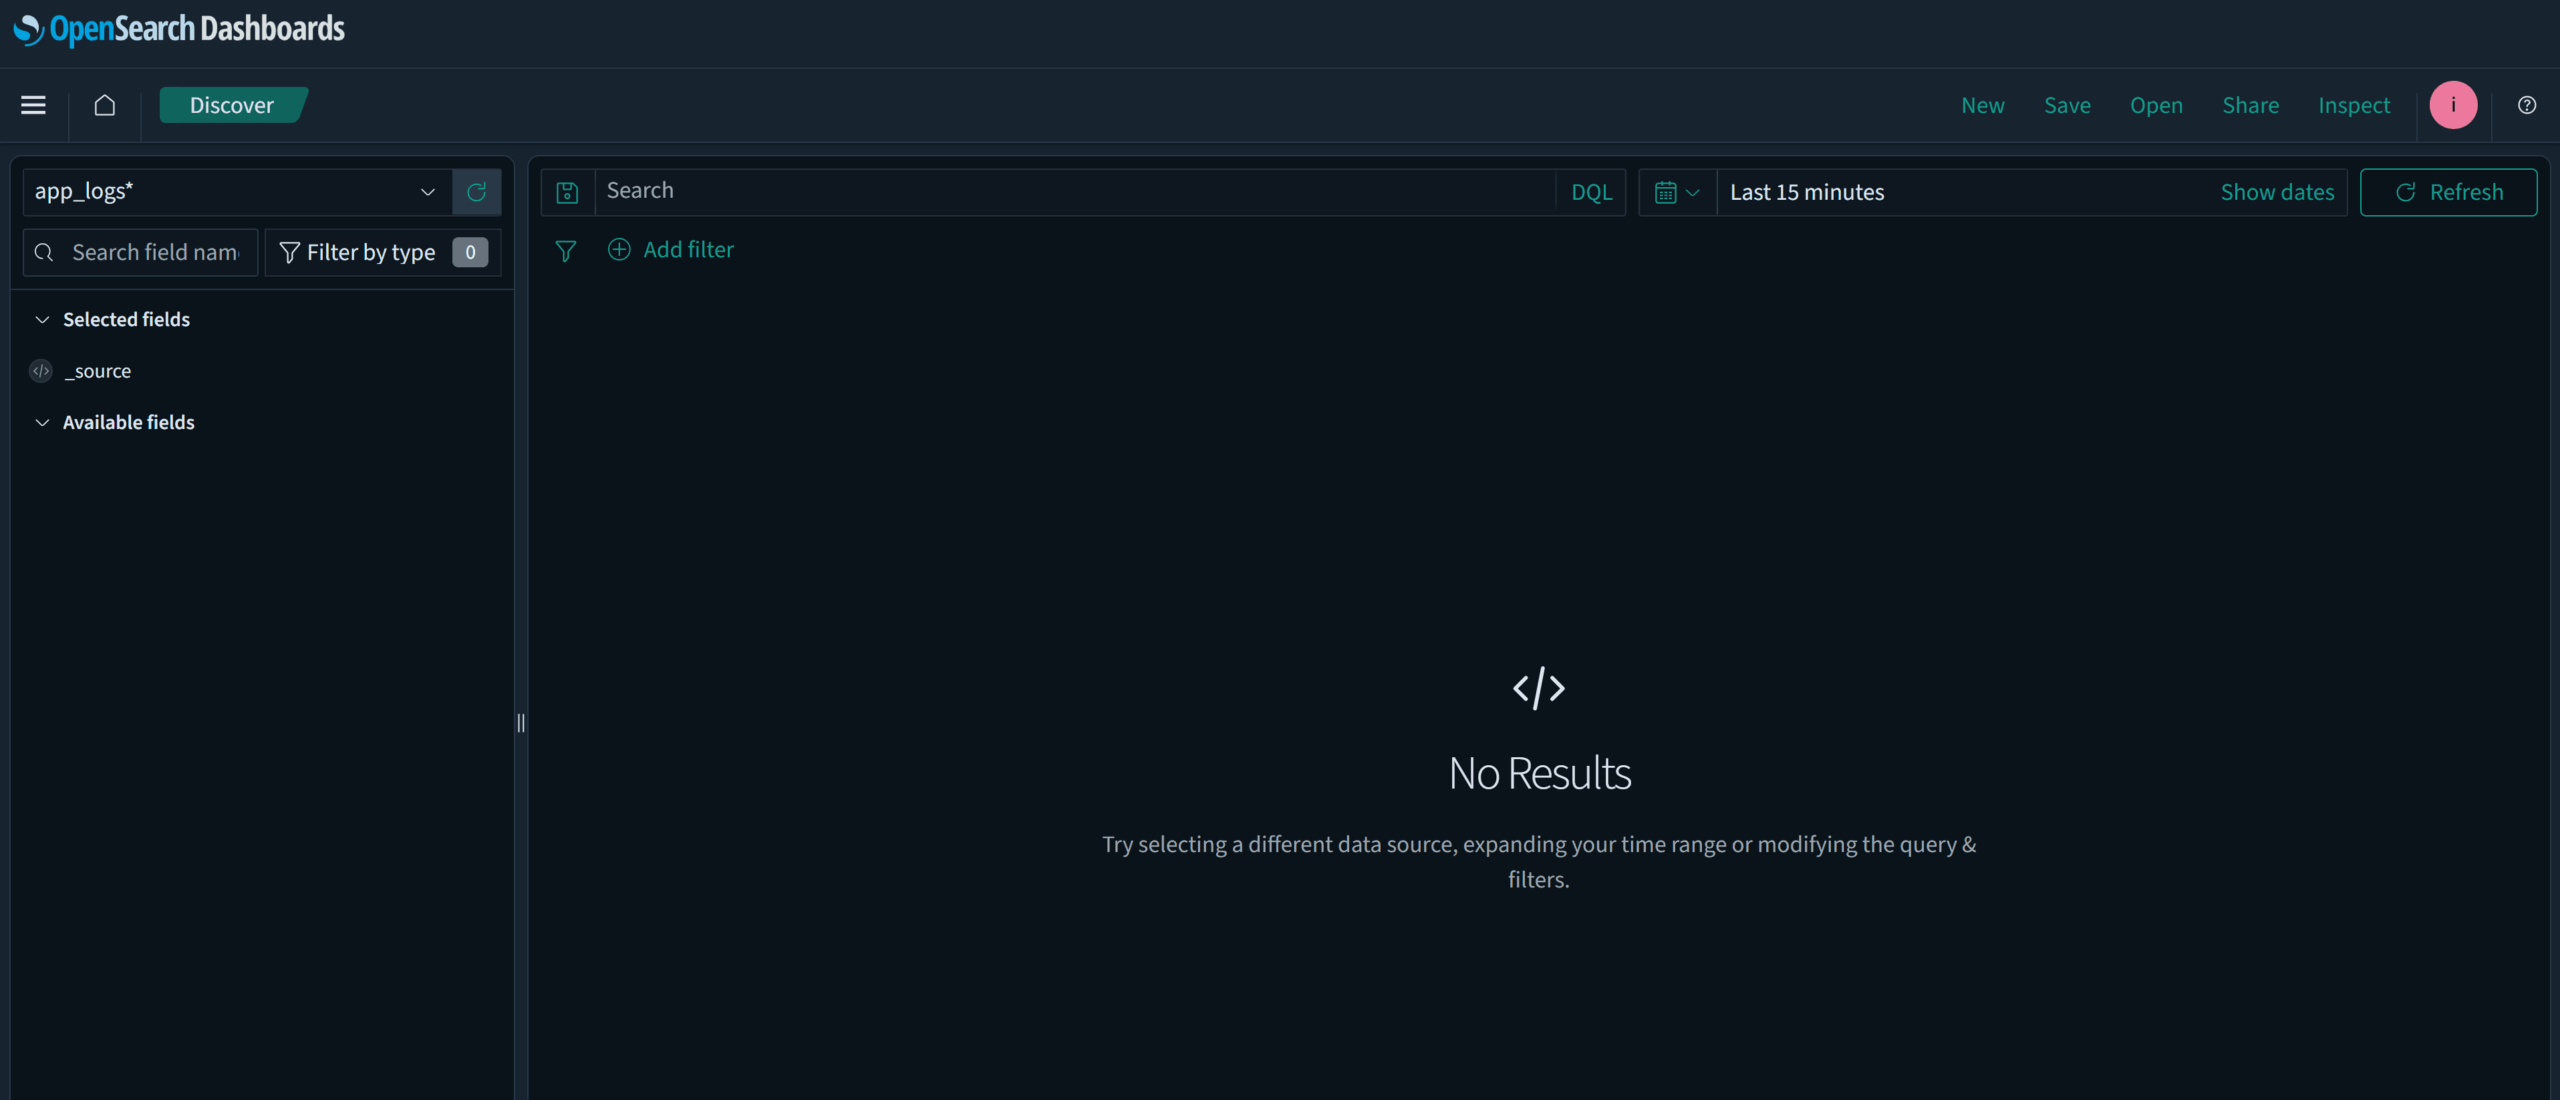
That’s it! Your sample data is ready to explore. You’ll now see a wealth of fields and metrics waiting to be analyzed.
Searching your data with the OpenSearch Discover tool
Two standout methods make searching your dataset simple and scalable:
- Filters for visual refinement.
- Queries written in DQL for precision.
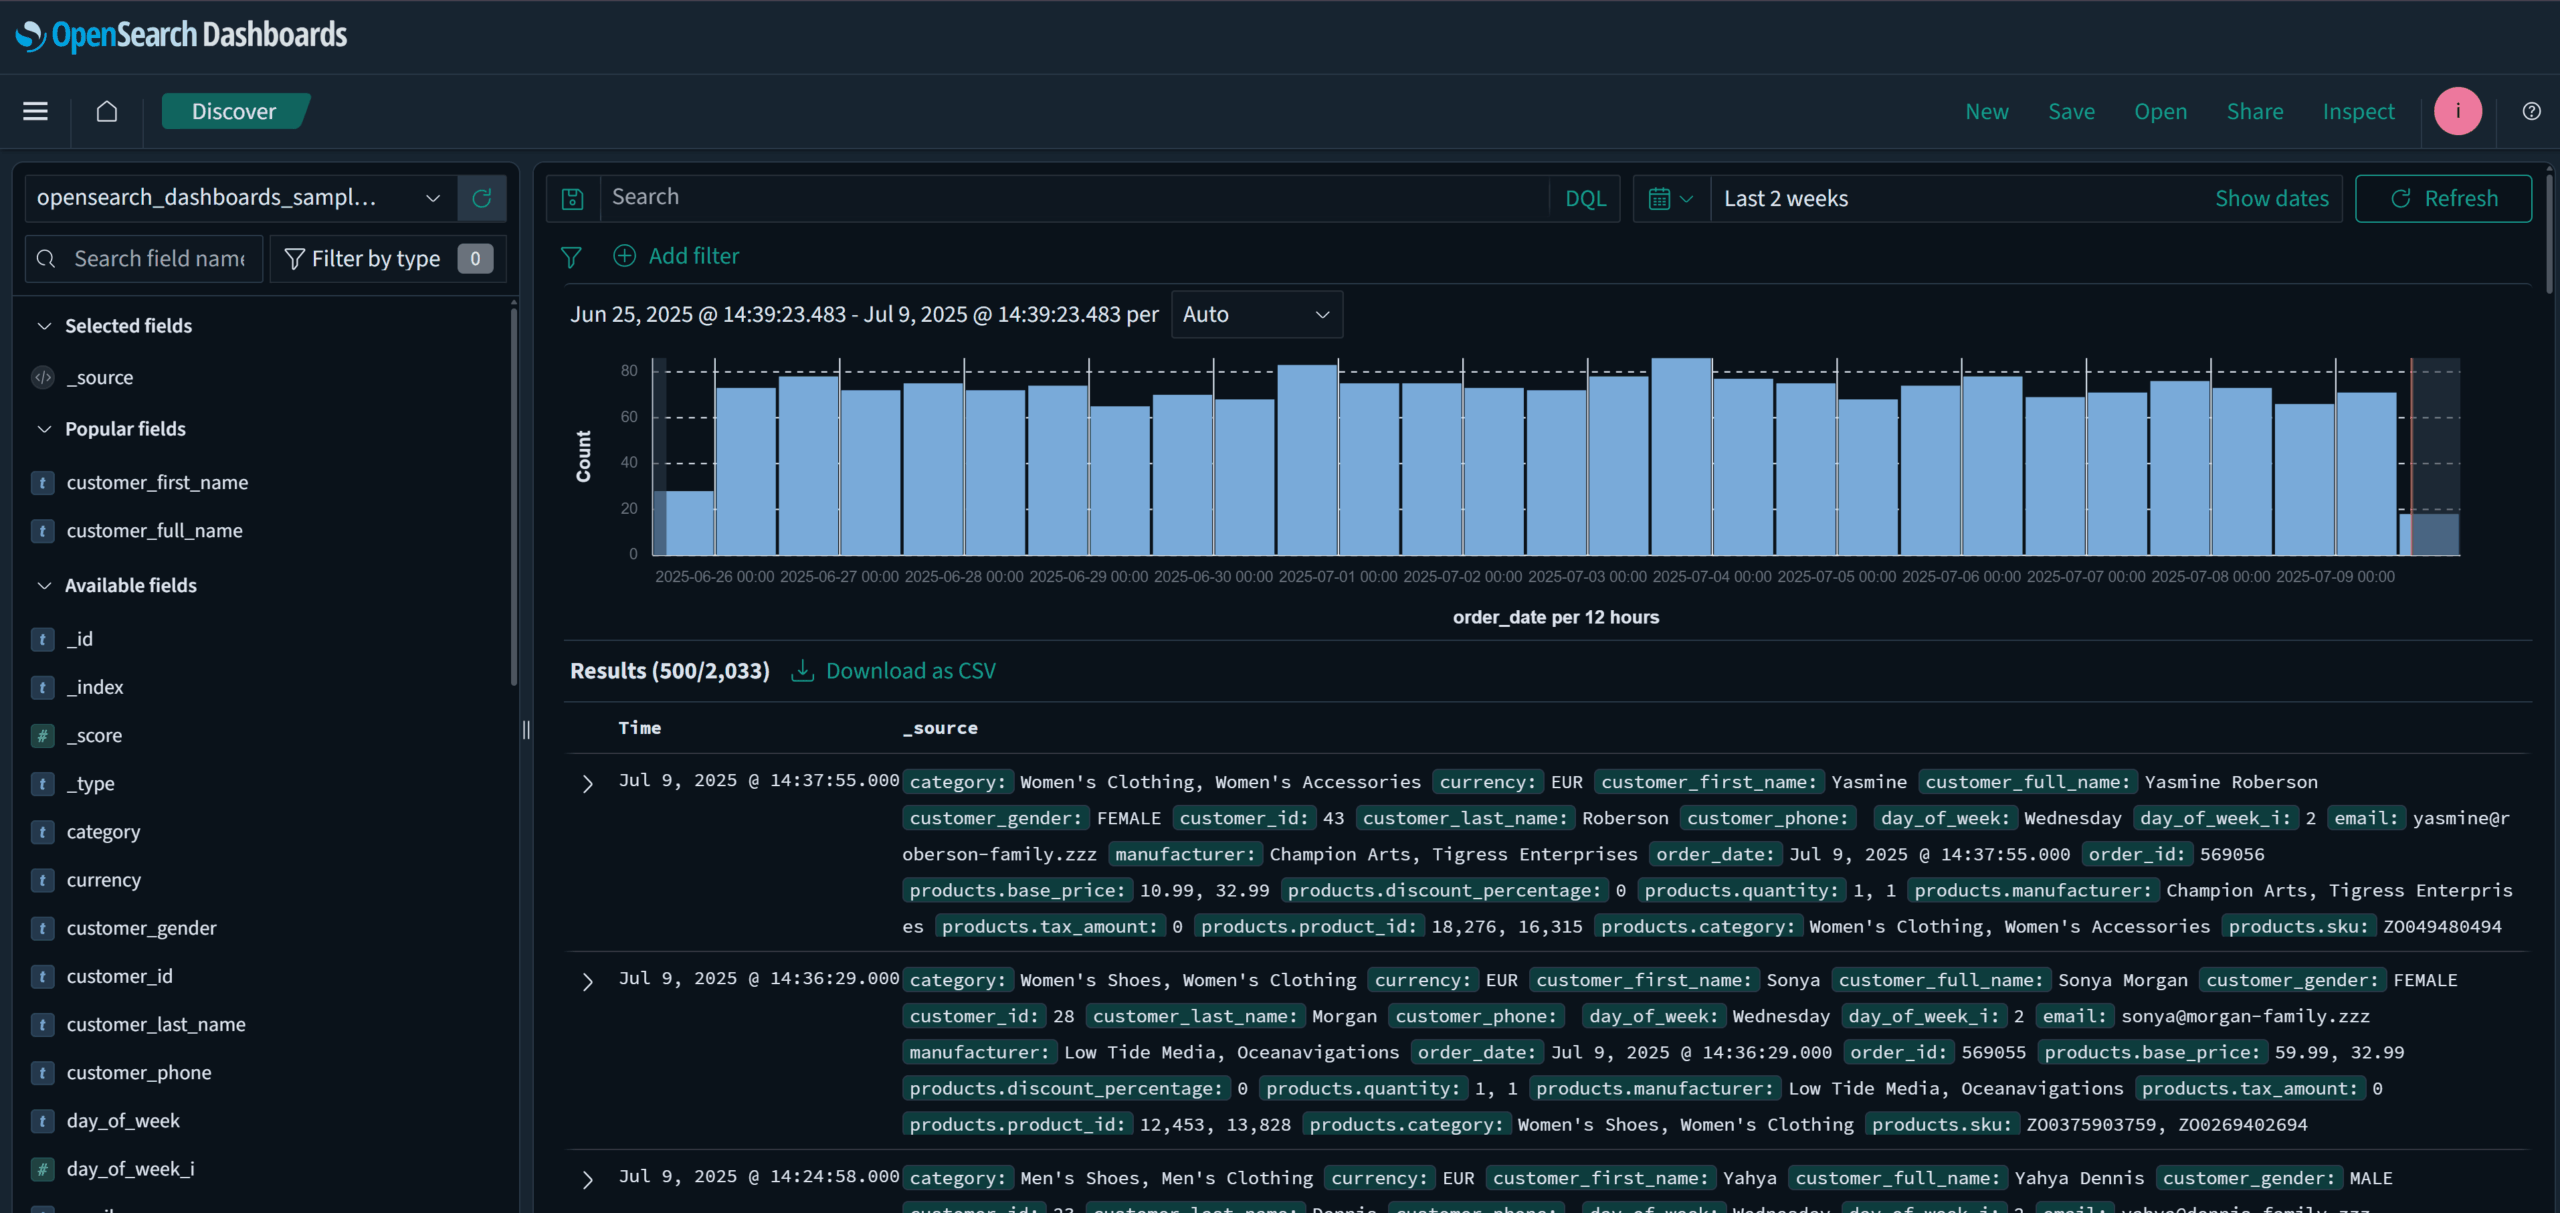
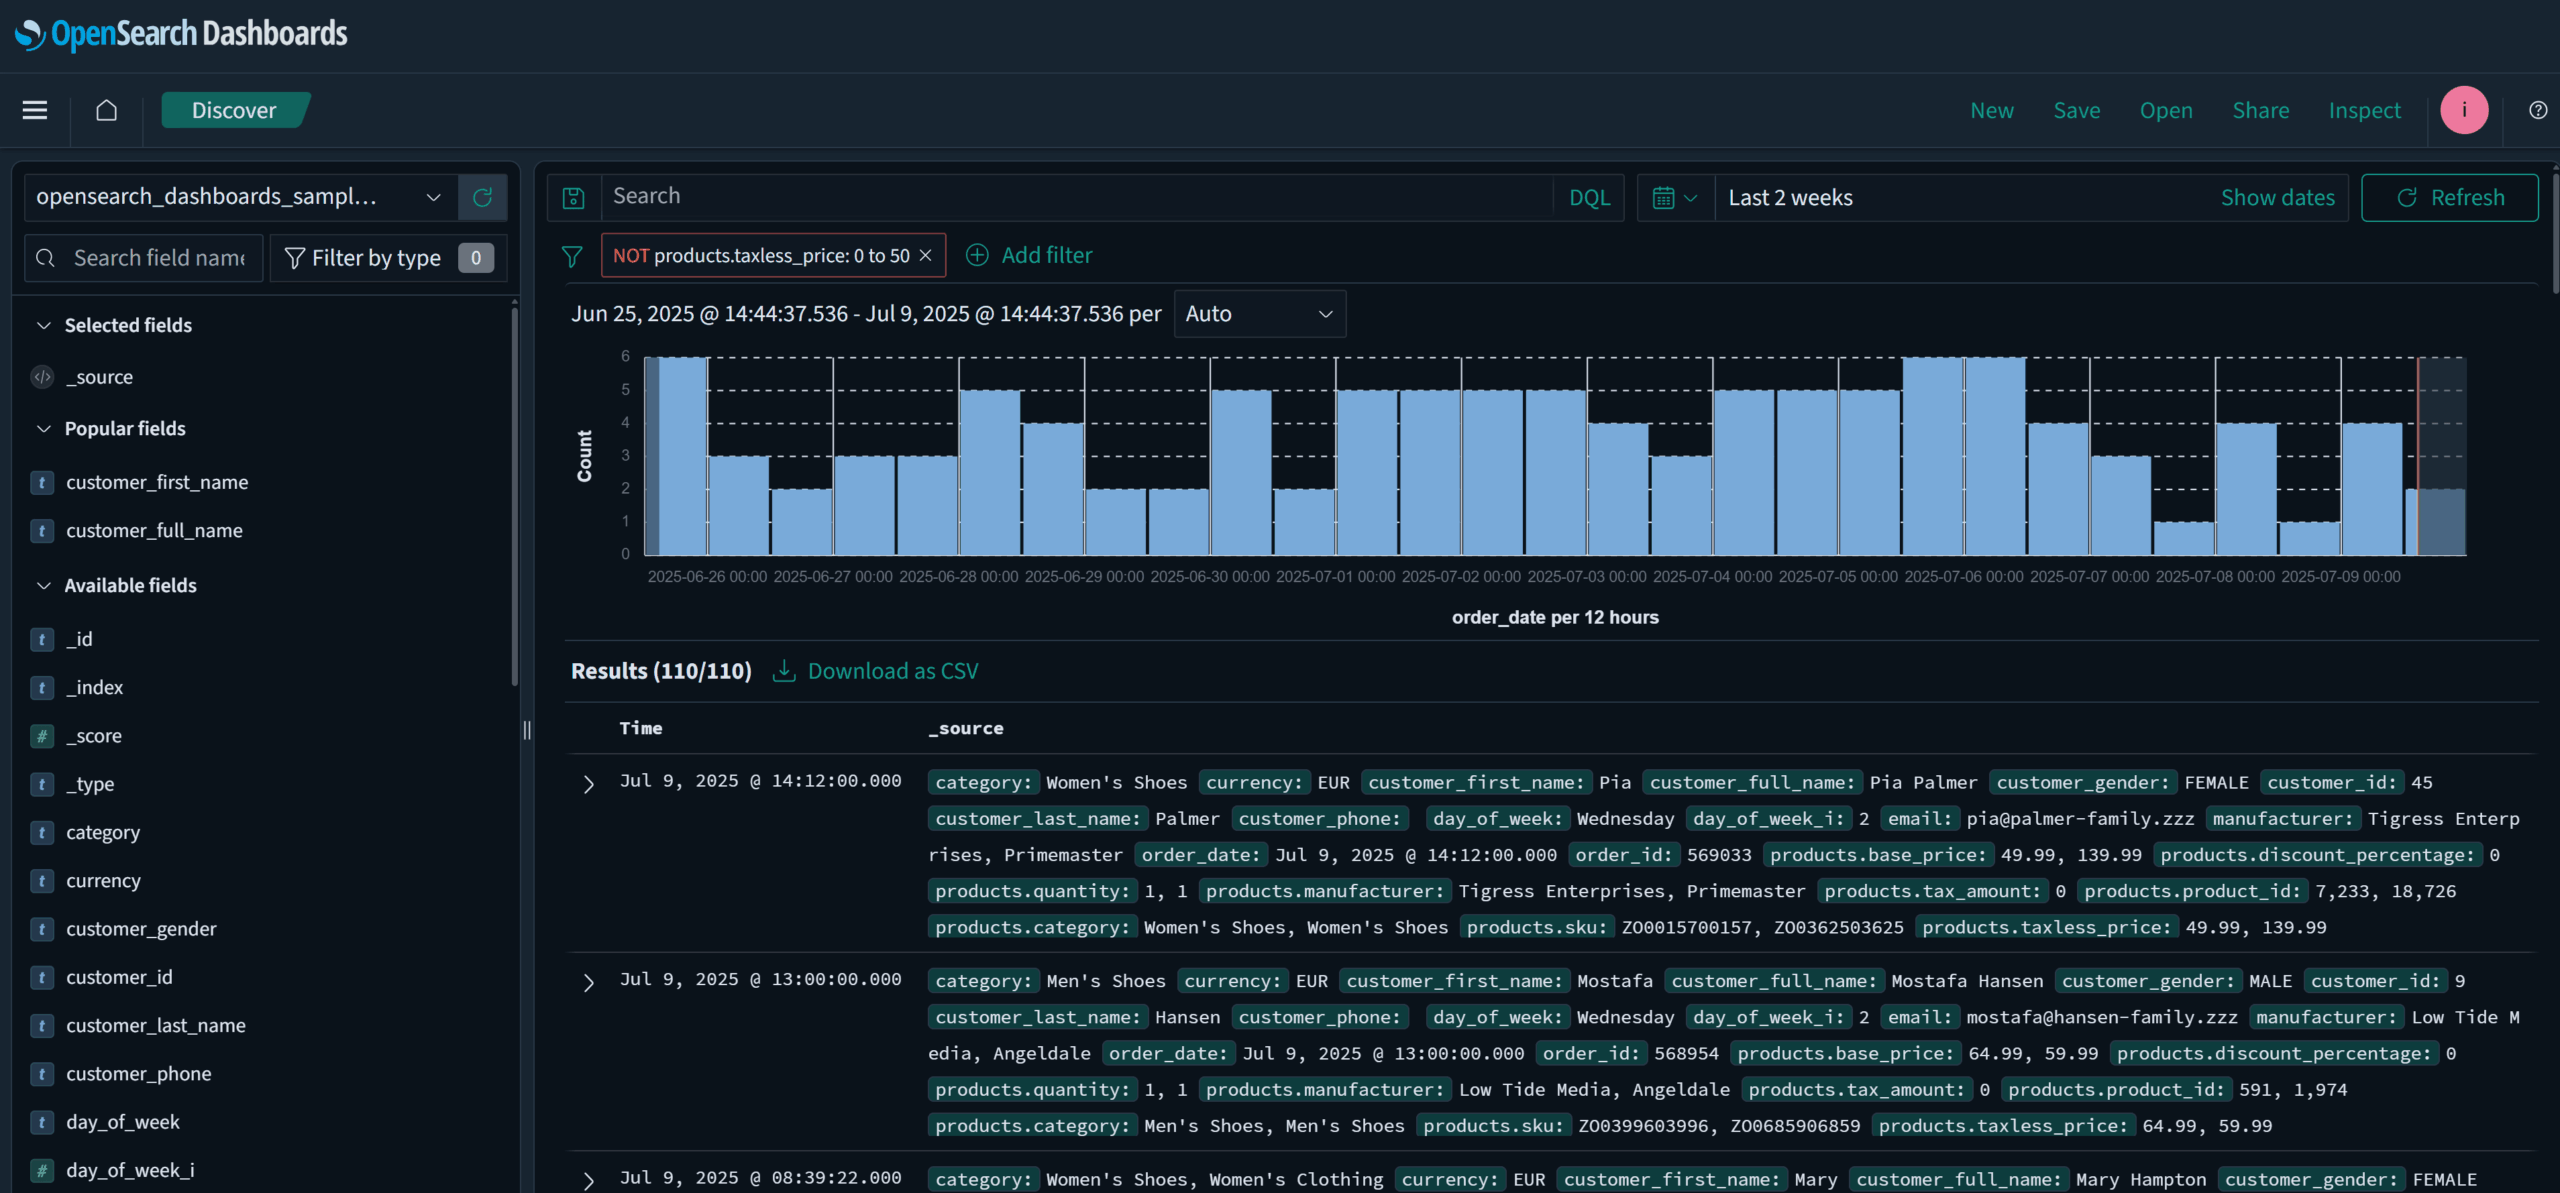
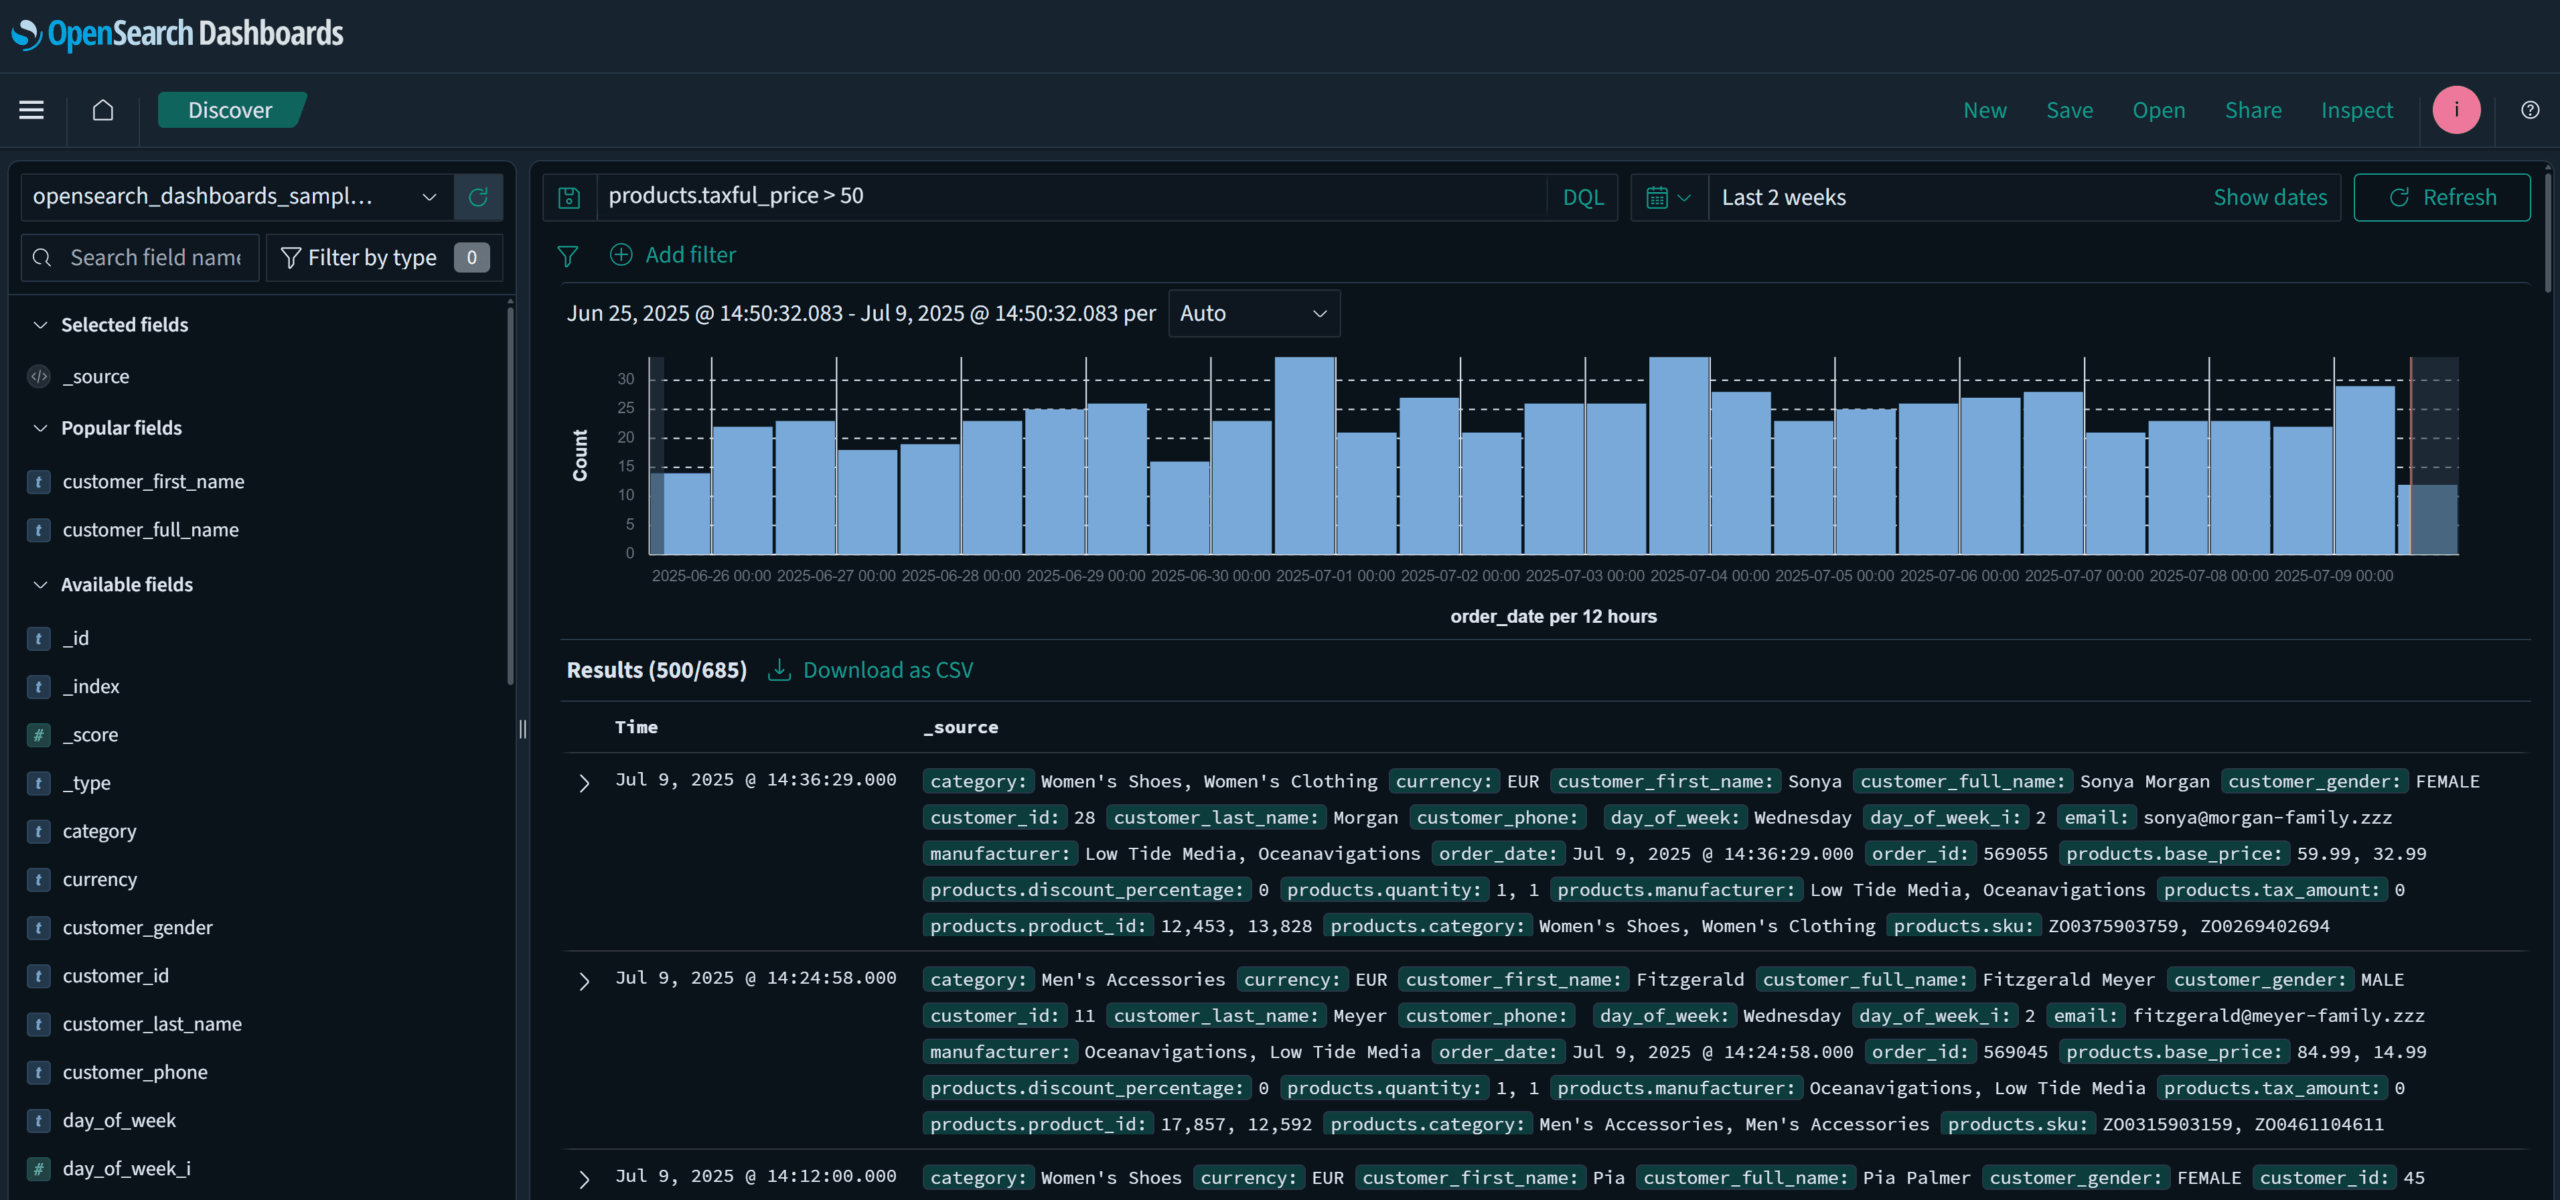
On the left side of the window, you can select your index and look at search/filter and select fields. On the right side, you can write search queries, set your timeframe for data, and see the document results of your Discover query/search. You’ll start by selecting the opensearch_dashboards_sample_data_ecommerce index using the dropdown on the top left:
On the top right, below the links, is your timeframe selector. Change it to read “Last 2 weeks” by setting the time, then click the Update button on the far right:

You should now see a good chunk of data from the index:
Now that you can call up the data, I’ll cover two ways of searching your data: filters and queries.
Refining results with filters
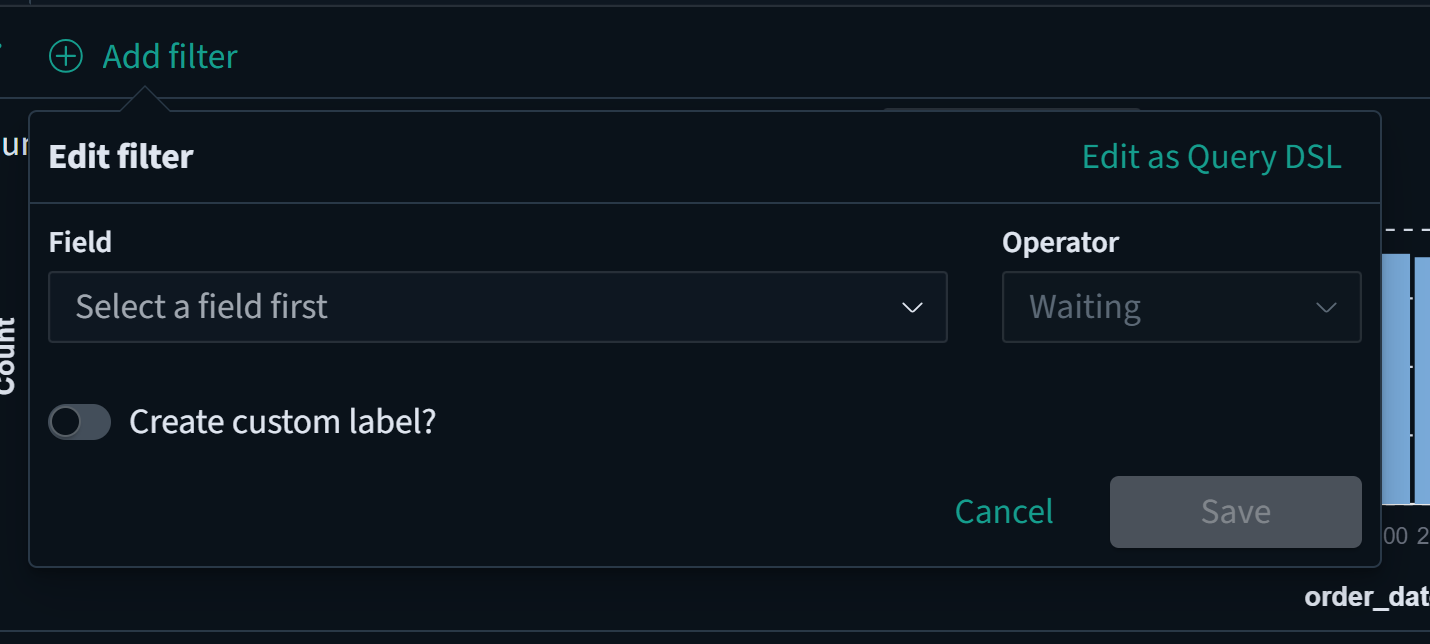
Filters allow you to refine your results based on values stored in each document’s fields. To create a filter, click the Add filter button in the top-left area of the right Discover tool panel:

You’ll see the following form:
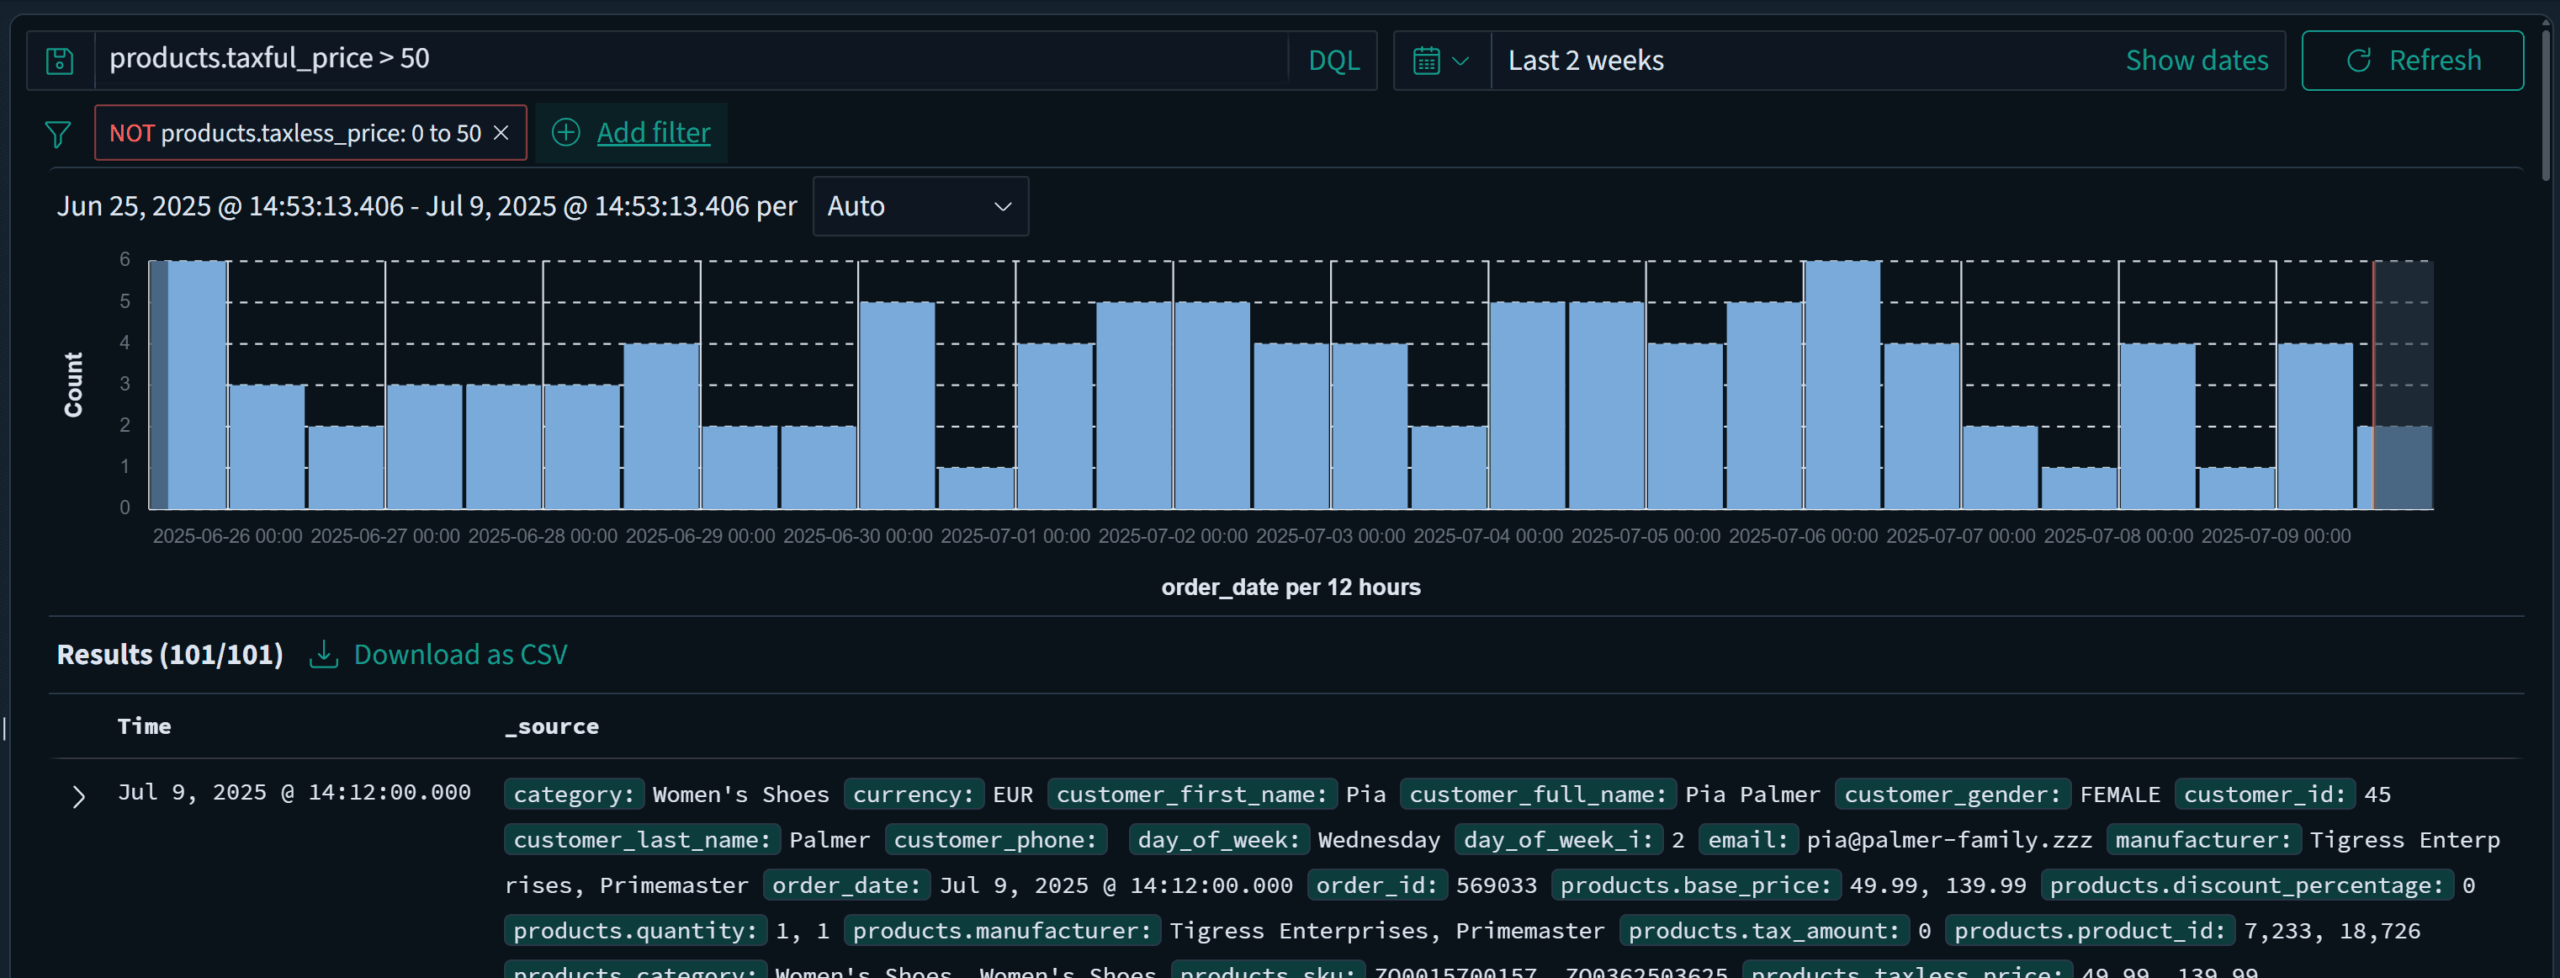
In the dropdown menu on the left, enter products.taxless_price.
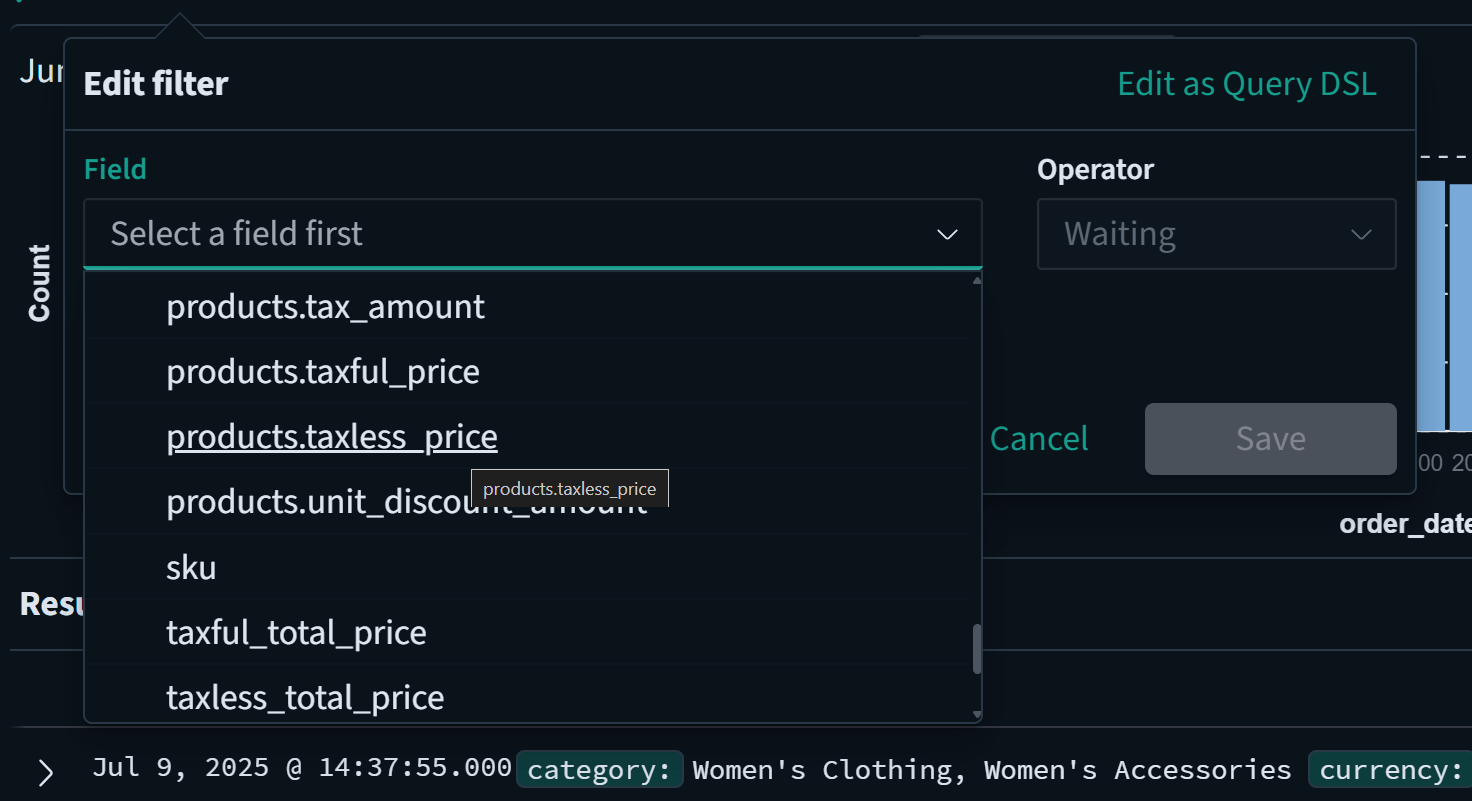
Set the filter to Operator is not between using the dropdown on the right side of the form. Then set a range of 0 to 50.
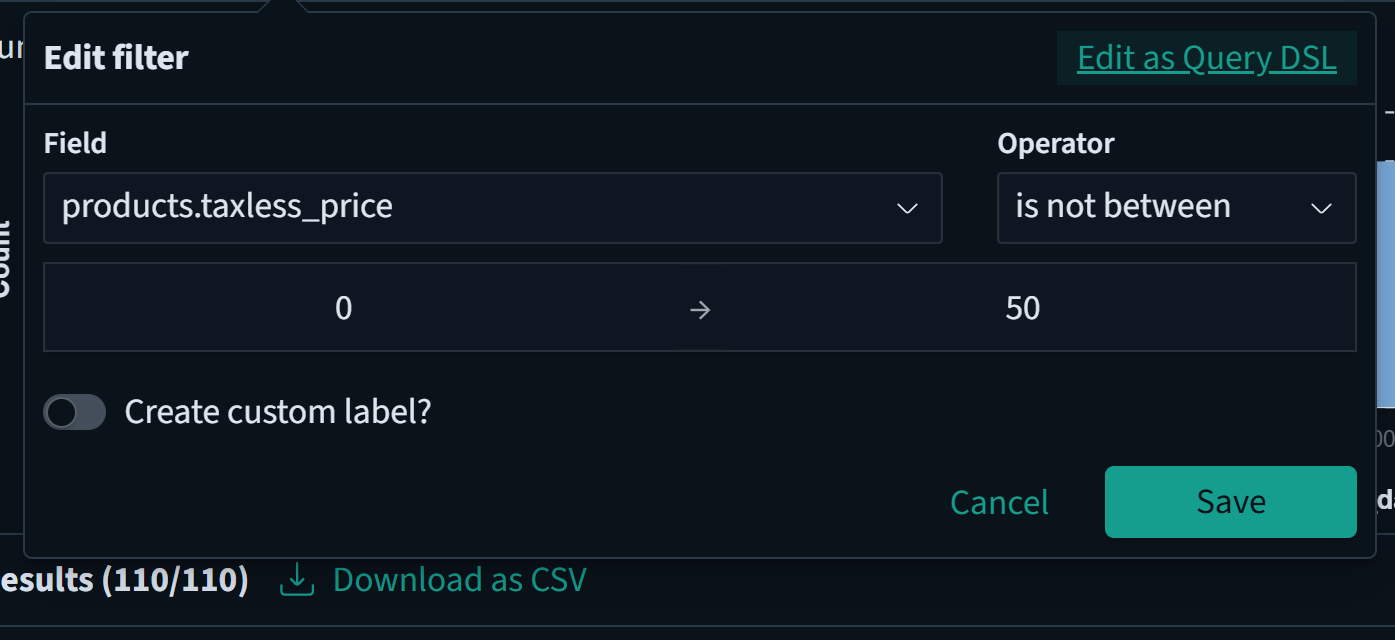
Hit Save. You’ll see all orders with price before tax above 50 or below 0.
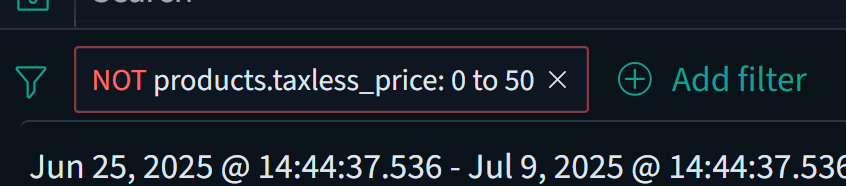
To clear the filter for the next exercise, click the X button on the filter box that appears for our filter:
Next I’ll cover using DQL queries to search your Discover data.
Writing DQL queries to search
Data Query Language, or DQL, is a simplified query language used with OpenSearch. You can learn more about how to write the queries here. For today, I’ll walk you through setting up a query. In the text box at the top left of the right pane, enter the following: products.taxful_price > 50.
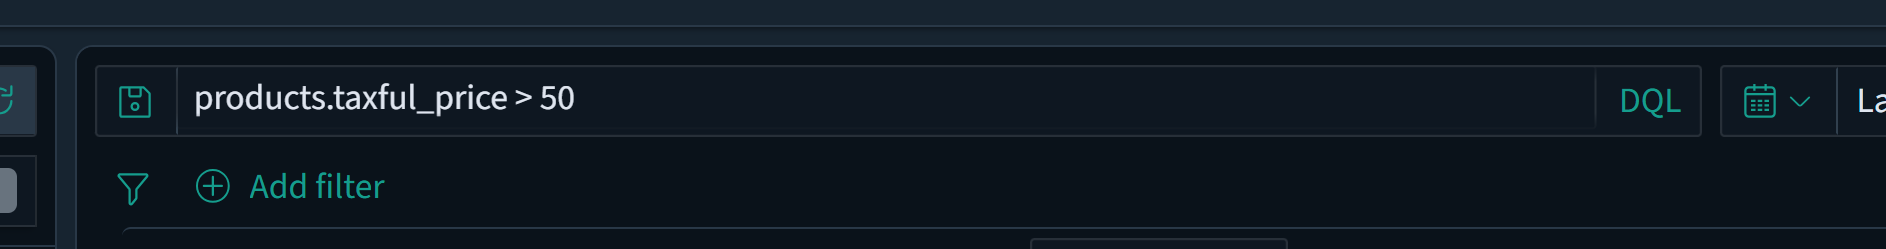
Then hit the Update button, and you’ll see all orders with a price with tax over 50.
Don’t forget you can combine techniques! Filters and queries can be combined:
Next, I’ll cover visualizing the data you’ve searched within the Discover tool.
Visualizing data in the Discover Tool
Now that you’ve learned how to search and filter your data, I’ll cover creating quick visualizations in the Discover tool. While these may not be as complex as the visualizations in Dashboards, it’s perfect for one-off charts and experimentation.
To get started, hover over any field in the left column that can be visualized (numbers are an easy one). Here, I’m using product.base_unit_price. You’ll see a magnifying glass icon:
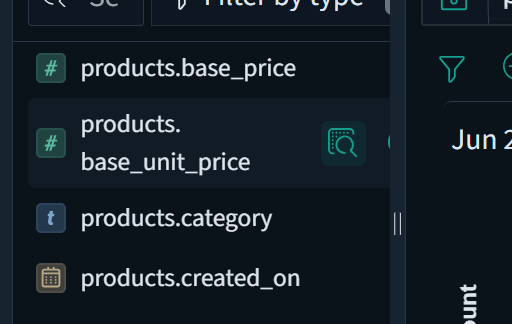
Click it, and a pop-up menu will appear:
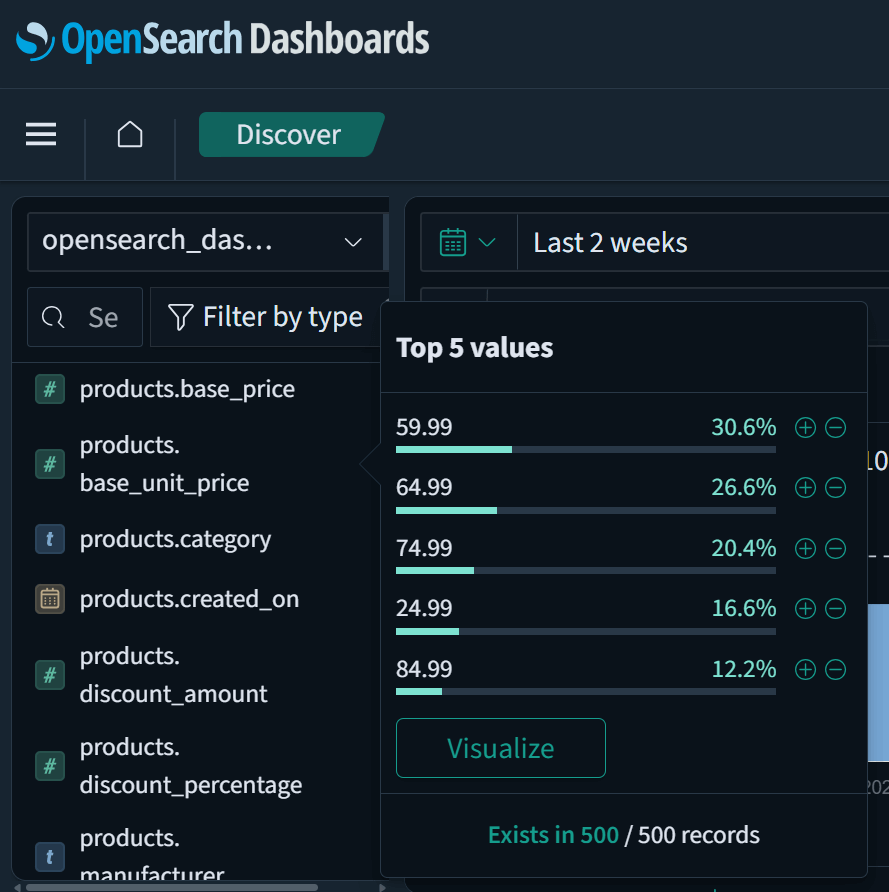
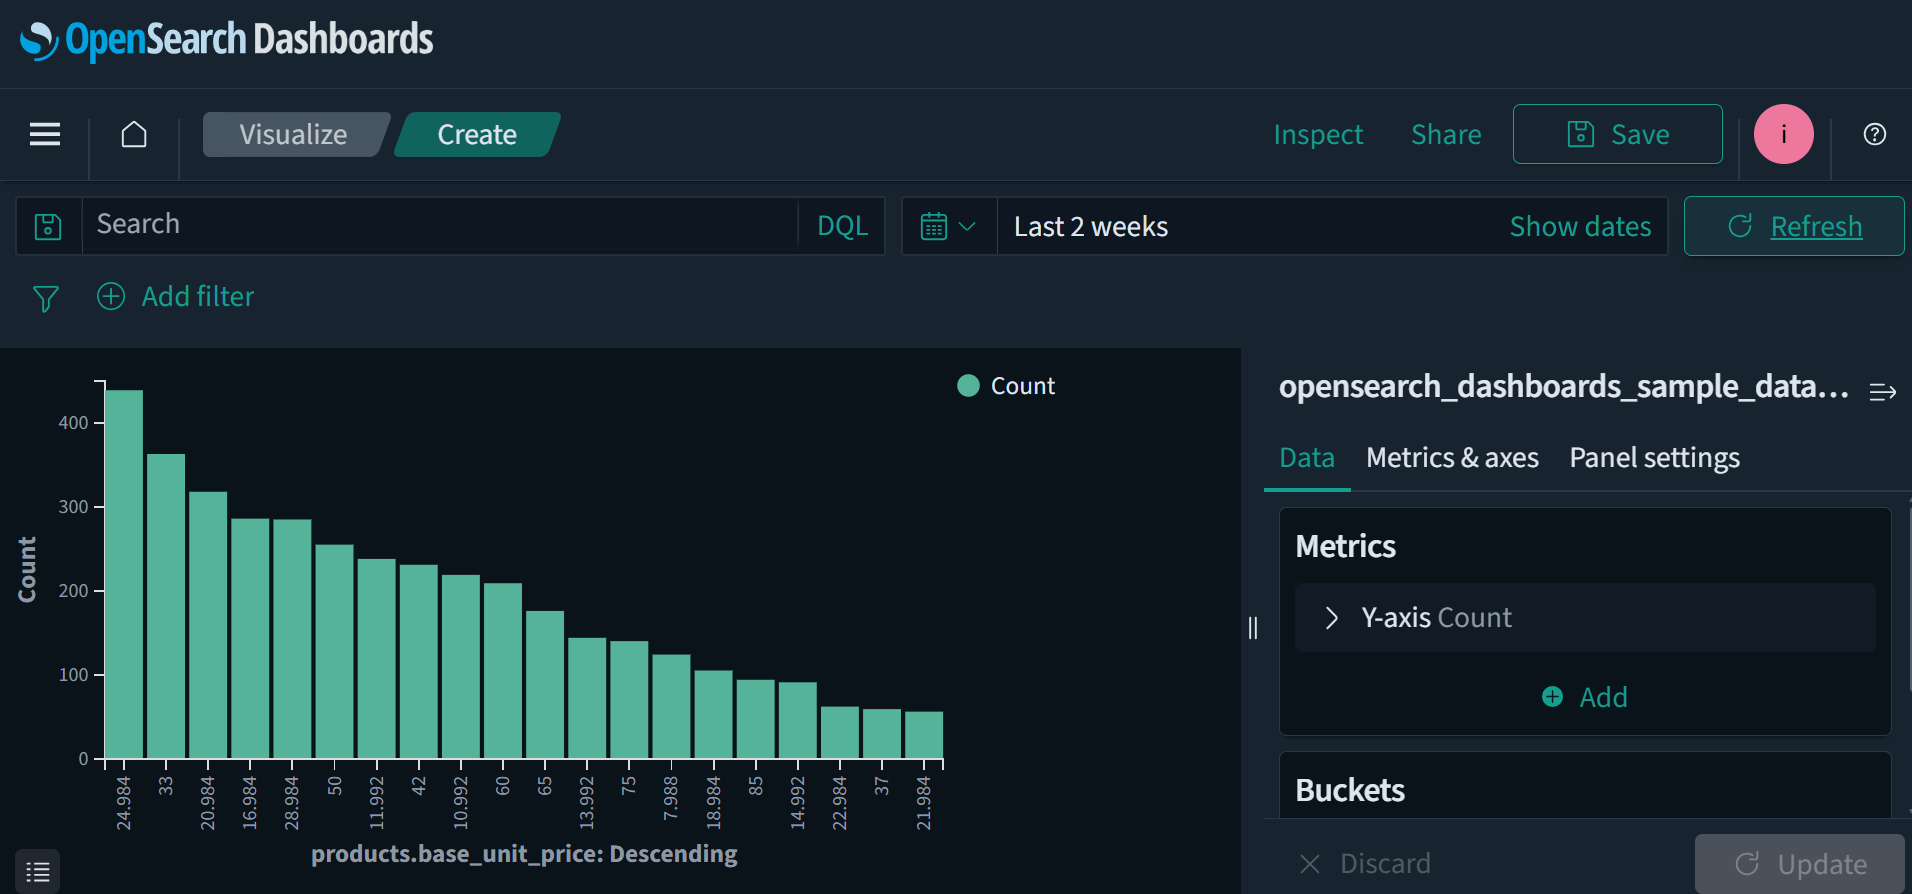
Click the Visualize button in the popup to be taken to a bar graph of field data:
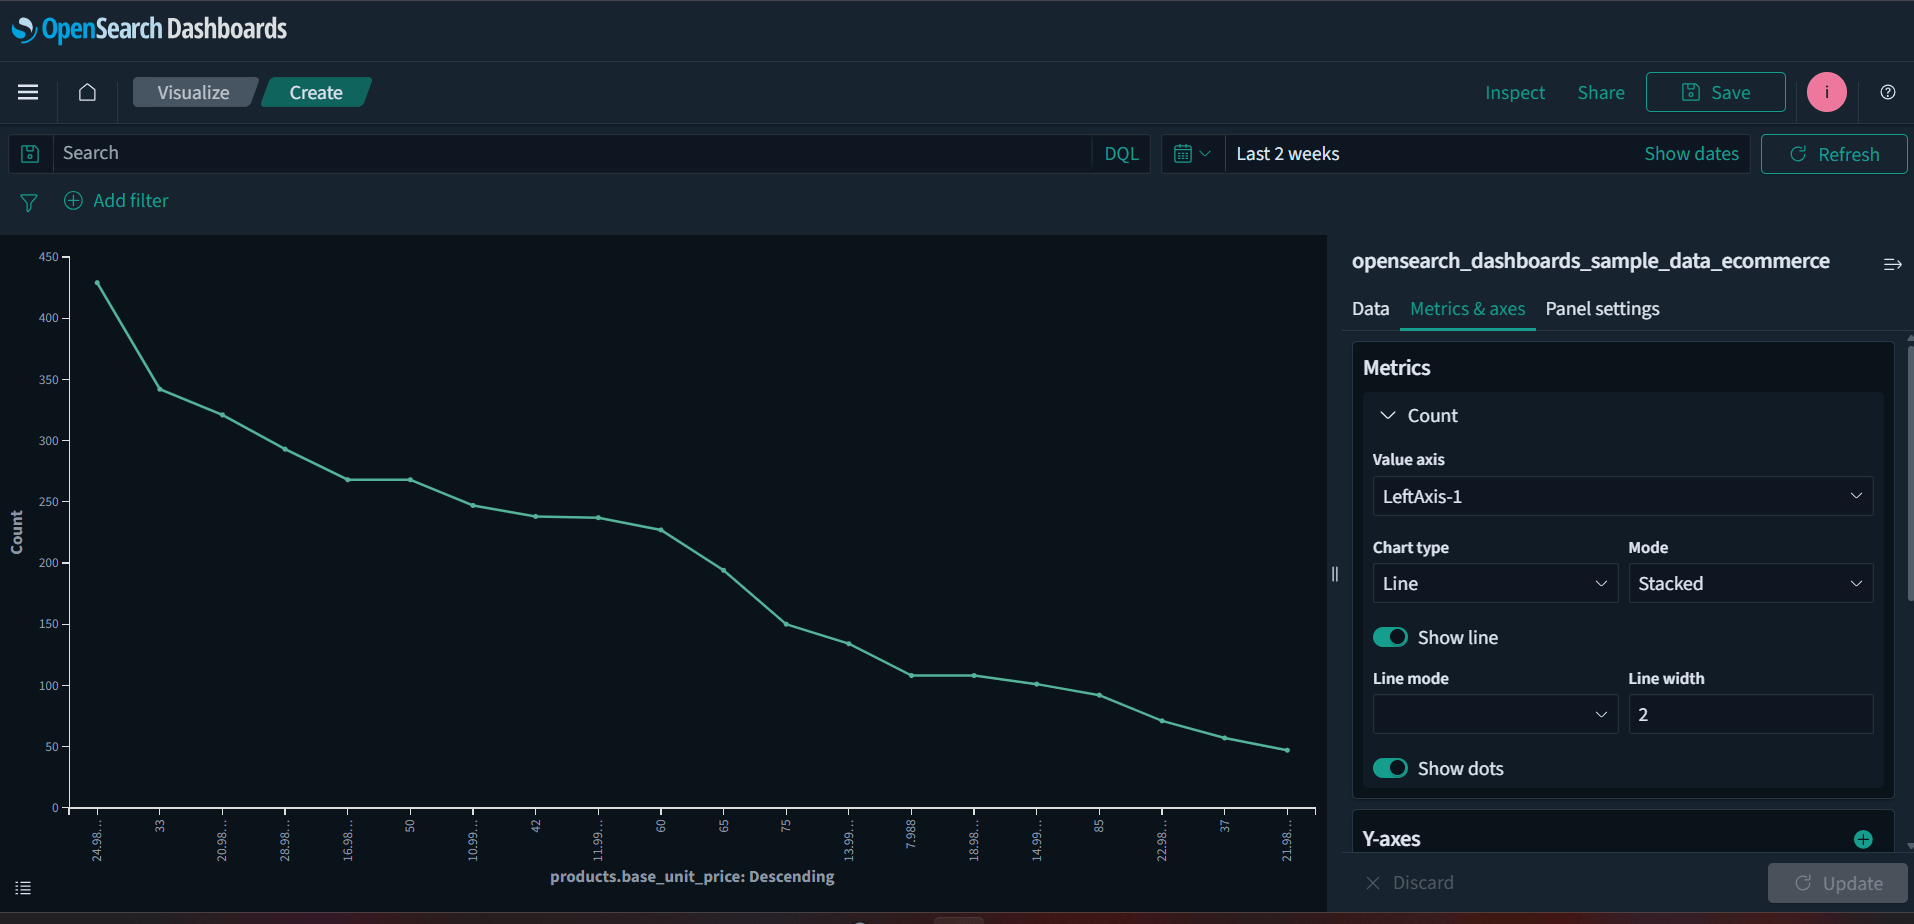
If you click the Metrics & axes tab in the right pane, you’ll see options to change the visualization type. Change the type to Line and click the Refresh button.

You’ll now have a line chart of the price data.
Sharing Discover data with others
Collaboration is seamless with the Discover Tool’s built-in share options. Once your data or visualizations are ready, here’s how to share them.
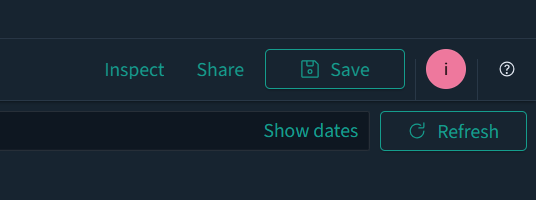
You should see a Share link and a Save button. Click the Share button.
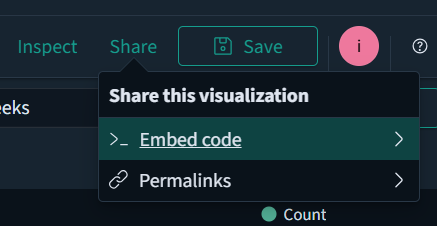
The share button presents you with 2 options: Permalink and Embed code.
Embed code provides you with code that you can put on your own webpages to show your data:
|
1 2 |
<!-- sample HTML embed code --> <iframe src="https://opensearch-dashboards.c108f8415ee44ff39f8bade2e1fda4be.cnodes.io:5601/goto/b360db006533e5af3e4aae47e159ab57?security_tenant=private" height="600" width="800"></iframe> |
Note that these cannot be seen by people who cannot see your dashboard data; this is for internal sharing only.
The permalinks section will provide you a link (you can even set it to produce a shortened link) to the visualization or data you’ve collected.
|
1 2 |
<!-- sample permalink to OpenSearch data --> https://opensearch-dashboards.c108f8415ee44ff39f8bade2e1fda4be.cnodes.io:5601/goto/a0d0061caafedd3a22653c2baa84583b?security_tenant=private |
Why the OpenSearch dashboard matters
The OpenSearch Dashboard is more than just a visualization tool. By combining the querying power of the Discover Tool, data visualization capabilities, and seamless sharing options, it transforms how businesses extract value from their data. Whether you’re looking to surface trends in e-commerce, monitor system logs, or analyze customer behavior, these tools offer clarity and efficiency.
In this tutorial you learned how to use the OpenSearch Dashboards discovery tool to search, filter, visualize, and share your data in a notepad-like way that can be saved into a full visualization. You could go on to add alerting to your new visualization, and so much more. Want to see it in action? Spin up an OpenSearch cluster with Instaclustr free and explore how these tools can transform your data analysis workflows.