How far have we progressed in our Agent Systems and A2A “campaign”?
In Parts 1-3, we treated the topic in prose: why multi-agent interoperability matters (Part 1), the core A2A objects (Part 2), and the operational patterns in (Part 3). Useful, but when I turned to implementation, I kept wanting sketches on the table: where modules sit, how objects connect, what the wire sequence looks like, which task states are legal.
The diagrams that follow are that layer. They provide a visual guide to the Agent2Agent protocol and help translate the specification into something easier to design, implement, test, and reason about.
And on the subject of sketches rather than speeches…
A visual guide to the Agent2Agent protocol
“A good sketch is worth more than a long speech.” — Napoleon Bonaparte
Napoleon Bonaparte was a fan of sketches, maps and tactical diagrams to help visualise battlefields in his mind, but the most famous “Napoleon” diagram came decades afterwards: Minard’s diagram of Napoleon’s invasion of Russia. It was an early Sankey diagram, a style I’ve used extensively to visualise software performance, for example tracing Apache Kafka with OpenTelemetry and sizing Apache Kafka clusters for tiered storage.
I’ve also used diagrams in scientific papers and conferences to help me, and others, understand how protocols work, for example, the Java Entity Bean Life Cycle in Middleware 2001.
I was therefore a bit disappointed to see fewer diagrams than I would have liked in the A2A documentation or specification to aid me, and hopefully others, in better understanding the details. The solution? Turn the specification into a bunch of UML-like diagrams for me to use as a visual guide with the protocol (UML or Unified Modeling Language).
This post presents several Agent2Agent protocol diagrams that function as different lenses on the same system. Together, they build a layered mental model of A2A from architecture to implementation.
The diagrams include:
- The component diagram showing the major runtime boundaries and responsibilities in A2A architecture.
- The class/object model diagrams mapping the core protocol entities and relationships that drive code design.
- The runtime sequence diagram showing how requests actually flow, including immediate responses, long-running tasks, updates, and final artifact delivery.
- Finally, the task lifecycle diagram defining valid state transitions so clients and servers stay consistent.
Together, these visuals are meant to make A2A practical: not just something to read in a specification, but something you can design, implement, test, and understand with confidence. But watch out: these diagrams were produced using AI-assisted visualization tools and reviewed against the published specification. They are intended as explanatory aids and are just a best-guess attempt, rather than normative specifications.
A2A architecture diagram: high level system components
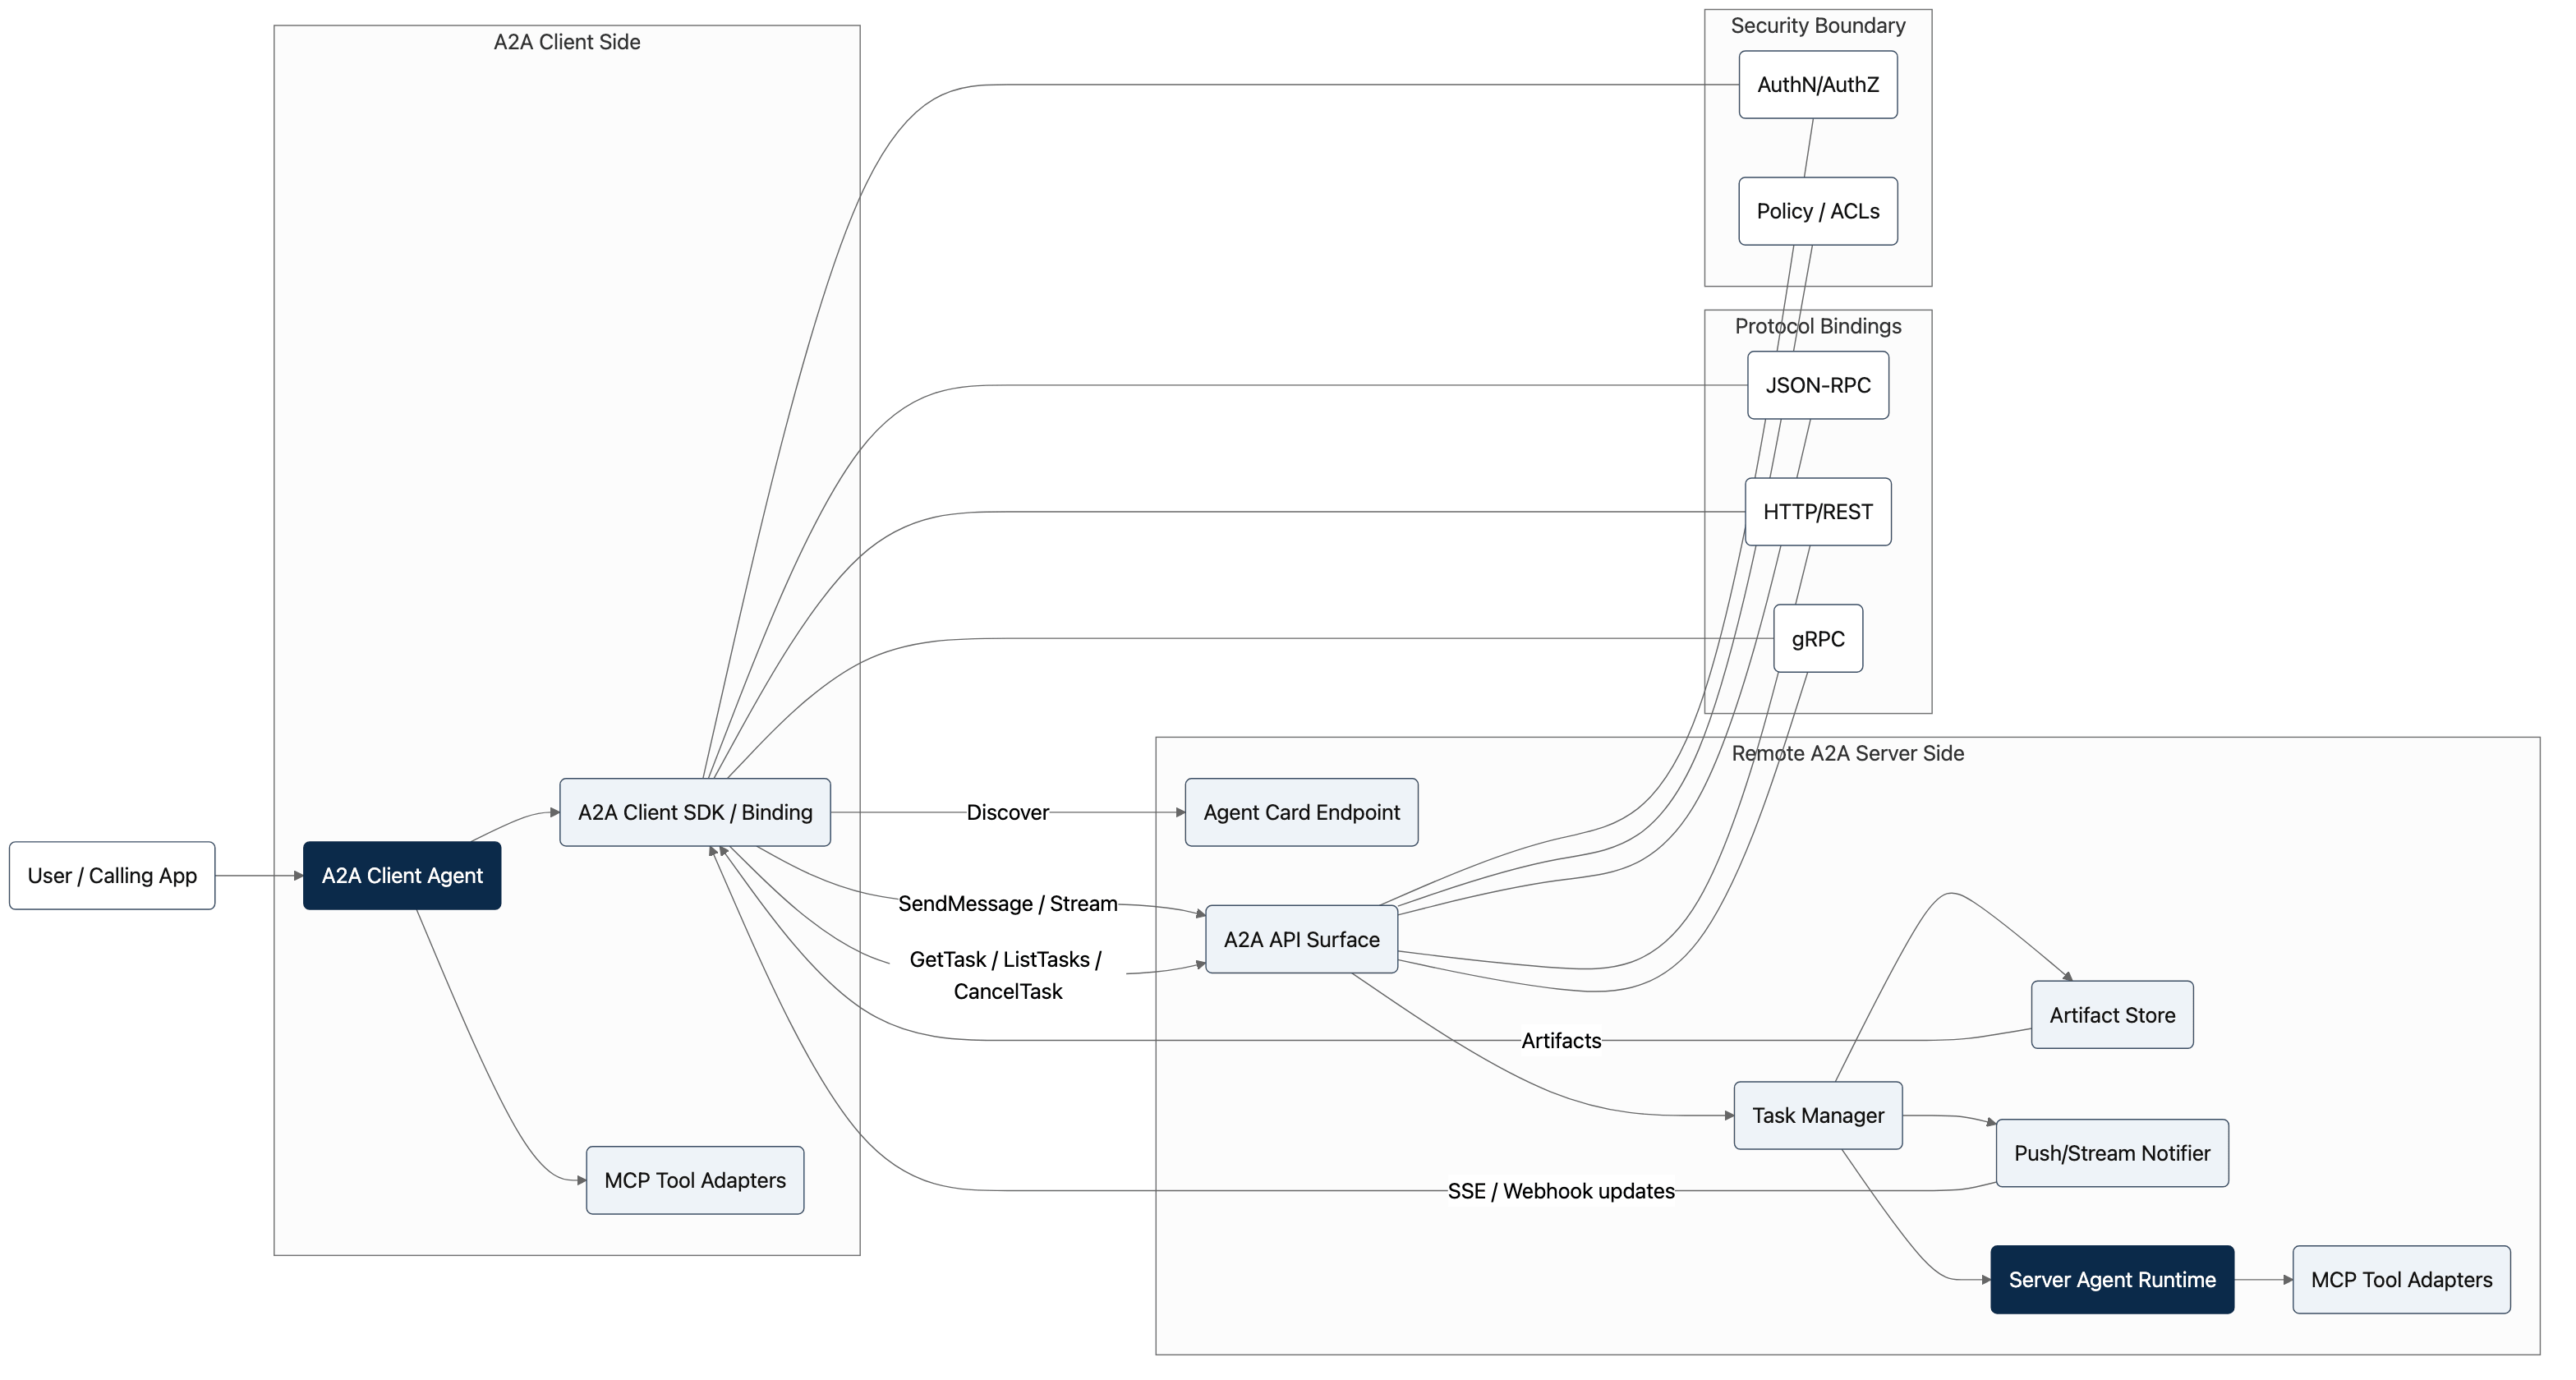
Figure 1: Component diagram showing A2A client and remote server sides, protocol bindings, and authentication spanning the communication boundary. Security controls, shown with dashed lines, cross-cut client and server protocol surfaces and gate inbound requests before internal components handle them.
This component diagram provides a high-level architecture view of how A2A-based collaboration is organized in practice. Instead of focusing on individual payload fields, it shows the major runtime building blocks and the boundaries between them: the user-facing side, the client agent side, the remote A2A server side, protocol bindings, and security controls.
The user interacts with a client agent, which uses A2A client/binding logic to discover and call remote agents. On the server side, the remote agent exposes an Agent Card endpoint for discovery, an A2A API surface for operations, and internal services for task management, artifact handling, and status/update delivery. The diagram also makes explicit that transport bindings (JSON-RPC, HTTP/REST, gRPC) are implementation choices beneath the same protocol semantics, and that authentication/authorization sits across the communication boundary rather than inside one object.
AuthN/AuthZ and Policy/ACLs are not separate protocol peers that bypass the A2A API Surface. They represent cross-cutting enforcement on the request path — typically at the transport/binding edge (TLS, tokens, mTLS) and at the API entry point before work reaches the task manager, agent runtime, or artifact store. In practice that may be an API gateway, reverse proxy, or middleware in front of both the Agent Card endpoint and the operations surface (SendMessage, GetTask, and so on). The dashed lines mean “wraps / governs,” not “calls directly instead of S2.”
Its primary value of this A2A architecture diagram is that it acts as a system design map. For readers new to A2A, it clarifies what the protocol is responsible for and what remains an implementation concern. For developers, it provides a clean decomposition for code structure: one area for discovery and card handling, one for operation handlers, one for task state and lifecycle, one for artifact storage, one for update delivery, and one for security integration.
In short, the component diagram helps translate A2A from “spec concepts” into concrete service modules and interfaces you can implement.
Agent2Agent UML diagram: A detailed class and object model
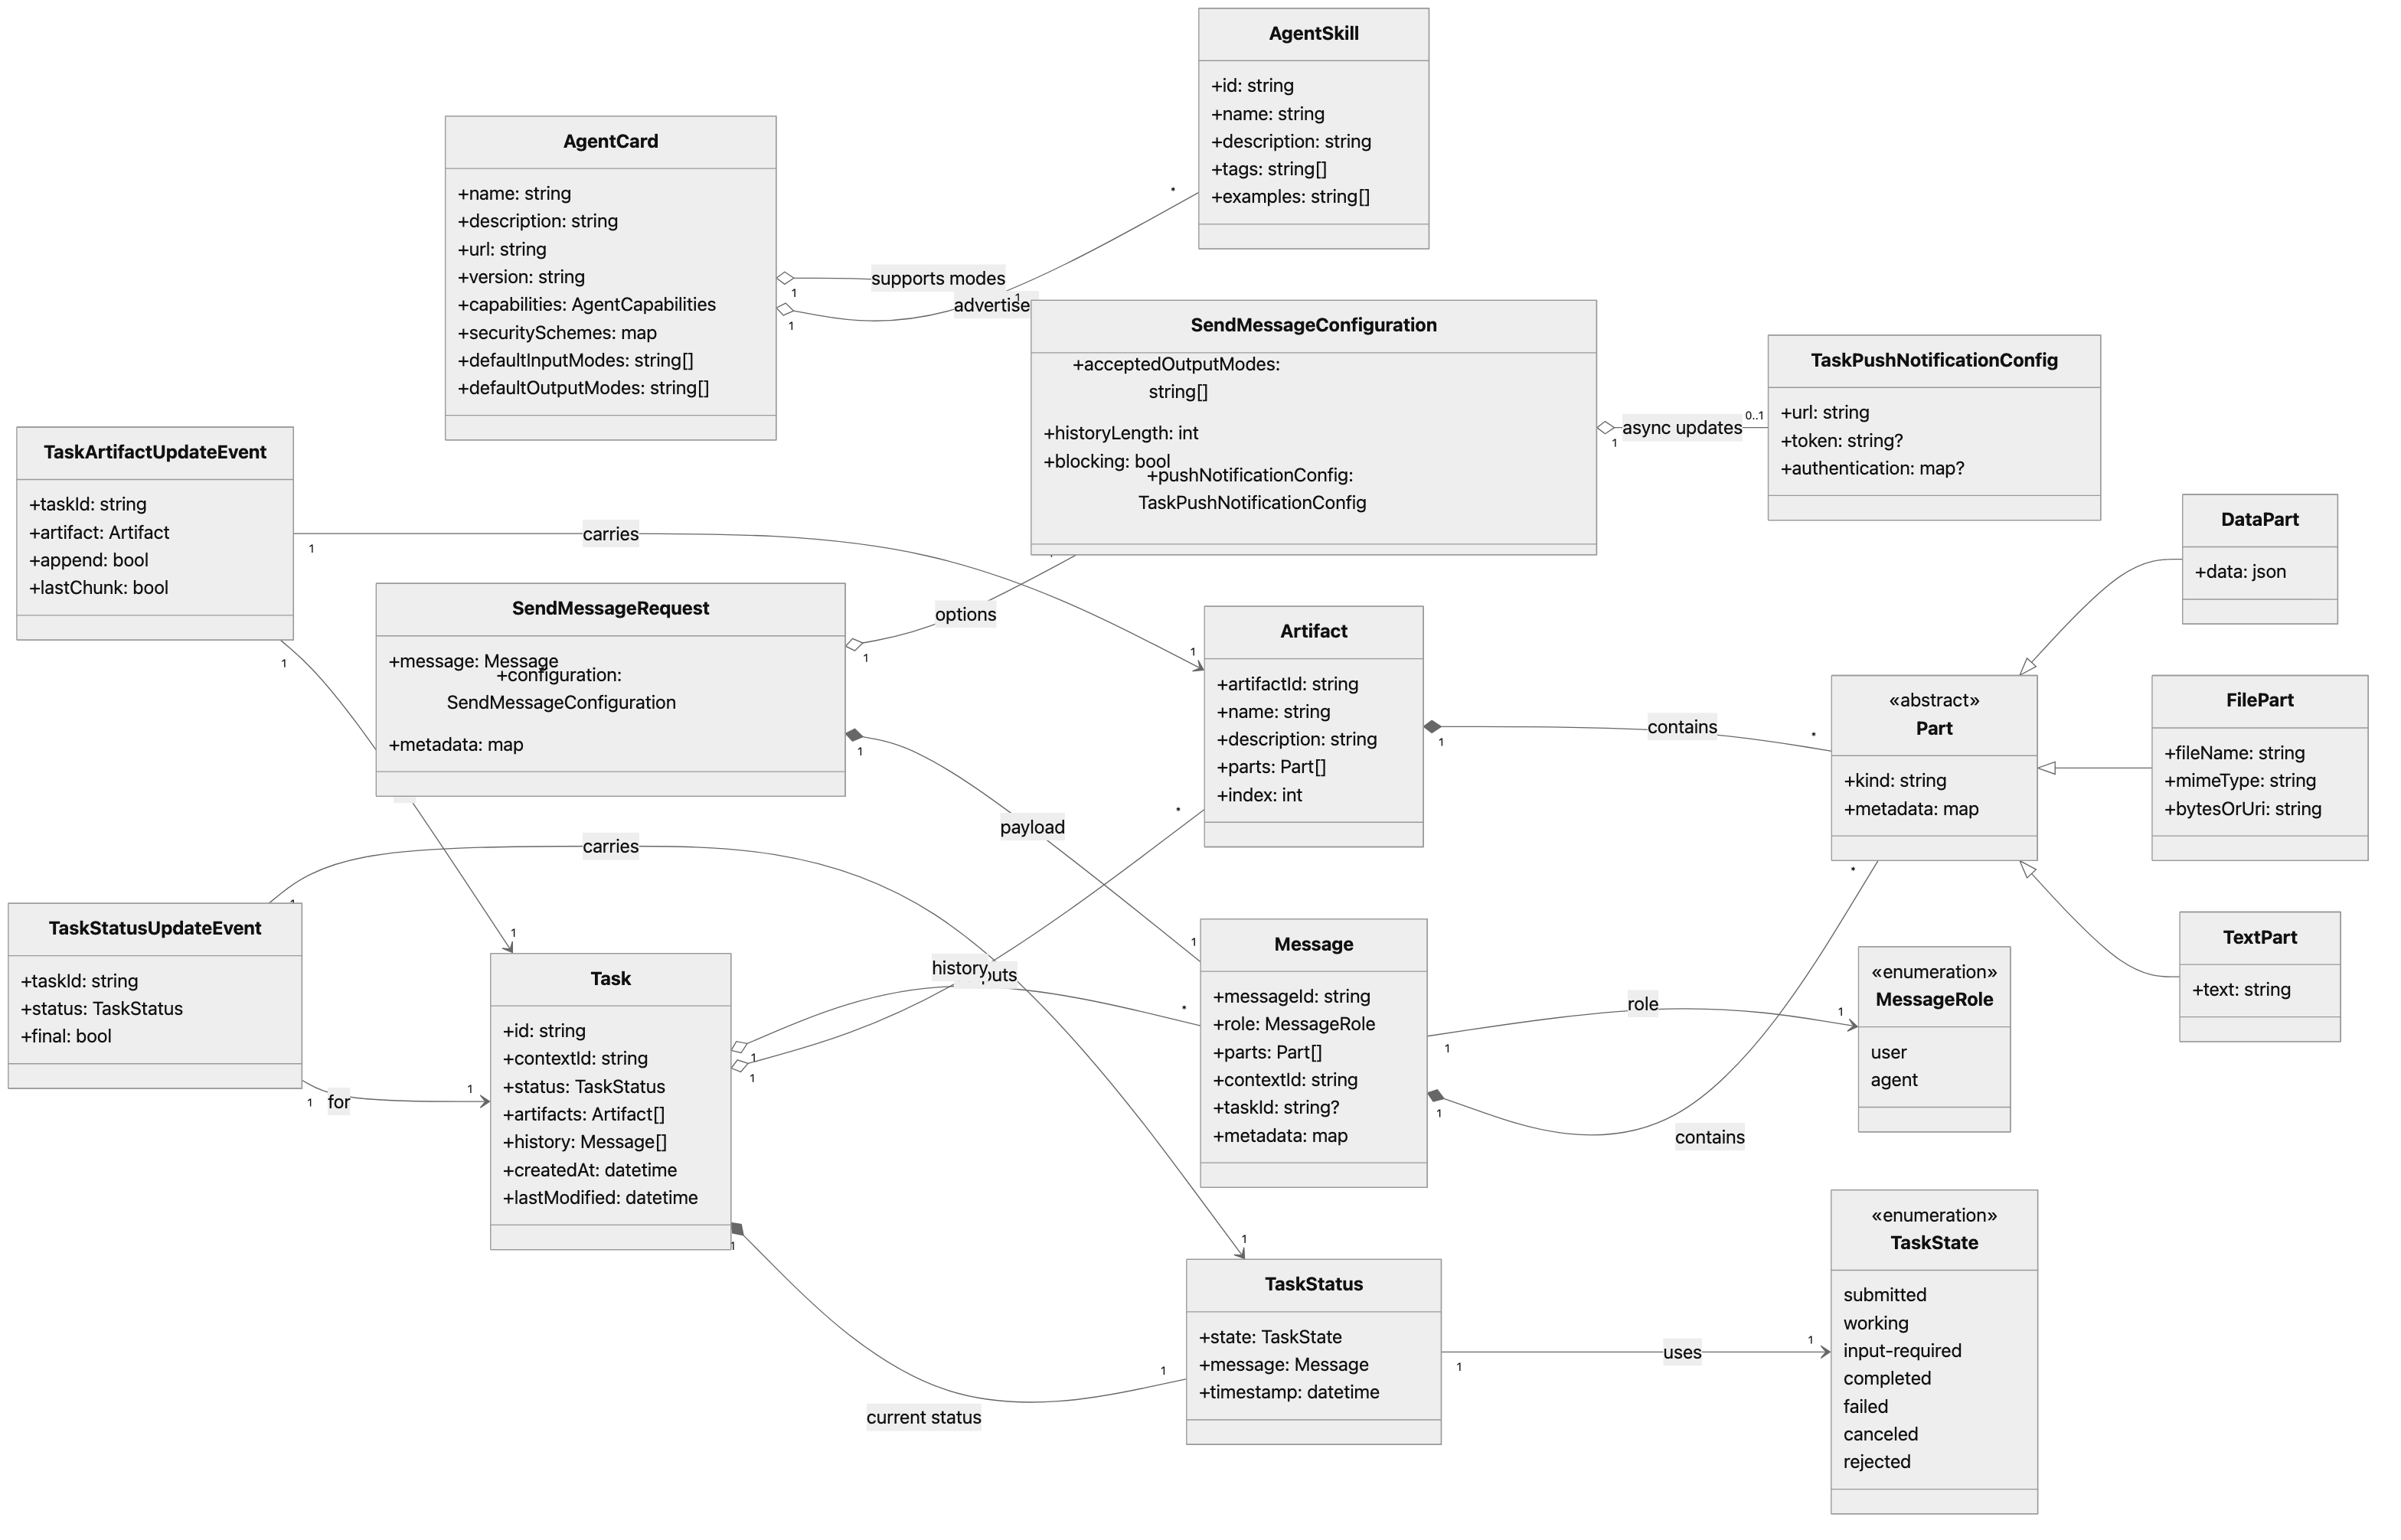
Figure 2: UML class diagram of A2A entities showing how tasks contain message history and artifacts, and how parts compose messages and artifacts.
This detailed, spec complete A2A class/object model diagram presents A2A as a UML-style model that emphasizes how the core protocol entities fit together, rather than treating them as isolated API payloads. It captures the relationships among AgentCard, Task, TaskStatus, Message, the Part hierarchy, Artifact, update events, and send configuration objects.
Read it left to right, and focus on the composition and association links, because those show ownership and cardinality. Messages and artifacts both contain parts; tasks retain both message history and generated artifacts, and event objects reference the task, status, or artifact they describe. The diagram makes it easier to see where data is created, where it is attached, and how it evolves over time.
Conceptually, this helps explain A2A as a coherent object graph, not just a list of methods such as send, get, and cancel. For developers, the diagram is a strong starting point for class design, DTO design, schema mapping, and serialization contracts when implementing code.
Simplified A2A class/object diagram
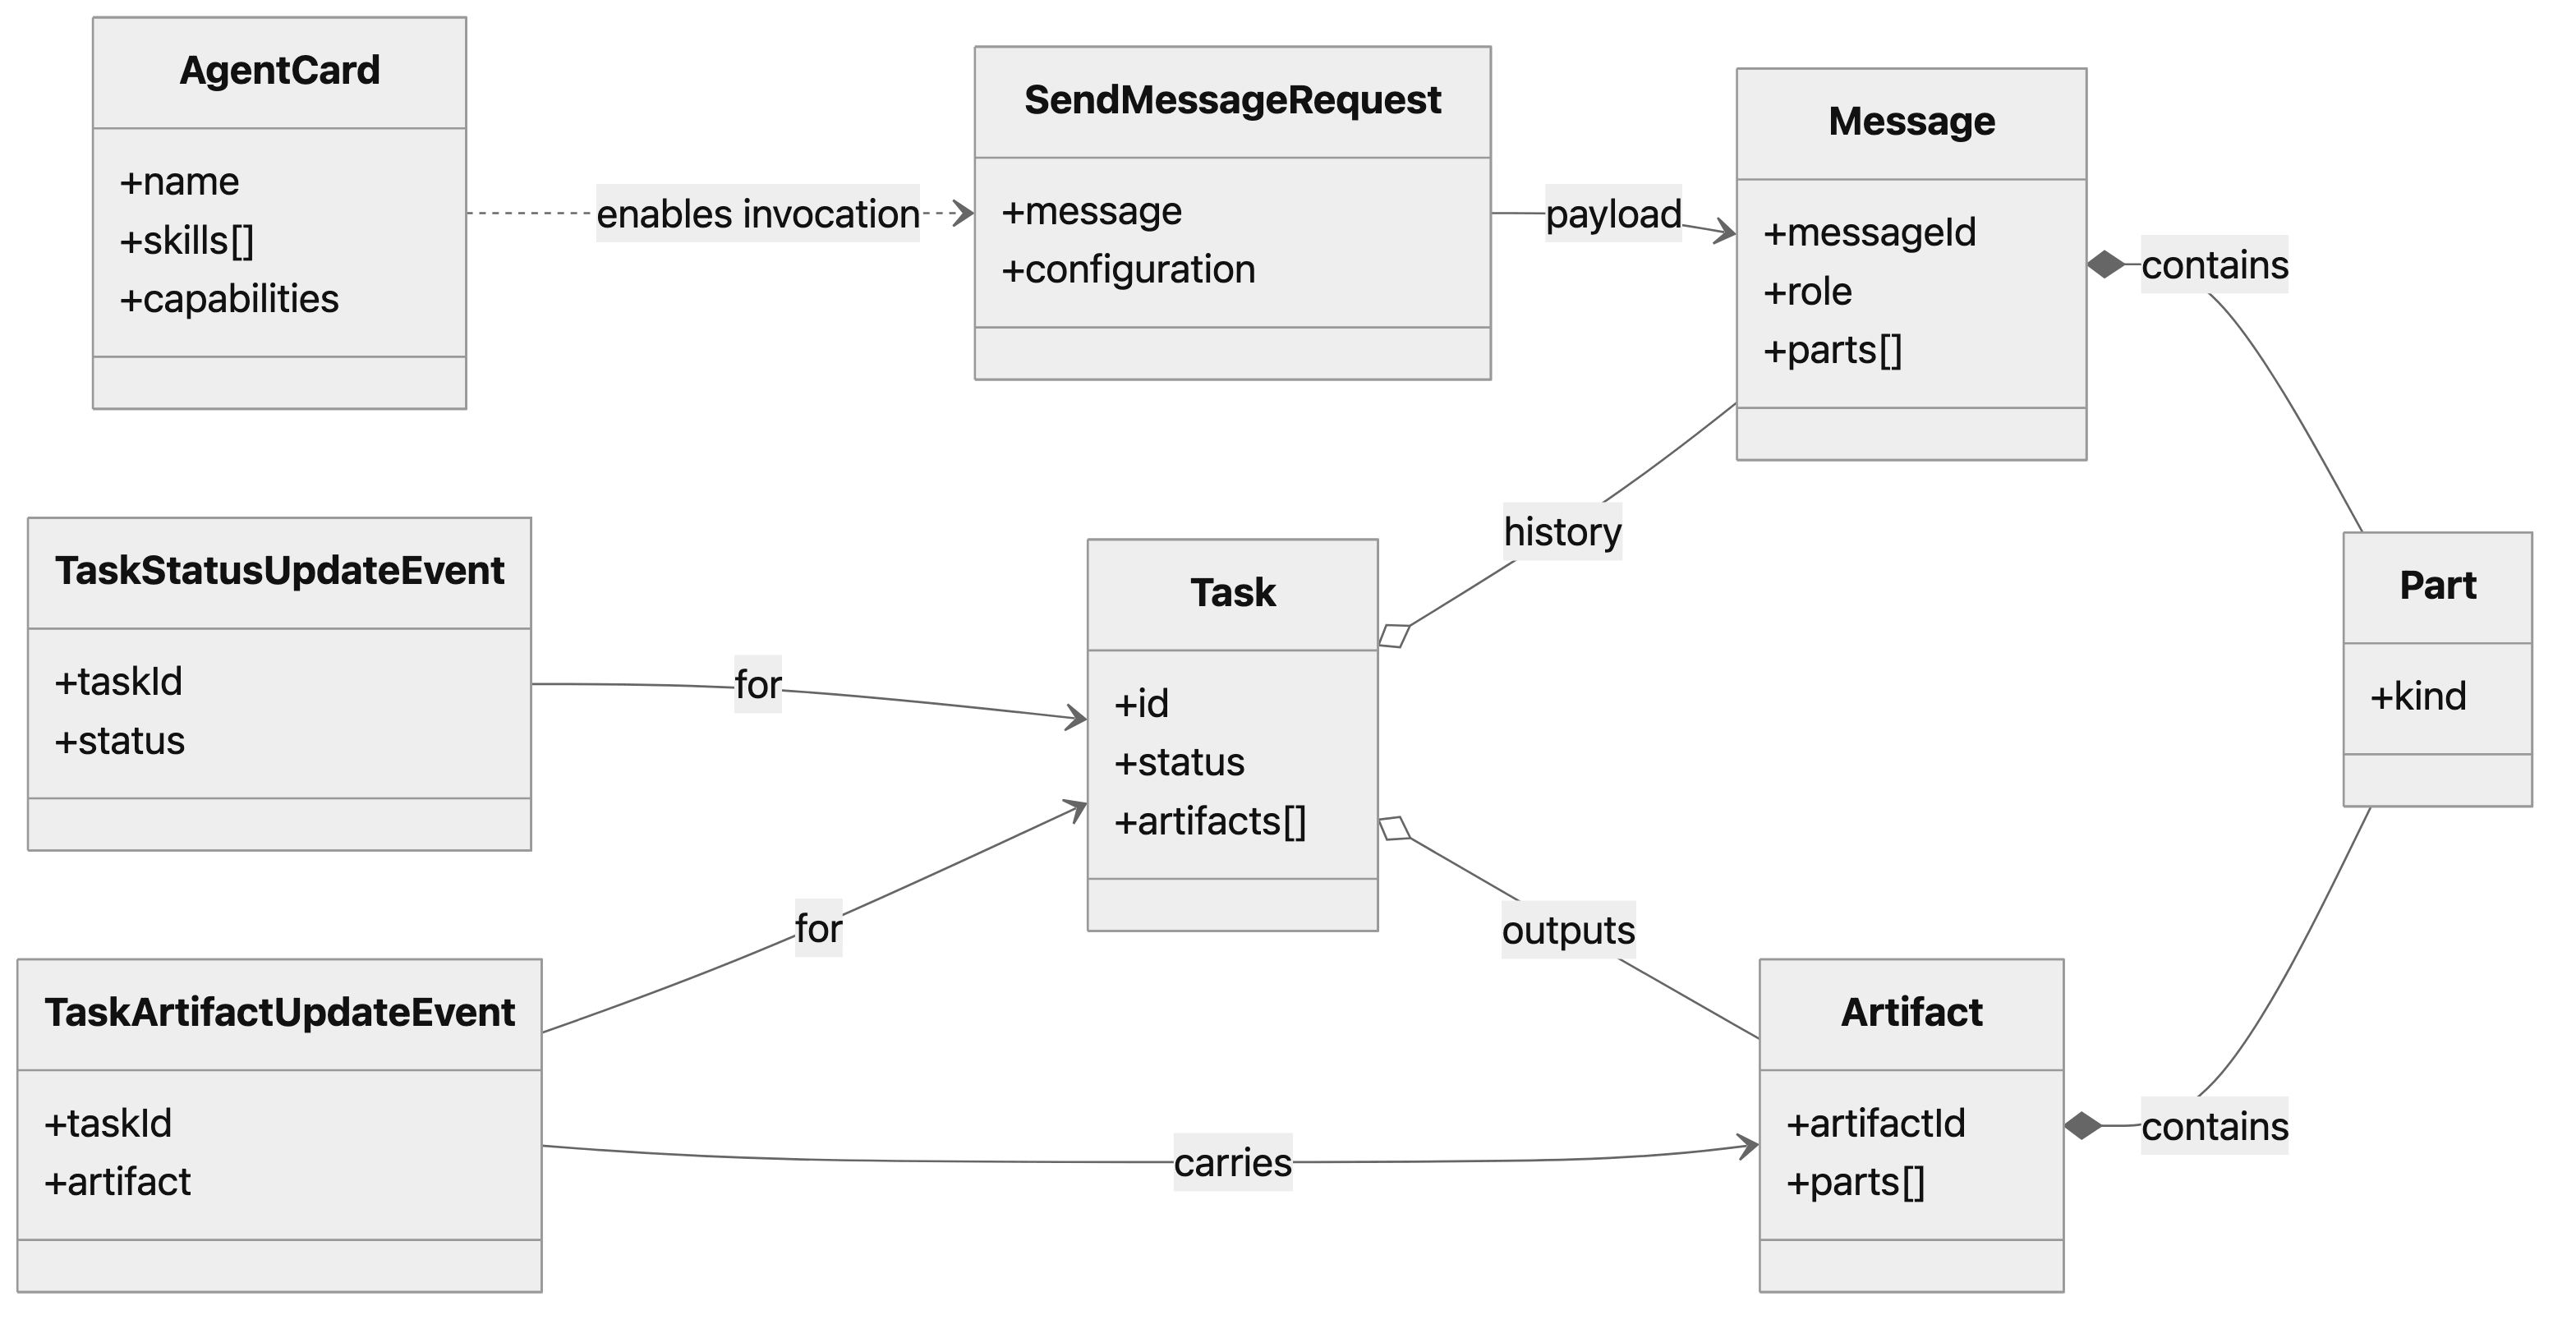
Figure 3: Simplified diagram of A2A core objects: Agent Card enables invocation; messages and artifacts are built from parts; tasks hold history and outputs.
Did you find the above diagram a bit too complicated? If so, this simplified version focuses on AgentCard, Message, Task, Artifact and Part.
This version is more approachable because it highlights the main relationships that matter for understanding how A2A works:
- The Agent Card enables invocation.
- A SendMessage request carries a message and configuration.
- A Message contains parts.
- A Task holds message history and outputs.
- An Artifact contains parts.
- Task update events describe changes to task status or artifacts.
This simplified diagram is not intended to replace the complete protocol model, but it can help readers build a practical mental model before returning to the more detailed version.
But where do Clients and Agents fit in? Another diagram type will show who sends what to whom!
A2A runtime sequence diagram: How Agent2Agent protocol behaves
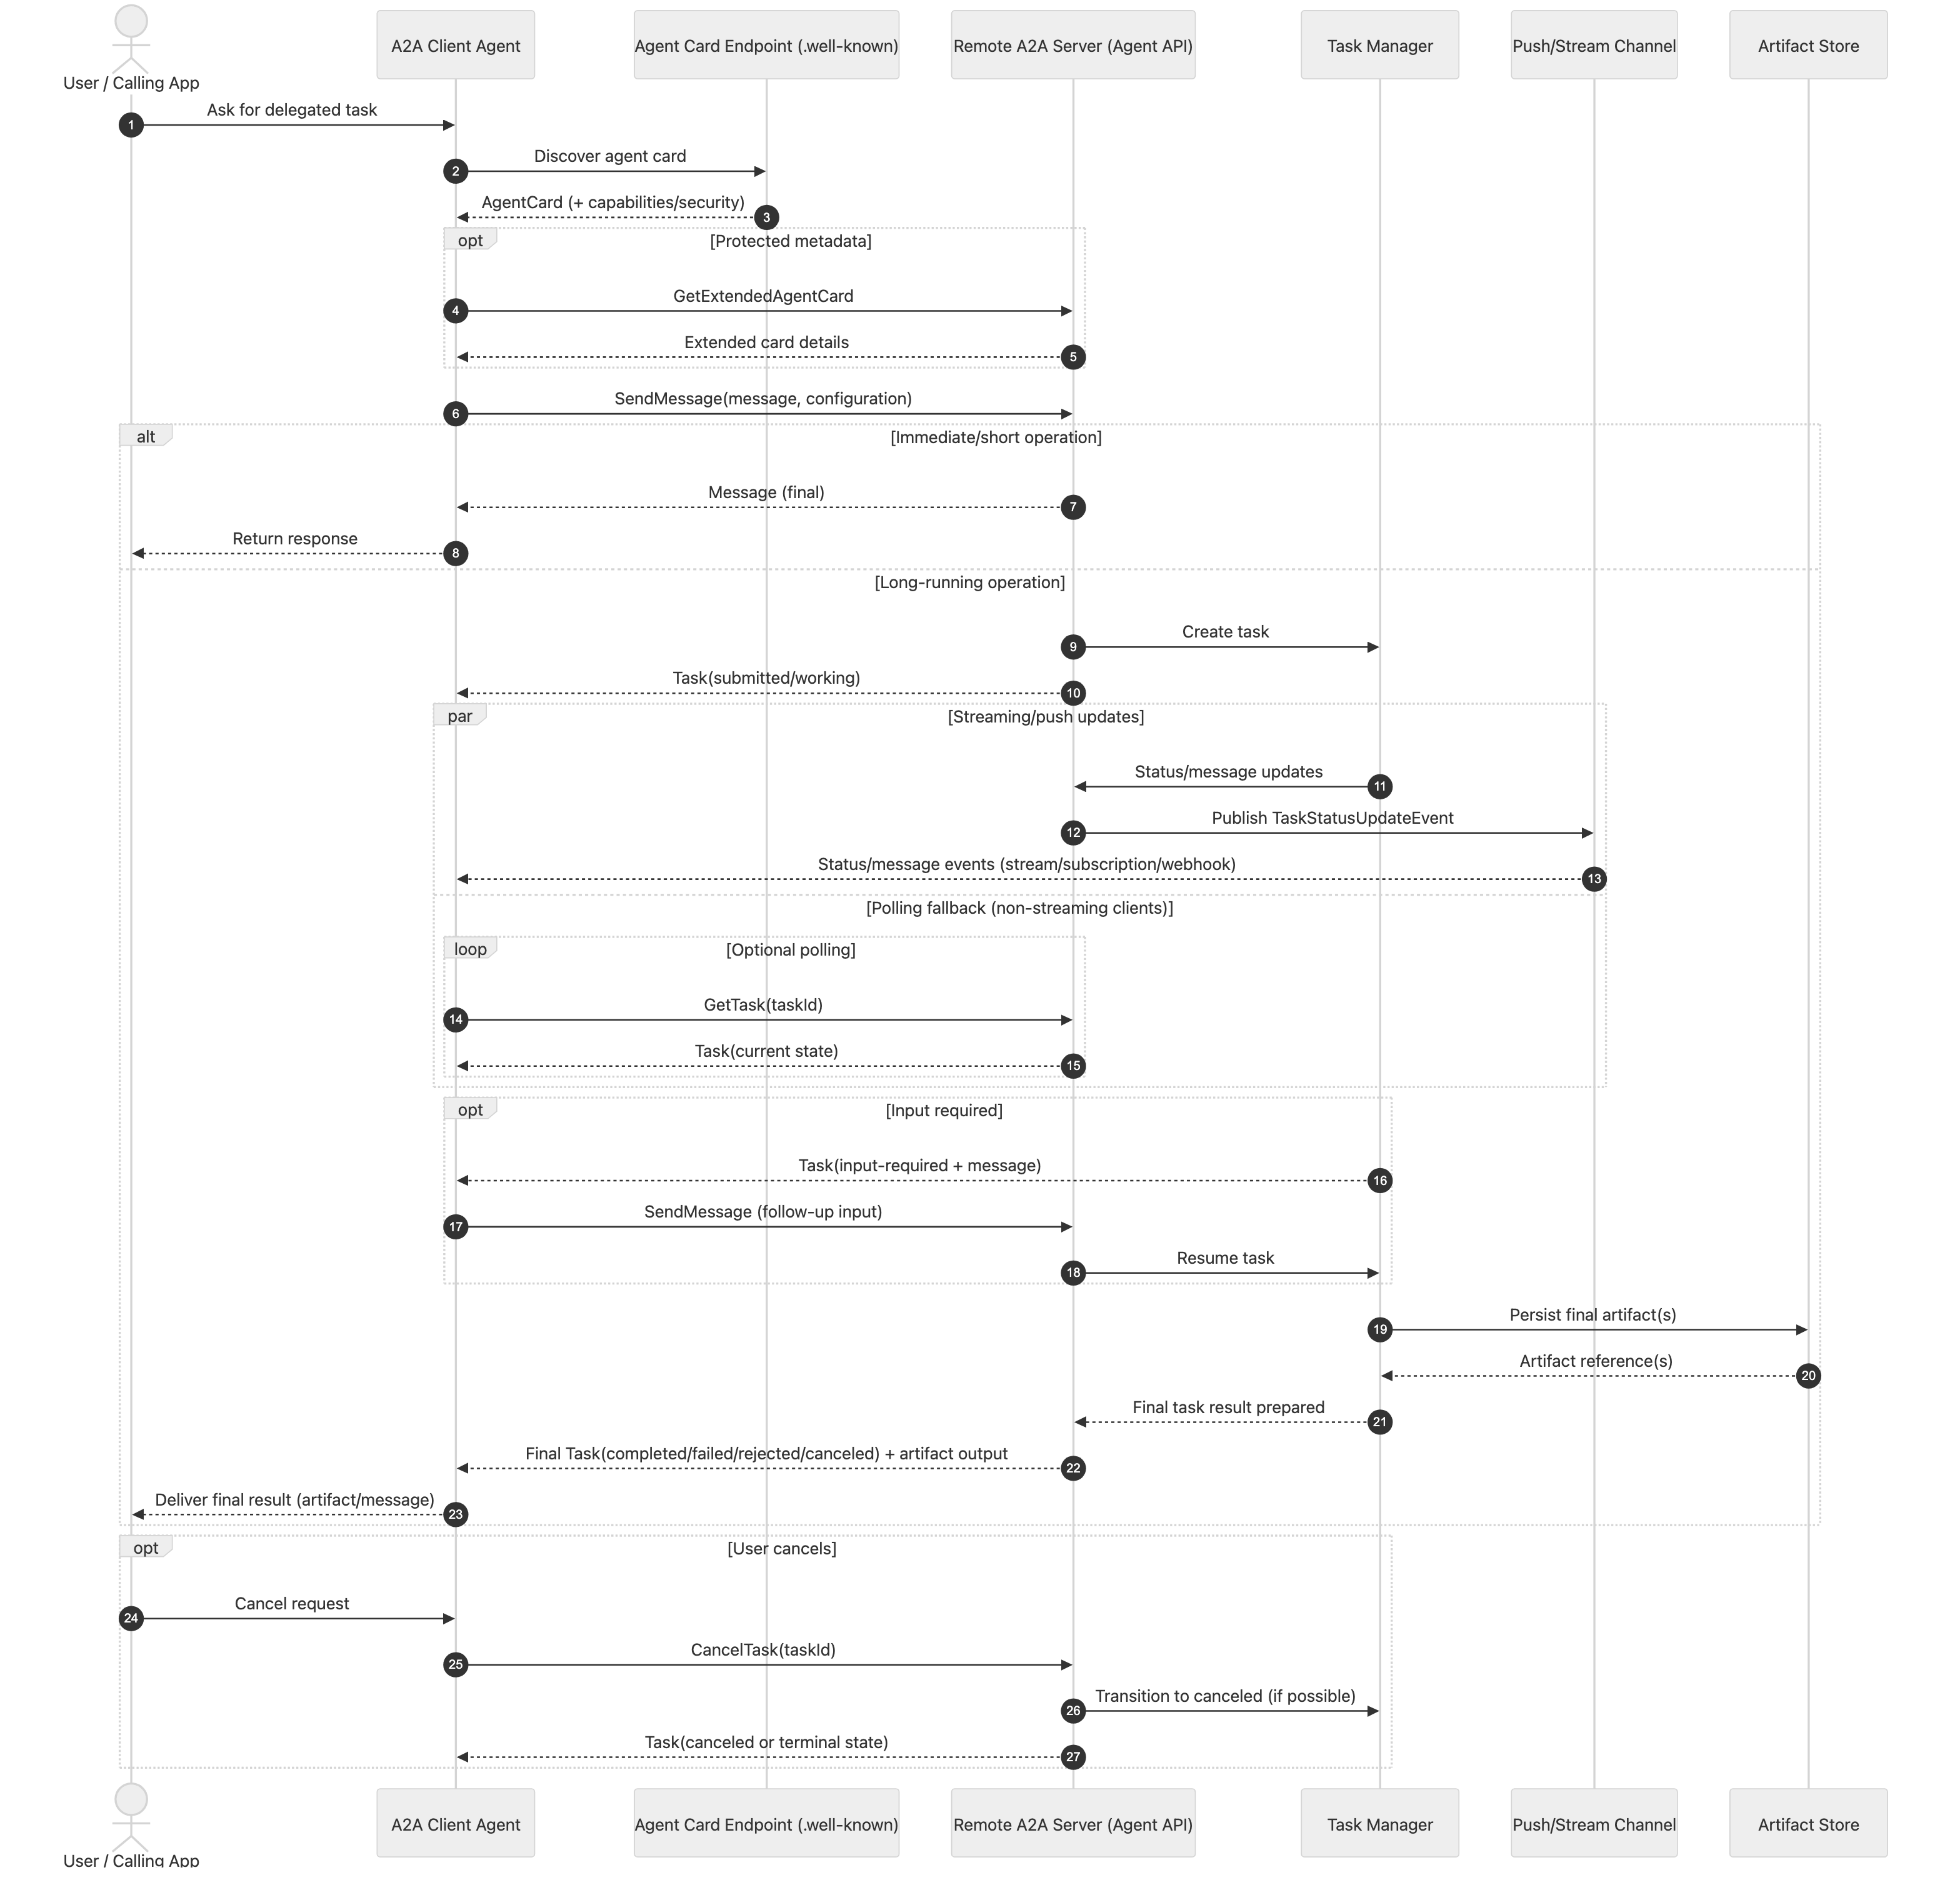
Figure 4: Sequence diagram of A2A from discovery through SendMessage, task updates, optional polling or streaming, and final artifact delivery on task completion.
The A2A runtime sequence diagram shows the complete lifecycle of an A2A interaction from a developer’s point of view, including where final artifacts are actually returned.
The sequence starts with discovery (Agent Card), then a SendMessage call, and branches into two valid behaviors: an immediate response path for short operations, or a task-based path for long-running work. In the task path, the server creates and advances task state, emits status/message updates, and finally returns a terminal task response that carries the artifact output.
The diagram is useful because it removes a common ambiguity: in A2A, artifacts are not “magic side effects”; they are part of the final task result contract. Intermediate updates communicate progress and context, while the terminal response communicates completion and deliverable output. It also makes clear that polling and streaming are delivery strategies around the same task semantics, not different business workflows.
For developers, the A2A runtime sequence diagram is practical implementation guidance. It lines up with baseline handler design (SendMessage, GetTask, CancelTask). It also shows how clients should branch between an immediate Message vs task tracking.
The main task states you will see on the main paths (submitted, working, input-required, and terminal outcomes such as completed, failed, canceled, and rejected). It does not show every TaskState — see the lifecycle diagram for auth-required (a second interrupted state, often resolved out-of-band) and treat unknown as an indeterminate status to handle defensively.
For testing, define scenarios per branch, verify transitions against the state diagram, and assert artifacts on completed tasks where outputs are expected. In short, it is architecture documentation and a scenario checklist — not a substitute for the full operation list in the specification.
A2A task lifecycle diagram: Valid task states and transitions
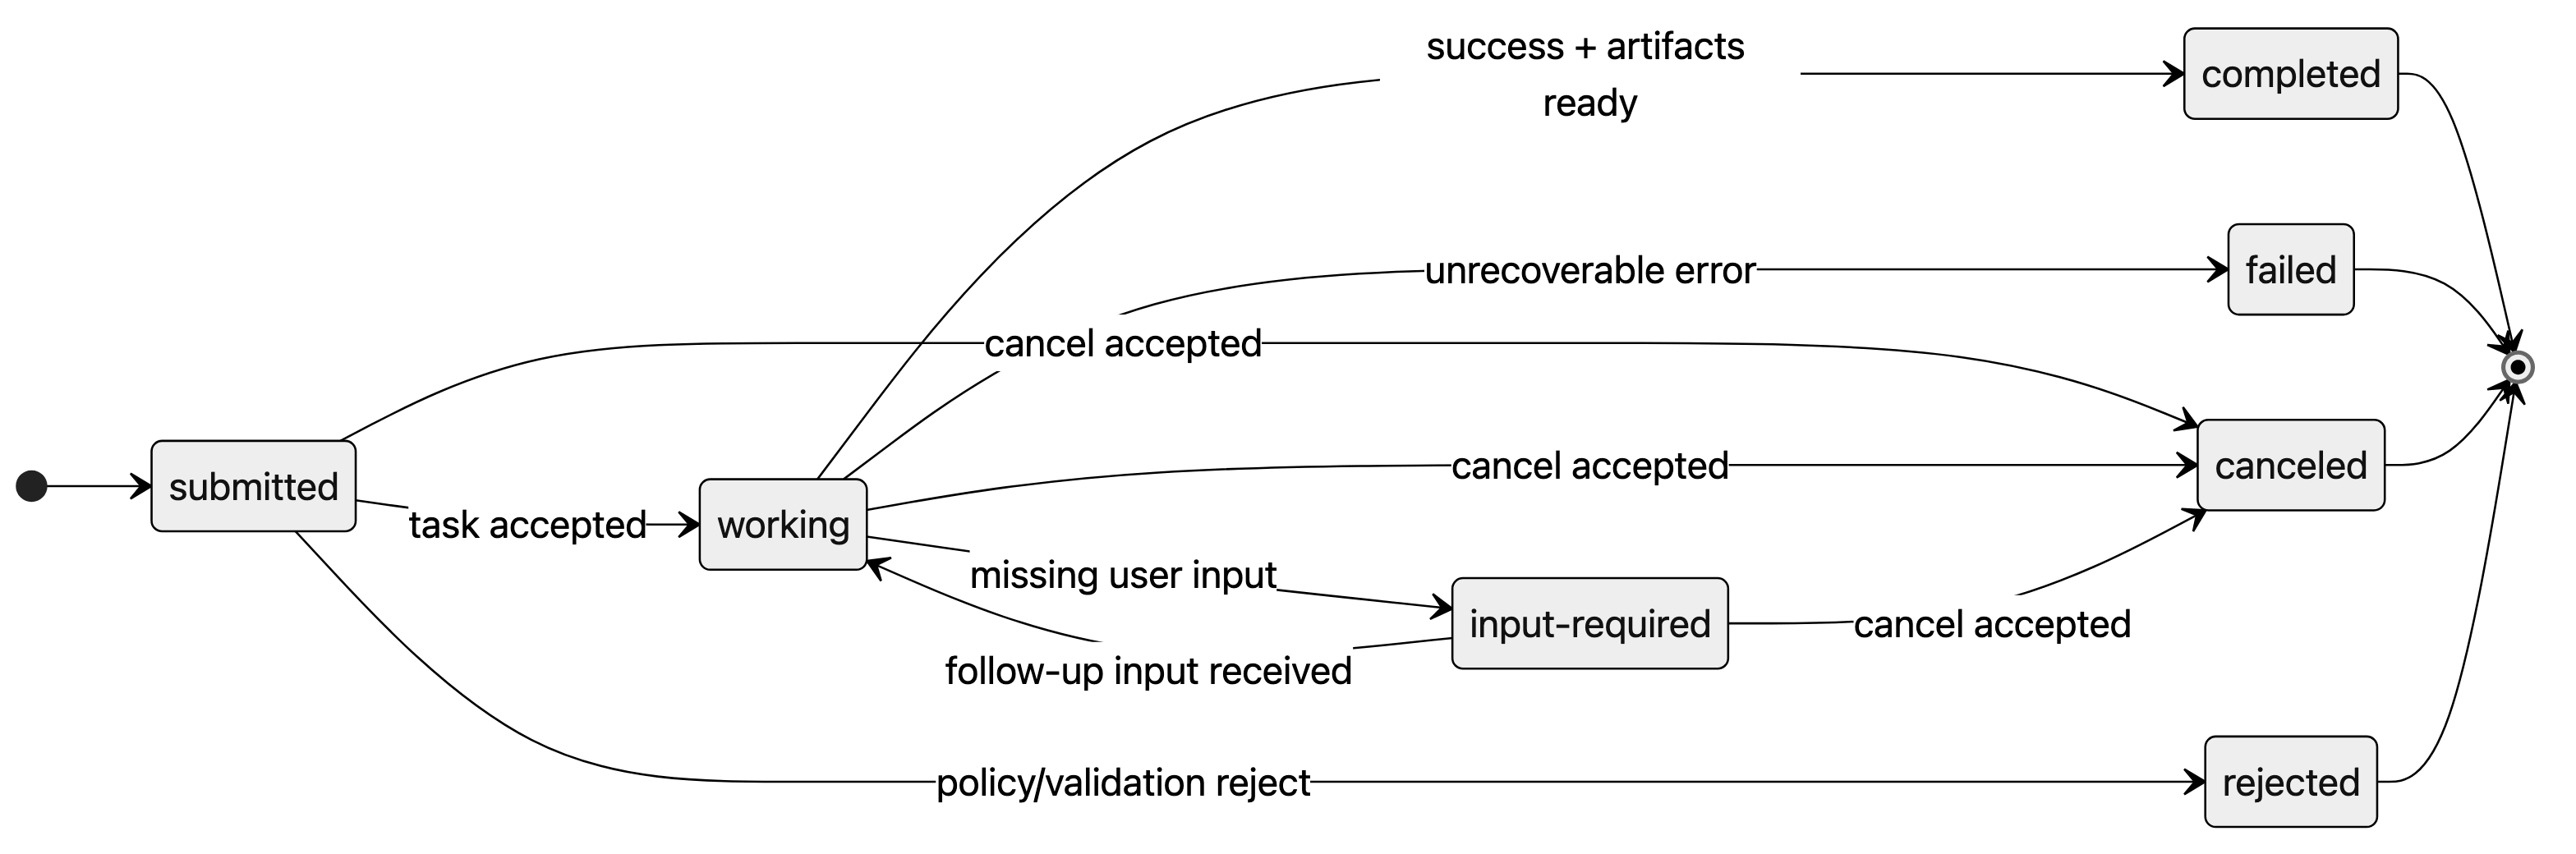
Figure 5: State diagram showing A2A task states from submitted through working and input-required to terminal completed, failed, cancelled, or rejected.
The A2A task lifecycle state diagram explains the legal progression of a task over time and gives each state a clear semantic role. A task begins in submitted, moves to working once accepted, may transition to input-required when more information is needed, and can return to working after follow-up input is provided. From there, it ends in one of the terminal states: completed, failed, cancelled, or rejected.
Two states can interrupt progress:
- input-required, where the client sends follow-up input via SendMessage
- auth-required, where the client must supply authorization (often out-of-band)
After the interruption is resolved, the task may then resume while the client polls or keeps a stream open, without necessarily sending another message. The terminal states are completed, failed, canceled, and rejected. The unknown state indicates an indeterminate status. Clients should tolerate it, but you do not design primary flows around it.
What makes this diagram especially helpful is that it separates interaction flow from state correctness. Sequence diagrams show who calls whom; the state diagram shows what states are valid before and after each call.
That distinction is important, because many implementation bugs come from illegal transitions (for example, treating input-required as terminal, or skipping directly to completed without proper working-state progression).
For developers, the state diagram is a practical contract for code and tests. It guides enum design, transition guards, and task persistence logic. It also helps define robust client behavior: how to react to input-required, when to stop polling, and what to do with each terminal outcome.
In production systems, the state diagram becomes a shared reference across backend, client, and observability teams. It helps ensure everyone interprets task status consistently and handles failure/cancel/reject paths intentionally rather than as edge cases.
How to use Agent2Agent protocol diagrams when designing multi-agent systems
Use the four diagrams as complementary views of the same Agent2Agent protocol model:
- Component diagrams for module boundaries
- Object model diagrams for DTOs, schema mapping, and serialization contracts
- Sequence for runtime behavior and request flow
- State diagrams for legal transitions
The critical A2A contract is SendMessage returns Message or Task; artifacts live on Task, delivered progressively via updates and consolidated at terminal states.
Build polling and lifecycle handling first. Then add streaming and push once the state model is solid. Treat these AI-assisted diagrams as a working map, not a normative specification. Always cross-check against the spec and real request/response traces.
Before opening a campaign, Napoleon pored over sketches of the ground with his cartographer Bacler d’Albe, pins on the map, measuring distances until the terrain was fixed in his mind. Treat these diagrams as sketches, a working map, not normative specifications; they will help you see the terrain before the march, while you can still change the plan, then implement and verify against the real protocol as you go.
Recap: Where A2A diagrams fit in scalable agent systems
So, where are we in our “campaign” now?
Parts 1–3 move from why we scale agent systems (and how that relates to Kafka), through A2A’s object model to runtime behavior: discovery, SendMessage, task tracking, and where event streaming fits behind the specification.
This part visualises that stack. It uses Agent2Agent protocol diagrams to show A2A architecture, object relationships, runtime sequences, and task lifecycle states.
Future posts will add runnable code examples and Kafka-backed production patterns.
Scaling agent systems eventually needs durable events, state, search and gateways — workloads Instaclustr already operates as managed Kafka, OpenSearch, PostgreSQL, Cassandra, ClickHouse, Cadence, and a new MCP gateway.
A2A defines agent hand-offs, managed data infrastructure carries the load once those hand-offs run at enterprise scale.