In the previous blog (Anomalia Machina 5 – Application Monitoring with Prometheus) we explored how to better understand an Open Source system using Prometheus for distributed metrics monitoring. In this blog we have a look at another way of increasing visibility into a system using OpenTracing for distributed tracing.
1. A History of Tracing
Over a hundred years ago one of the first automated duplicating machines was invented, the Mimeoscope. It was a light table which allowed operators to make quick copies of pictures by tracing them.
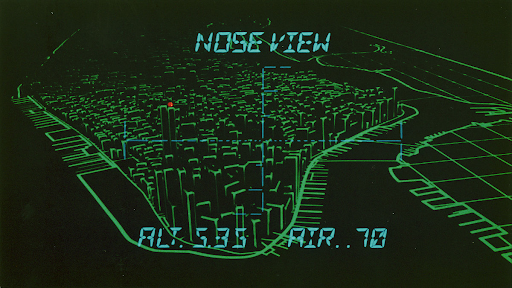
Move forward 80 years (to 1981) for another example of the power of tracing. Sometimes even a simple trace is enough to convey meaning. This outline city skyline is immediately recognisable (And for extra points, the movie?)

You’ve been given a mission to fly into an “abandoned” city that’s been turned into a maximum security penal colony (with no guards inside, just the worst criminals, all with a one way ticket), in a glider, at night.
Is a “tracing” of the city sky line going to be sufficient for you to navigate to a safe landing, rescue the president, and escape (all within 24 hours when you’ll explode!?) Evidently, if you believe the cult movie “Escape From New York” (1981), it is.
The wire-frame “tracing” computer graphics on the display screens in the glider were not actually computer-generated. Computer animation was so expensive in the early 1980s that they “simulated” it!
To make the film’s wire-frame “computer” animation of Manhattan, they built a model of the (futuristic, it was supposed to be 1997) city and lined the buildings’ edges with glow-in-the-dark tape, filmed under UV light, and moved a camera through the model city. So, basically a fake computer animation, of a model, of a future version of an actual city!
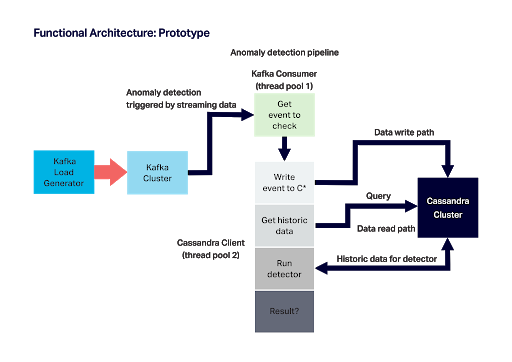
Fast forward again the present day. We want to increase observability into our distributed Anomalia Machina system. Here’s the pipeline we’ll be using showing the main components including Kafka load generator, Kafka, Kafka consumer, and detector pipeline which writes and reads data to/from Cassandra and runs the algorithm:
In the previous blog we used Prometheus to collect metrics including latency and throughput from each stage of the pipeline. Metrics are useful, but don’t tell the complete story.
In particular, they are typically aggregations of metrics, and don’t have context (e.g. dependency and order information) or the ability to drill down to single events. This is where distributed tracing comes into play.
The paper “Principled workflow-centric tracing of distributed systems” identifies some use cases for distributed tracing including:
- Anomaly detection (identifying anomalous workflows)
- Diagnosing steady-state problems
- Service Level Objectives (SLOs)
- Distributed profiling
- Resource attribution
- Workload modeling.
This list isn’t complete, they missed out performance modelling (what you get when you combine profiling with resource attribution and workload modelling), and architecture discovery and modelling (APM vendors have different names for this e.g. service dependency maps, application topology discovery etc.).
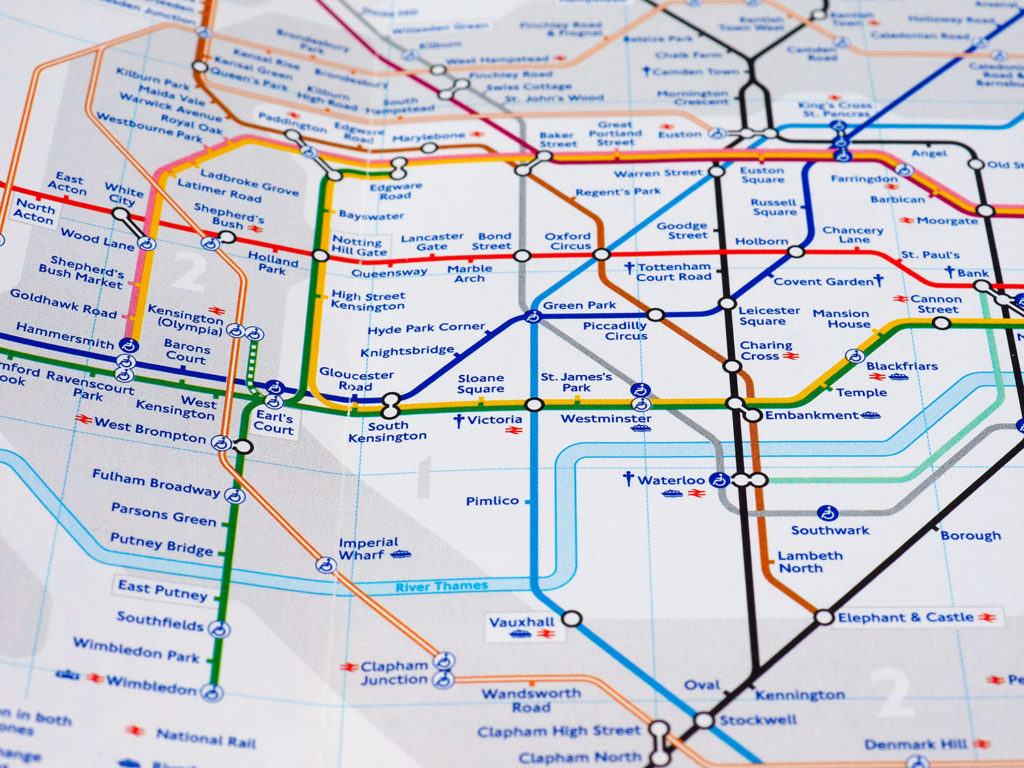
Topology maps (which are also used for systems other than just software, such as the famous London underground map) are particularly informative as they abstract away unnecessary details of a system to reveal only the important information (e.g. that there are animals hiding on the underground!)
In this blog we’re going to explore how to go about adding distributed tracing to Anomalia Machina using OpenTracing. We may not find a hiding Hound, but we will hopefully learn something interesting about distributed tracing.
2. What is OpenTracing?
“OpenTracing provides an open, vendor-neutral standard API for describing distributed transactions, specifically causality, semantics and timing.”
The most important thing to understand about OpenTracing is that’s a specification, not an implementation. To make it work you need (1) application instrumentation and (2) an OpenTracing compatible tracer. Here’s a list of the supported tracers. Many are open source, and a few are commercial APM tools (including DataDog, and possibly Dynatrace in the future).
The specification is a language-independent and vendor-neutral specification of the semantics required to enable distributed tracing. It consists of a Data Model, an API, and semantic conventions.
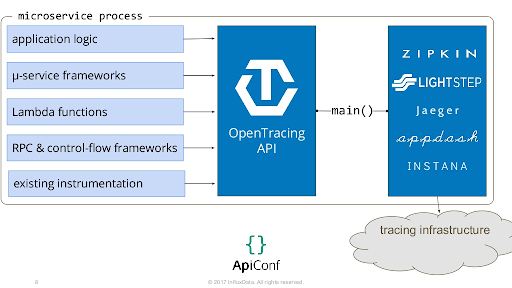
You use the API to instrument your code, but then you need to pick a tracer implementation to actually generate the traces, collect them, and visualise them. This diagram shows the high-level relationship between the traced applications (on the left), the API (in the middle), and the tracer implementations (on the right).
The core concept in OpenTracing is (oddly enough) Spans (rather than Traces):
“Spans are logical units of work in a distributed system, and they all have a name, a start time, and a duration. Spans are associated with the distributed system component that generated them.” (i.e. they are associated with the tracer instance that produced them).
A simple way of illustrating spans is with Bridges. The simplest bridge (e.g. the Sydney Harbour Bridge, the “Coathanger”) has a single span.

Another important concept is relationships:
“Relationships are the connections between Spans. A Span may reference zero or more other Spans that are causally related. These connections between Spans help describe the semantics of the running system, as well as the critical path for latency-sensitive (distributed) transactions.”
OpenTracing defines two types of references: ChildOf and FollowsFrom. ChildOf is for synchronous dependencies where a result is typically returned from the child to the parent. FollowsFrom is for asynchronous relationships where the parent does not wait for the child.
So what about Traces? After some investigation it appears that Traces are actually just 1 or more spans that are related:
“Traces in OpenTracing are defined implicitly by their Spans. In particular, a Trace can be thought of as a directed acyclic graph (DAG) of Spans, where the edges between Spans are References.”
Logically a span with no parent is the first (or only) span (source node) in a trace, and spans with no other spans referencing them are sink nodes.
Some bridges have multiple spans, so a journey from one side to the other can be viewed as a multi-span trace.

The Millau Viaduct in France (above) has 8 spans. Each journey across the viaduct is a trace.
3. Tracing Anomalia Machina
On the application side you have to instrument your code to produce spans. See the guides for the language specific clients available and how to use them. Alternatively, you can use a contributed library which adds OpenTracing instrumentation to target frameworks. For cross process tracing you need to use a 3rd party library to inject/extract context across process boundaries. At last count there are 87 contributions including libraries for Spring, Elasticsearch, JDBC, Cassandra, and Kafka!
This documentation explains how to use the API to record traces for Java. The simplest way of creating new spans is to use the default scope manager. If there is a Scope, by default it will act as the parent to any newly started Span.
However, as the default relationship is CHILD_OF, and you also can’t pass a Scope across threads, I decided to use spans explicitly and create new spans manually with an explicit relationship to the parent span. Here’s some example code that mimics the Anomalia Machine pipeline and produces spans.
public class BlogTest {

		// Single tracer demo
		static Tracer tracer = initTracer("BlogTest");
		public static void main(String[] args)
		{
			int numTraces = 10;

			for (int i=0; i < numTraces; i++)
			{
				// simulate a trace consisting of producer, consumer, and detector asynchronous spans
				Span span1 = tracer.buildSpan("producer").start();
				producer();
				span1.finish();
				Span span2 = tracer.buildSpan("consumer").addReference(References.FOLLOWS_FROM, span1.context()).start();
				consumer();
				span2.finish();
				detector(span2);
			}
		}

		public static void producer()
		{
			try {
				Thread.sleep(1 + (long)(Math.random()*10));
			} catch (InterruptedException e) {
			}
		}

		public static void consumer()
		{
			try {
				Thread.sleep(1 + (long)(Math.random()*10));
			} catch (InterruptedException e) {
			}
		}

		public static void detector(Span parent)
		{
			// the detector span has the consumer as parent, and is asynchronous
			Span spanDetector = tracer.buildSpan("detector").addReference(References.FOLLOWS_FROM, parent.context()).start();
			// the detector span has 3 synchronous, i.e. CHILD_OF, spans.
			Span spanWrite = tracer.buildSpan("cassandraWrite").addReference(References.CHILD_OF, spanDetector.context()).start();
			cassandraWrite();
			spanWrite.finish();
			Span spanRead = tracer.buildSpan("cassandraRead").addReference(References.CHILD_OF, spanDetector.context()).start();
			cassandraRead();
			spanRead.finish();
			Span spanAnomalyDetector = tracer.buildSpan("anomalyDetector").addReference(References.CHILD_OF, spanDetector.context()).start();
			anomalyDetector();
			spanAnomalyDetector.finish();
			spanDetector.finish();
		}

		public static void cassandraWrite()
		{
			try {
				Thread.sleep(1 + (long)(Math.random()*10));
			} catch (InterruptedException e) {
			}
		}

		public static void cassandraRead()
		{
			try {
				Thread.sleep(1 + (long)(Math.random()*100));
			} catch (InterruptedException e) {
			}
		}

		public static void anomalyDetector()
		{
			try {
				Thread.sleep(5 + (long)(Math.random()*20));
			} catch (InterruptedException e) {
			}
		}

	    public static JaegerTracer initTracer(String service) {
	        SamplerConfiguration samplerConfig = SamplerConfiguration.fromEnv().withType("const").withParam(1);
	        ReporterConfiguration reporterConfig = ReporterConfiguration.fromEnv().withLogSpans(true);
	        Configuration config = new Configuration(service).withSampler(samplerConfig).withReporter(reporterConfig);
	        return config.getTracer();
	    }
	}
Note that if you actually want to use the spans outside the process, you have to create a tracer using an actual tracer implementation (although there is a MockTracer API for testing). I picked Jaeger (but also tried Zipkin, they are similar in practice). Documentation on instantiating a Jaeger Tracer is here and here.
Tracers can have different architectures. Here’s the architecture of Jaeger. Jaeger is a distributed tracing system with a number of components.
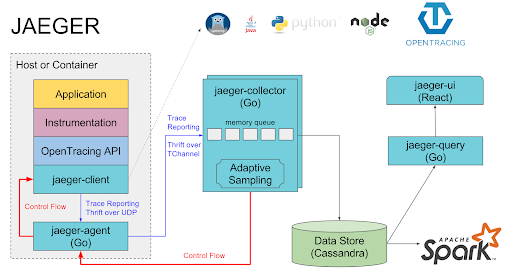
Jaeger should scale well in a production environment due to using Cassandra for a scalable data/query store, and Spark for dependency analysis. However, for testing there’s a simple all-in-one executable with in memory only storage that I used (just remember that it doesn’t remember traces when you restart it).
It’s interesting to note that there is a bi-directional flow between the jaeger-agent and the jaeger-client which provides an important feedback loop (e.g. for adaptive sampling), but which also makes it harder to use Kafka for span transport.
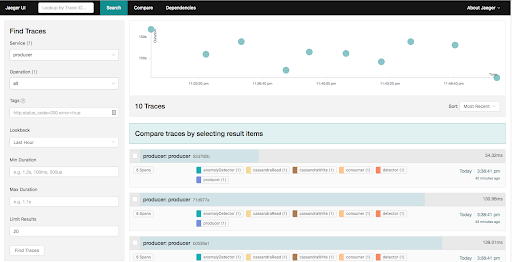
Once you’ve got everything working you can start Jaeger, run the instrumented code, and then see what’s happened in the Jaeger GUI (https://localhost:16686/search). You can select traces by Service name, operation, etc and filter by other parameters and then Find. You can select a trace from the results or on the timeline graph for more detail.
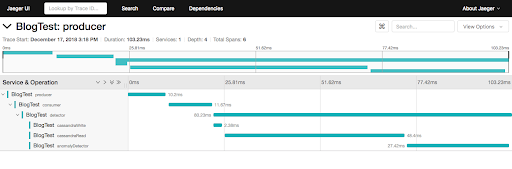
Viewing a single trace gives insights into the total trace time, and the relationships and times of the spans. For this example the trace has 3 asynchronous spans: producer, consumer, and detector, and the detector span has 3 synchronous children: CassandraWrite, CassandraRead and AnomalyDetector.
Jaeger also has tabs to Compare 2 traces, or view Dependencies. In theory this was supposed to build a dependency map from all the traces in memory (i.e. doesn’t depend on the search results), but it was initially just blank.
I wondered if there was some configuration change required, or if I needed to run Spark to process the traces (Spark is used for production deployments). It turns out that (a) Jaeger only shows dependencies between spans produced by different services (i.e. tracers), and (b) only shows dependencies between synchronous (CHILD_OF) nodes.
This took some time to debug as you need both tricks in place for it work. After enhancing the above code example with multiple tracers (one tracer per span), and using CHILD_OF instead of FOLLOWS_FROM, we get multi-coloured traces:
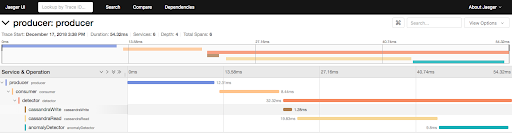
And the dependencies view is now populated:
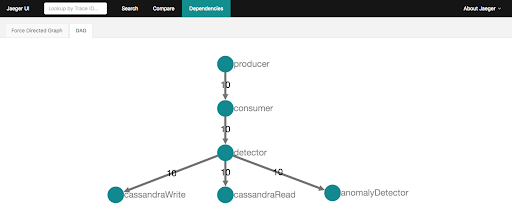
This is what we were hoping for, as is correctly shows the expected topology of the workflow, along with the number of spans observed.
Unfortunately there’s not much added information on this graph. Ideally there would be throughputs and average response times.
Also the graph is computed from all the traces in memory, so you can’t select (e.g. a time window) or filter (e.g. a transaction type) a subset of traces. For more complex graphs it’s also useful to be able to aggregate or expand sub-graphs.
4. Tracing Across Process Boundaries (Kafka Producer to Consumers)
So far all we demonstrated with OpenTracing is that we can produce a trace within a process, but there are lots of other tools that can do that. We can also view the traces remotely from the application that produced them.
For large scale distributed systems, what we really need is a way of tracing applications across boundaries: process, machine, and clouds.
How can this be done? You need a way of finding the causal relationship between spans.
One approach is use Big Data approaches to analyse the separate spans and infer the relationships between them, e.g. The Mystery Machine does this by forming theories about relationships and then trying to disprove them from the empirical data. Another approach is to inject metadata into the cross-process call flows in order to provide sufficient context to build traces across heterogeneous systems.
In Facebook, Canopy is the successor to the Mystery Machine and takes this approach by propagating TraceIDs across process boundaries. This is also the approach taken by OpenTracing. Implementations need to provide a way to inject and extract a spanContext across process boundaries. How they do this will depend on the protocol involved.
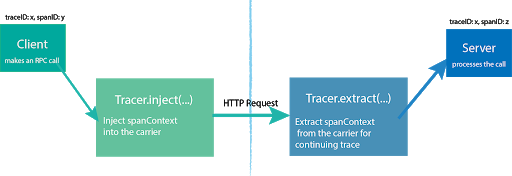
Fortuitously, someone else has already developed a solution for OpenTracing Kafka clients. On the Kafka producer side, it automatically inserts a span context into the Kafka headers. You just have to add a interceptor to the Kafka producer properties like this:
// Register tracer with GlobalTracer:

GlobalTracer.register(tracer);


// Add TracingProducerInterceptor to sender properties:

senderProps.put(ProducerConfig.INTERCEPTOR_CLASSES_CONFIG,

          TracingProducerInterceptor.class.getName());


// Instantiate KafkaProducer

KafkaProducer<Integer, String> producer = new KafkaProducer<>(senderProps);


// Send

producer.send(...);
On the Kafka consumer side, once you have got a single ConsumerRecord (record) to process, you extract the span context and create a new FOLLOWS_FROM span like this (I couldn’t get the helper function, TracingKafkaUtils.extractSpanContext() to work correctly – it kept returning a null context even though on inspection the Kafka headers appeared to have correct span context data):
SpanContext spanContext = tracer.extract(Format.Builtin.TEXT_MAP, new MyHeadersMapExtractAdapter(record.headers(), false));
newSpan = tracer.buildSpan("consumer").addReference(References.FOLLOWS_FROM, spanContext).start();
But note that as FOLLOWS_FROM won’t produce a dependency map, you need to use CHILD_OF instead.
5. More Interesting Kafka Example
The Anomalia Machina pipeline is relatively simple, so I wondered how well OpenTracing would work for discovering and visualising more complex Kafka topologies. For example, would it be possible to visualize the topology of data flow across many Kafka topics?
I wrote a simple Markov chain simulator which allows you to choose the number of source topics, intermediate topics, and sink topics, and a graph density, and then produces random traces. The code is in this gist.
Here’s the dependency graph for a run of this code:
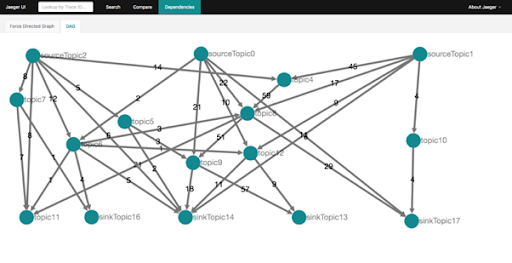
In practice you would also want to add information about the Kafka producers and consumers (either as extra nodes, or by labelling the edges). There’s also a cool Force directed graph view which allows you to select a node and highlight the dependent nodes.
6. Further Resources
OpenTracing isn’t the only open tracing player. OpenCensus is an alternative. How do they compare?
The approach of having to instrument your code manually is time consuming, and fragile if the APIs change. Another approach is agent based (e.g. which most of the mainstream APM products, such as Dynatrace which uses bytecode injection). It looks like OpenCensus also has a Java agent.
You can’t swap tracers for different parts of the system, as the protocol is tracer implementation specific (c.f. OpenCensus).
There’s also a W3C trace context effort.
Alibaba cloud supports OpenTracing.
Some other useful OpenTracing resources are here and here.
This is a good comparison of Zipkin and Jaeger.
You may wonder if you really need both Prometheus and OpenTracing to monitor an application?
In theory the OpenTracing spans actually have all of the information needed for monitoring application metrics (e.g. throughput and latency).
So why not just collect spans once and use for multiple purposes including monitoring? Well, this is exactly what most commercial APMs do. And in theory (and possibly practice, I tried early on but didn’t exactly get it working) it’s possible to get OpenTracing data into Prometheus.