Why we built it
NetApp Instaclustr is constantly monitoring the health of all clusters on the platform and alerts the Instaclustr Support team as potential issues arise. However, it is reassuring to review the state of your cluster health, so Instaclustr provides access to hundreds of metrics within the console for each managed cluster. Even though this is a curated set of the most important metrics, interpreting these can be daunting and time consuming if you’re not steeped in each technology’s nuances.
The new AI Cluster Health Summary on the Instaclustr Console is designed to give you a concise, transparent reading of recent cluster state—the what and the why—so you can understand the health of any NetApp Instaclustr technology. In this blog, we will walk through the details of how we implemented this feature so you can apply them to your AI application development.
Encoding SRE know-how into the model
We started by collaborating with our senior TechOps Engineers (our Site Reliability Engineers) to produce reference reports across under-provisioned, over-provisioned, and “just right” clusters. These reports captured the signals SREs weigh when forming an opinion on health, including how node-level anomalies roll up to cluster-level conclusions. Rather than hardcoding global thresholds, we used these references as a qualitative prompt and validated the LLM’s judgments against them as we iterated.
Architecture at a glance
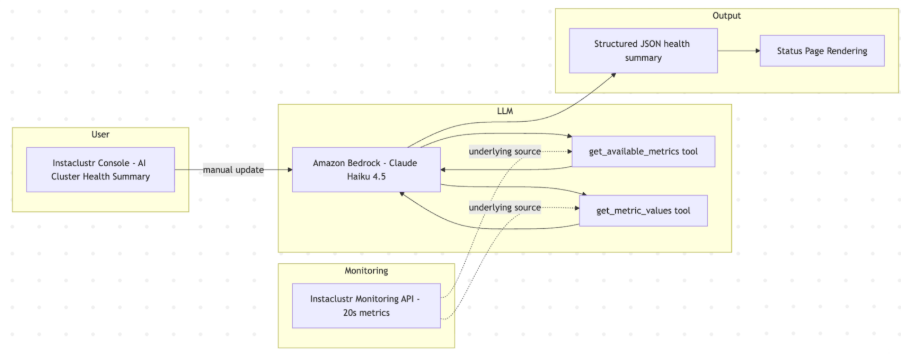
Our design is intentionally minimal and largely independent of the model or LLM environment used. However, we need to make a choice for our implementation and after some experimentations, we chose Claude Haiku 4.5 via Amazon Bedrock for fast, cost-effective synthesis. To make the information from our monitoring API available to Bedrock, we expose two retrieval tools developed using the Bedrock SDKs: get_available_metrics and get_metric_values.
Users trigger the analysis manually from the AI Cluster Health Summary page on the Instaclustr Console. The model will use these tools to first get the available metrics for the type of cluster it is analyzing, then choose a subset of per-node time-series metrics, synthesizes notes and a health score, returning a structured JSON object that drives the UI.
Tools and data
We expose a very small tool surface, so the model stays focused:
- Get_available_metrics: Enumerates the metrics available for the selected cluster. Many metrics are specific to the technology running on the cluster, for example consumer metrics on a Kafka cluster or replication lag on a replicated PostgreSQL cluster. This endpoint provides the model with a list of available metrics plus a plain English description of each metric. This description summarizes the Instaclustr team’s knowledge of the meaning of these metrics
- Get_metric_values: Retrieves per-node time series for the last three hours for the chosen metrics. The LLM can chose multiple metrics to retrieve data from in a single call. Metrics flow raw from the Monitoring API; we don’t preprocess or normalize units before handing them to the model. This ensures the AI sees exactly what you see in the console and aligns with how our SREs evaluate signals.
While specific metrics and signal interpretations differ between, say, Kafka, Cassandra, and OpenSearch, the data flow and output schema remain the same, which makes the system simple to operate and extend.
The tools are bound by the session to only provide data for the cluster currently being monitored. While we allow the LLM to specify a cluster, this is to give us future flexibility to compare clusters against each other.
Orchestration and guardrails
Our prompting is deliberately simple and scoped. We instruct the model to:
- Use the tools to explore current cluster state.
- Evaluate metric patterns and summarize health, including per-node anomalies where relevant.
- Return a structured JSON object conforming to a schema contract.
Given the very structured output request, and the detailed descriptions of metrics returned by the tool, the final prompt we feed to the LLM is remarkably simple:
|
1 2 3 |
ContentBlock.fromText("Please provide a metrics-based health assessment of a managed " + clusterBundle + " cluster with id " + cluster.id + " to a customer. Do not suggest actions. Respond with raw JSON using the following schema:"), |
We add explicit guardrails: the model evaluates state and possible implications but does not prescribe actions. You won’t see “add nodes,” “tune heap,” or similar recommendations. This helps avoid overreach and keep operational decisions in the hands of experts and existing support processes.
Structured returns and schema
We use a compact JSON schema to standardize outputs. Notably, Haiku on Bedrock doesn’t officially support structured returns, but in practice we’ve received consistent, schema-conformant responses. The schema we instruct the model to produce is:
|
1 2 3 4 5 6 7 8 9 10 11 12 13 14 15 16 17 18 19 20 21 22 23 24 25 |
{ "type": "json_schema", "schema": { "type": "object", "properties": { "summary": { "type": "string", "description": "Overall summary of the cluster health" }, "keyPoints": { "type": "array", "description": "List of key points", "items": { "type": "object", "properties": { "text": { "type": "string" }, "classification": { "enum": ["ok", "warning", "critical"] } } } } }, "required": ["summary", "keyPoints"], "additionalProperties": false } } |
A representative output looks like this:
|
1 2 3 4 5 6 7 8 9 10 11 12 13 14 15 16 17 |
{ "summary": "Cluster health is generally stable over the last 3 hours. Most nodes show consistent throughput and latency, with one node exhibiting intermittent spikes.", "keyPoints": [ { "text": "Overall read/write latencies remain within typical bounds across most nodes.", "classification": "ok" }, { "text": "Node n-3 shows intermittent GC pauses correlating with elevated 99th percentile read latency.", "classification": "warning" }, { "text": "No sustained disk growth or error rates observed in the window.", "classification": "ok" } ] } |
We map this to the UI as a traffic-light style summary, overall notes, and per-point callouts. The model can highlight specific nodes in keyPoints while keeping the summary cluster centric.
Scoring and updates
Scoring is entirely LLM judgment based on patterns in the last three hours and the SRE-informed prompt. This better accommodates workload diversity than rigid thresholds. Users can manually refresh the AI Cluster Health Summary page to run the analysis, to help ensure you’re in control of when snapshots are taken. For very large clusters, we iteratively ask the LLM to summarize a smaller number of metrics, then take these summaries to the top level LLM to generate the final output. We found that adding all metrics to a single session for a large cluster would over-load the ability of the model to reason through each.
Validation and reliability
We validated outputs with our internal SREs against the reference reports and iterated until the summaries aligned with expert expectations across under-provisioned, overprovisioned, and healthy states. Reliability is supported by:
- A minimal tool surface that only reads metrics (no mutation).
- Guardrails that keep the model within evaluative scope.
- Tolerance of partial data; if a node’s metrics are missing, the model proceeds and notes uncertainty rather than halting.
As always, the Instaclustr platform and support team continues to proactively monitor all metrics and alert you if any may cause a problem. AI Cluster Health Summary complements, not replaces, that monitoring by translating recent signals into a clear, human-readable synopsis.
Why Bedrock and Haiku
The Instaclustr platform control plane primarily runs on AWS, and Bedrock provided the most straightforward path to production with native SDKs, managed access, and no custom hosting. We chose Claude Haiku 4.5 because it’s a capable model with strong price/performance characteristics. Since we’re offering this feature at no additional cost, keeping run-time economical was a design goal from the start, and Haiku’s speed helps deliver snappy, on-demand summaries.
As part of the project, we evaluated the likely effort required to move to a different model or LLM environment. We believe that, given our data foundations are relatively decoupled, minimal effort would be required to switch if desirable.
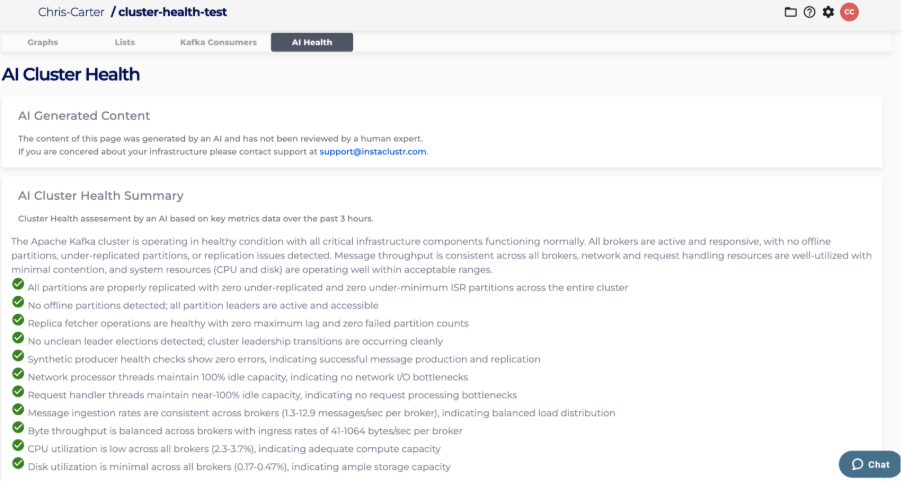
What you’ll see in the console
On the AI Cluster Health page, you’ll see a concise summary, clearly classified key points, and a traffic-light depiction of health derived from the structured output.
What’s next
We’re exploring how to expose metrics directly to customers via MCP so that your LLMs will also have access to the data and perhaps be able to correlate to other data streams across your application. Look for more news on our MCP workflow later this year!
We built AI Cluster Health Summary to turn raw telemetry into clear signals, grounded in SRE expertise and delivered through a simple, robust architecture. It’s a small, focused system that makes interpreting cluster health easier without compromising on the technical truth your operations rely on.
Learn more about AI cluster health in our blog post or start your journey with Instaclustr for FREE today.