NetApp has always helped customers understand their usage of our services, and with our new feature in the Instaclustr Managed Platform we’re taking that to the next level. Customers running in their own account, with many clusters spread over multiple accounts, have previously found it difficult to identify which specific deployments made up which portions of their overall Management Unit consumption. This often required customers to reach out to our Customer Success team to understand their usage between specific applications or engineering teams.
However, with our new usage dashboard available directly in the NetApp Instaclustr console, customers now have a self-service option to view a detailed breakdown of their monthly used Management Units by account and cluster.
Available directly on the console, via API, and exportable as a CSV download, customers on a Run In Your Own Account (RIYOA) pricing plan will now have access to the Management Unit (MU) usage of every cluster, allowing you to aggregate usage data any way you want. Default views on the console will show you your usage and history across different accounts, applications, clusters, or regions, as well as at the organization level.
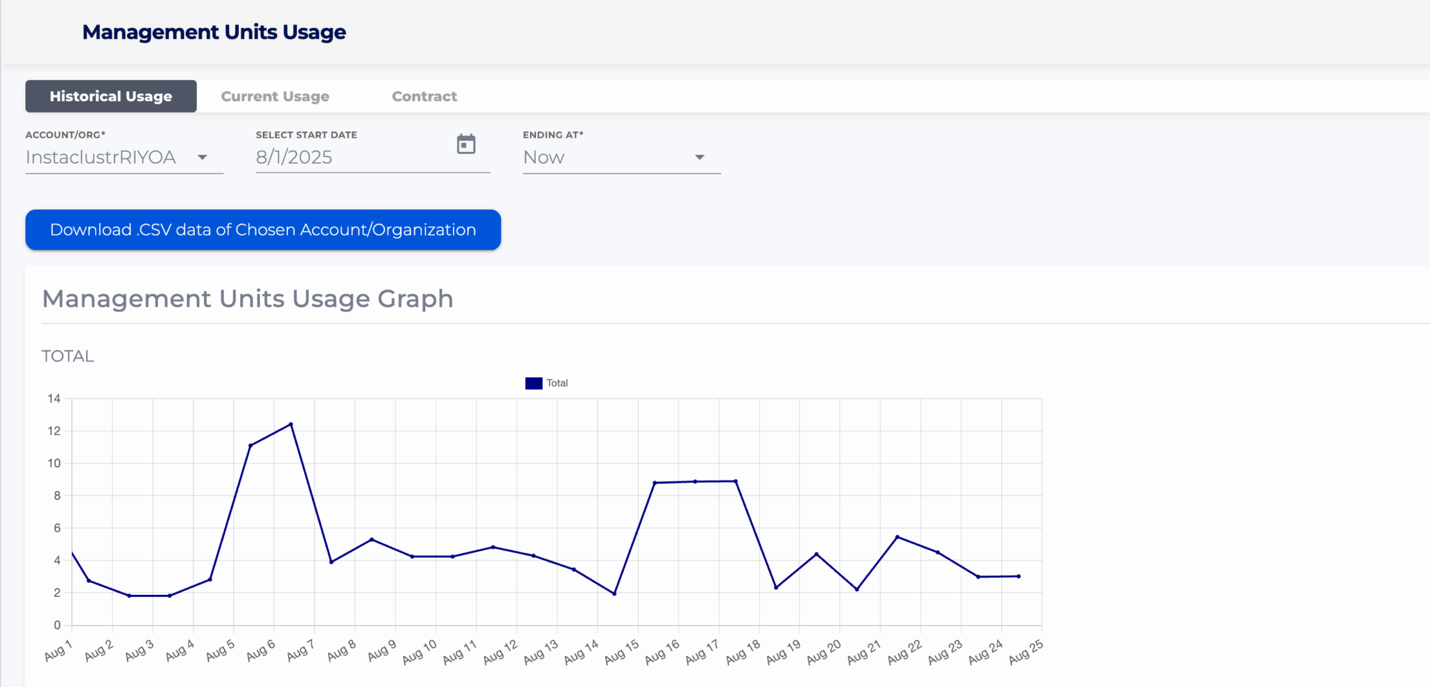
The dashboard also provides a historical view of usage, improving the ability to track and analyze consumption over time. To support various business needs, the data can also be downloaded via API or as a CSV file from the console.
While Management Unit usage information is now available in the console, customers should work with their Customer Success representative to address billing and invoicing questions relating to usage to ensure that all aspects of the contract are considered.
“We understand the importance of clear and accessible usage data for our customers. Our updated dashboard provides a straightforward view of how Management Units are being consumed, helping customers to make better-informed financial decisions. By offering data downloads via API or CSV, we ensure our customers can easily integrate this information into their existing processes.”
— Ben Slater, CPO of Product Management
With the release of this feature customers can expect:
- New “Management Units Usage” self-service dashboard under the directory
- Clear breakdown of Management Unit usage by region, account, cluster, and technology
- Historical usage data for trend analysis and forecasting
- Convenient data export options via API or download of CSV file
- This feature is supported for RIYOA customers on all providers.
All RIYOA customers have access to this information, so log onto the console today to explore your usage. If you have any further questions or want to try a new technology, then please reach out or refer to our support documentation.