Instaclustr’s Managed Kafka is compatible with a wide range of Kafka tools and add-ons. One really interesting, recently released tool we have come across is Operatr. This blog walks through the main functions of Operatr and how to use it with an Instaclustr Managed Kafka cluster.
What is Operatr
Operatr is a tool for viewing key metrics and useful information for operational users of Kafka. This tool will provide you with the following insights and features:
- The overall health of the cluster which can be used by the site reliability or DevOps team.
- Topic Level details such as where partitions are distributed across a cluster along with a chart showing you how data is distributed across those various partitions.
- Key consumer group information such as consumer lag and overall health of the consumers.
- Key performance metrics such a bytes in/out so you can properly manage or plan for scalability with your cluster.
- ACL user interface for easily viewing various access controls on the topic level.
- Integration with metrics tools or frameworks such as Rieman.
- Inspect individual messages in a Kafka Topic.
This tool is for Kafka Data Engineers and Kafka Administrators. While many of the basic and most essential functions of Operatr are available through the Instaclustr Console, it provides many additional features which may be useful to Instaclustr users such as the UI for working with topic ACLs, tools for understanding data distribution by partition and the ability to select and inspect individual messages from Kafka topics.
This article walks you through the process of setting up Operatr with Instaclustr Managed Kafka and some of the key features of the tool.
Why use Operativ.IO with your Kafka cluster
Reason #1 → It takes 30 seconds to get working! Simply download the jar file and configure the environment variables as instructed below which is optimized for our managed cluster.
Reason #2 → Gain total visual awareness of all key Kafka metrics such as Consumer Lag and data usage on partition levels.
Reason #3 → No need to Set up JMX access or Zookeeper access, just connect to Kafka on the default port.
Reason #4 → All your data stays in Kafka internal topics, you never send your data out of the organization.
Setting up Operatr with Instaclustr Managed Kafka
You can download and install Operatr following the instructions on the Operatr website: https://operatr.io/#/install
Step 0: Create a Kafka Cluster
If you have not yet used our platform before, you can easily create a Kafka cluster as follows:
- Login or Signup with instaclustr.com.
- Click create a cluster.
- Select Kafka and the smallest instance type.
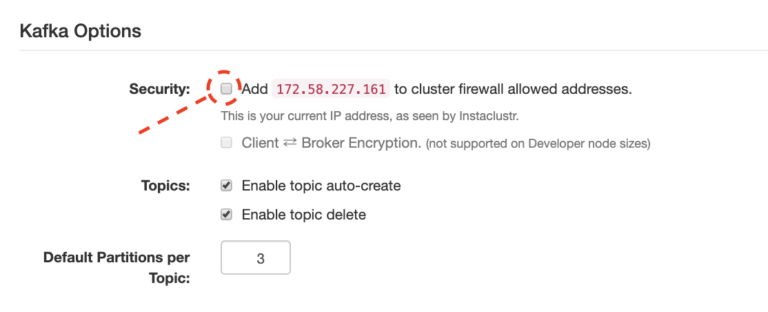
- Don’t forget to hit this neat button to enable access to the cluster from your IP address.
- Finally, spin up the cluster.
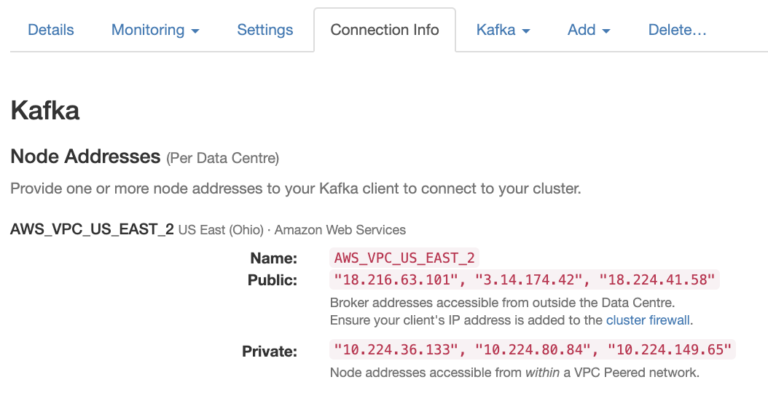
- Once the cluster is created, click on connection info tab and scroll down to see all the connection details such as the server connection details.
Step 1: Create an instaclustr.env file with the required settings
The following env file will work with a basic cluster provisioned with the settings specified above.
|
1 2 3 4 5 6 |
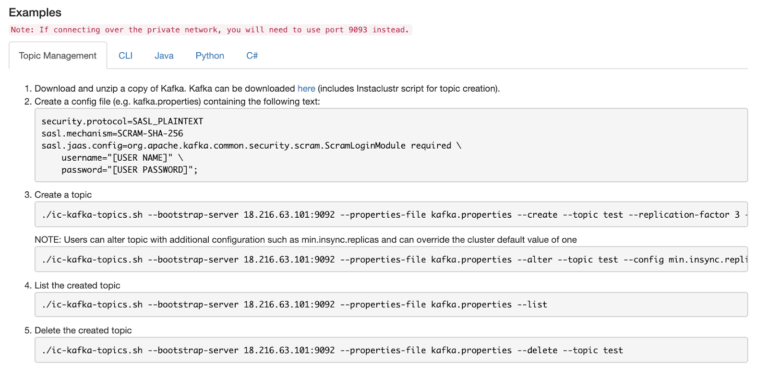
BOOTSTRAP=<broker1 Public IP>:9092,<broker1 Public IP>:9092,<broker1 Public IP>:9092 SECURITY_PROTOCOL=SASL_PLAINTEXT SASL_MECHANISM=SCRAM-SHA-256 SASL_JAAS_CONFIG=org.apache.kafka.common.security.scram.ScramLoginModule required username="ickafka" password="<YOUR PASSOWRD HERE>"; ALLOW_TOPIC_INSPECT=true TRIAL_CODE=YOUR_CODE |
The required information (<> above) can be found on the Connection Info tab once your cluster is provisioned.
You can also provision a cluster with client to broker SSL encryption and schema registry in which case you should add the following settings to the env file:
|
1 2 3 4 5 6 |
SSL_ENABLED_PROTOCOLS=TLSv1.2,TLSv1.1,TLSv1 SSL_TRUSTSTORE_LOCATION=/ssl/truststore.jks SSL_TRUSTSTORE_PASSWORD=instaclustr SSL_PROTOCOL=TLS SCHEMA_REGISTRY_URL=<URL FROM CONNECTION INFO> SCHEMA_REGISTRY_AUTH=URL |
Step 2: Run Command
|
1 |
docker run -p 3000:3000 --env-file ./instaclustr.env operatr/operatr:latest |
Step 3: Check it out!
Navigate your browser window to https://localhost:3000 and you will see the overall features of the application which is outlined below.
Feature Walkthrough
Overview Page:
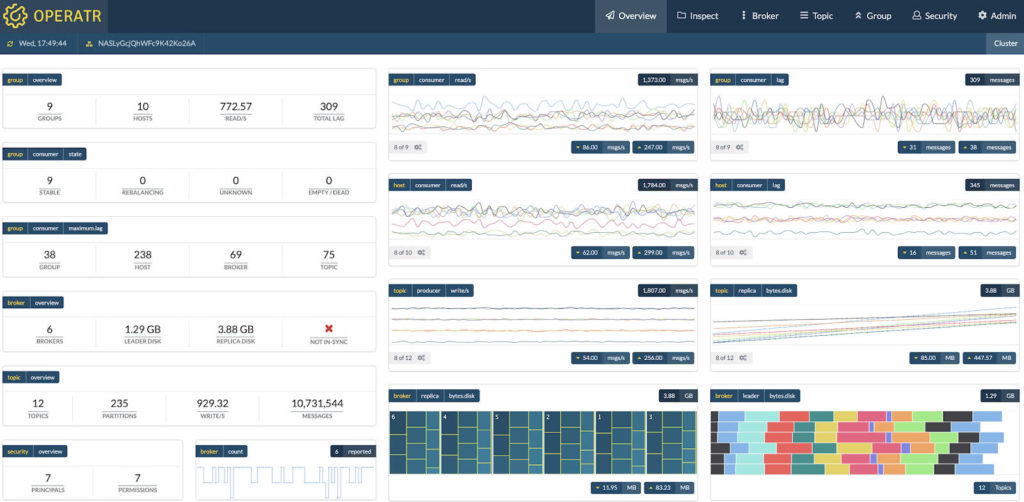
This page is essentially your DevOps or Site reliability dashboard, it shows you everything you need to know to check the overall health of your cluster. This dashboard, as you can see, will show you data rate metrics, cluster size metrics, partition data distribution metrics, and finally key information on consumer lag.
Broker
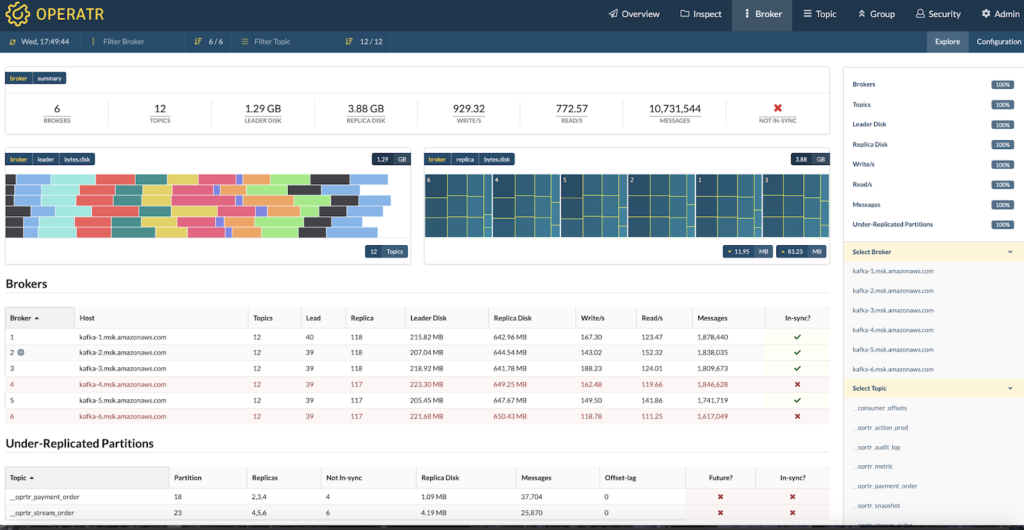
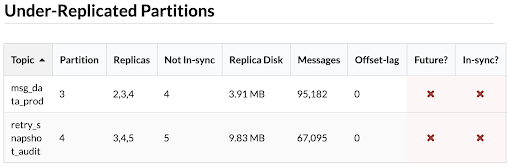
This is your tactical screen to inspect the overall performance of a broker node. On this dashboard, you will readily see if any partitions are under-replicated and you will see the overall key metrics such as number of messages, disk usage, along with bytes/messages in/out in that specific broker.
Topics:
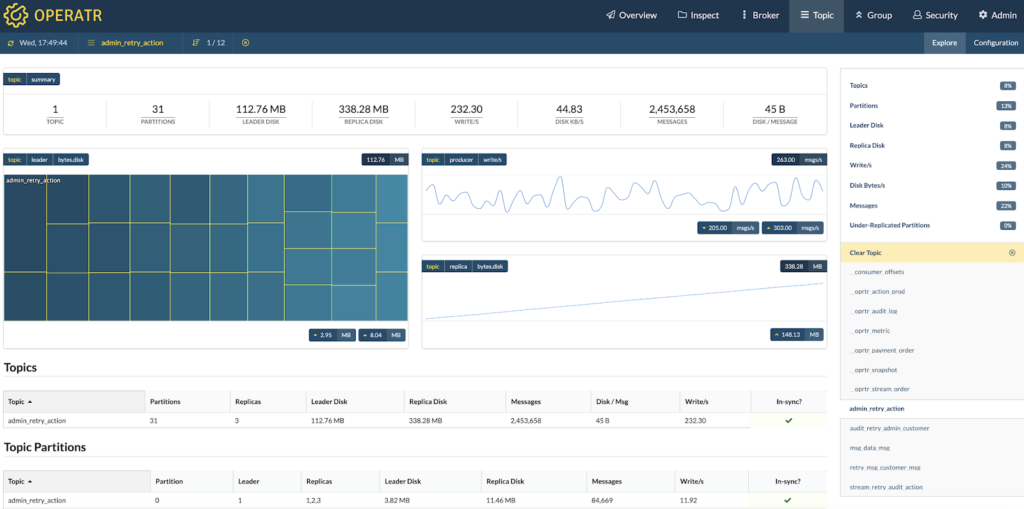
Data distribution diagram below
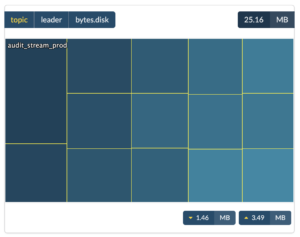
The first thing you see in the topic dashboard will be the overall distribution of data across the partitions in the topic, this is critical for determining if your partitioning or keying strategy is correct. Secondly, you will see key information such as data rates. Finally, a nice little checkbox on the right will show you if a partition is insync or not with the rest of a cluster.
Data Inspector Tool:
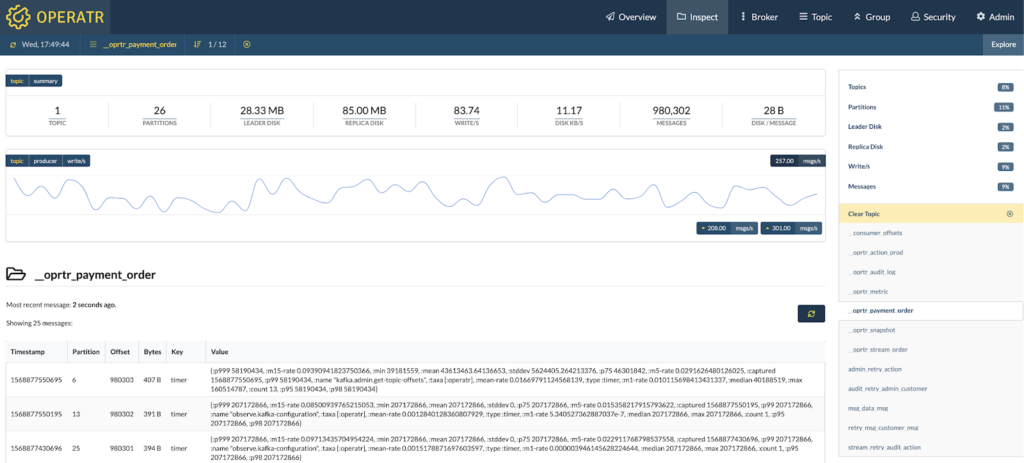
This dashboard will allow you to view individual messages on each topic, useful for debugging or gaining visibility of your topic level data
Consumer Groups:
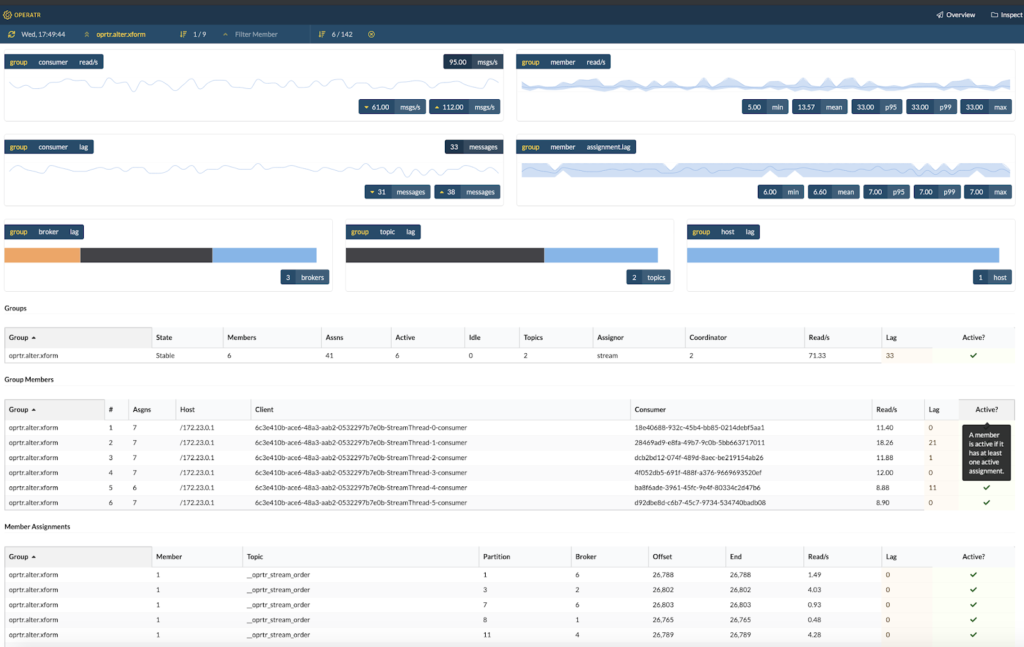
This dashboard will show you key information about a specific consumer group such as how many messages is the consumer in a consumer group lagging behind. You will be able to view consumer lag history with the charts at the top of the screen. Finally, you should be able to see the partition assignment for each member in the group.
Security:
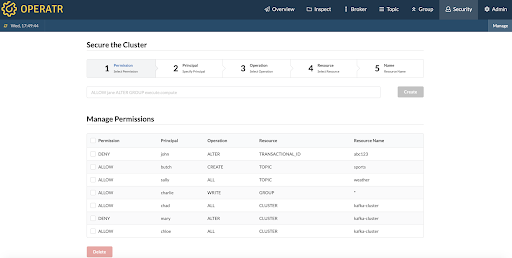
This dashboard gives you accessible visibility into ACL settings of Kafka which are usually hidden away from the average administrator behind some terminal commands. Now you can see which users can do what with which topic.
Admin:
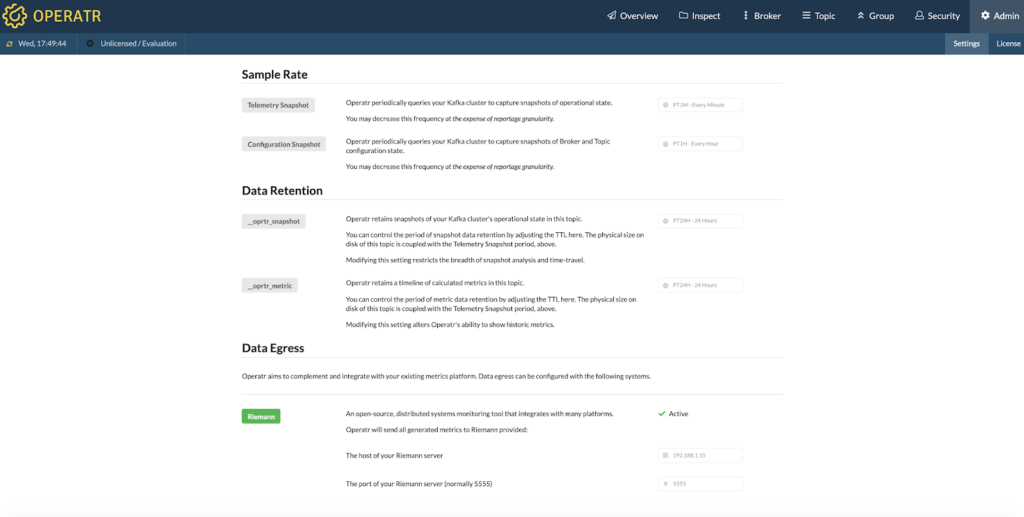
When you initially launch the jar application you can configure things such as:
- Sample rate for telemetry snapshots (default is every 1 minute)
- The tool will periodically collect configuration data from Kafka by reading the internal admin topics in Kafka (default is every 1 hour)
- Data retention period is default set to 24 hours
- Data retention metrics will determine how far back those pretty charts will go, currently, the default settings is 24 hours.
- You also have the option to select a Rieman server to send the data too.