What is a PostgreSQL cluster?
In PostgreSQL, the term cluster has several distinct meanings depending on whether you are talking about core architecture, high-availability infrastructure, or SQL optimization. In its core sense, a database cluster is a collection of databases managed by a single instance of a running PostgreSQL server. All of these databases share one data directory, a common set of configuration settings, and system resources, and each can be accessed using a unique connection string.
PostgreSQL clusters are useful for managing data in large-scale environments, offering improved data availability and redundancy. By distributing databases across multiple physical or virtual servers, PostgreSQL clusters ensure that even if one server fails, the others can continue to operate, minimizing downtime and data loss.
In this hands-on guide we’ll provide three quick tutorials that will show you how to setup your first PostgreSQL cluster, optimize it for performance, and monitor actual performance in production.
Key traits of a single-instance database cluster:
- Shared storage: All databases share one directory on disk, known as the data directory (PGDATA).
- Shared configuration: They use common memory settings such as
shared_buffers, connection limits, and background processes. - Global roles: Users and permissions are global across the cluster, though specific GRANT privileges can be isolated to individual databases.
- Initialization: A default cluster (often named
main) is created when PostgreSQL is installed, using theinitdbcommand.
Common multi-node cluster patterns and tooling:
- Primary/standby replication: One primary node handles read and write traffic and streams its write-ahead logs (WAL) to one or more read-only standby nodes.
- Active-active (multi-master): Multiple nodes accept writes simultaneously, using tools such as pgEdge or EDB Postgres Distributed to merge changes.
- Orchestration tooling: Tools like Patroni, CloudNativePG, PgBouncer, and HAProxy automate failover and route traffic to the active primary node.
This is part of a series of articles about PostgreSQL
Types of PostgreSQL clusters
PostgreSQL clusters support several topologies, which determine how data is distributed and replicated across the cluster. Because native PostgreSQL does not provide automated failover out of the box, multi-node clusters typically rely on specialized orchestration tools to connect several servers (nodes) for high availability, data redundancy, and read scalability.
Primary-secondary replication
Primary-secondary replication is a common setup in PostgreSQL clusters, where the primary database handles all write operations, while the secondary handles read operations. The primary streams its write-ahead logs (WAL) to one or more read-only standby nodes to keep them in sync. This allows for read scalability, as multiple replicas can distribute the load of read queries across the cluster, reducing the performance impact on the primary database.
Primary-secondary replication also provides a failover mechanism. If the primary database encounters failures, a secondary can be promoted to primary status, ensuring continuity of service. However, this setup requires a monitoring and management system to handle replication lags and ensure data consistency between the primary and its secondaries.
Multi-primary replication
Multi-primary replication enables all nodes in a cluster to accept write operations, offering high write availability and node redundancy. Tools such as pgEdge or EDB Postgres Distributed are commonly used to merge concurrent modifications across nodes asynchronously. This is suitable in scenarios where read and write operations need to occur at multiple geographical locations simultaneously, reducing latency for global applications.
However, multi-primary replication presents challenges in conflict resolution. With multiple nodes capable of handling writes, data conflicts may arise, requiring conflict-resolution strategies. For example, algorithms may be necessary to maintain consistency and integrity across the cluster.
Sharding in PostgreSQL clusters
Sharding splits the data into smaller, manageable segments called shards, distributed across multiple nodes in a PostgreSQL cluster. Each shard is a subset of the overall database, and queries are directed to the appropriate shard based on specified criteria. Sharding is useful for scaling databases horizontally, allowing systems to handle large volumes of data efficiently.
In PostgreSQL clusters, sharding requires careful planning and design. Organizations must determine the sharding key, which influences how data is split and distributed. The right sharding key can improve query performance by minimizing cross-node data retrievals. However, improper sharding can lead to uneven data distribution, resulting in inefficiencies and bottlenecks.
Cluster management and orchestration tools
Because PostgreSQL does not ship with built-in automated failover, multi-node clusters rely on orchestration and routing tools to stay highly available. The most widely used options include:
- Patroni: The industry-standard template for high availability. It uses distributed consensus stores such as etcd or Consul to safely manage automated primary failover without split-brain issues.
- CloudNativePG: An open source Kubernetes operator designed to manage the full lifecycle of highly available PostgreSQL clusters natively in container environments.
- PgBouncer and HAProxy: Connection poolers and proxy layers used alongside clusters to route client traffic to the correct active primary node.
Quick tutorial #1: Creating a local PostgreSQL database cluster
In this tutorial, we will walk through the steps of creating and configuring a basic PostgreSQL database cluster, starting with installing PostgreSQL, setting up a primary node, and configuring additional replica nodes for replication.
Setting up a PostgreSQL database cluster
To begin setting up a PostgreSQL cluster, you need to install PostgreSQL on all the servers that will be part of the cluster.
- Once installed, initialize the primary database instance on the main server using the following command:
1sudo -u postgres initdb -D /var/lib/pgsql/data
This command sets up the necessary directories and configuration files required for the PostgreSQL database to function.
- After initialization, start the PostgreSQL service:
1sudo systemctl start postgresql
With the primary node initialized and the service running, the next step is to configure it for replication.
Configuring the primary node
On the primary node, modify the PostgreSQL configuration to allow replication.
- Open the
postgresql.conffile:1sudo nano /var/lib/pgsql/data/postgresql.conf - Enable replication by adding or modifying the following parameters:
123wal_level = replicamax_wal_senders = 3wal_keep_segments = 64
These settings ensure that write-ahead logging (WAL) is available for replication, with a sufficient number of WAL sender processes and segments retained.
- After saving the changes, restart PostgreSQL to apply the configuration:
1sudo systemctl restart postgresql
After restarting, you can check the status of the server using the following command:
1sudo systemctl status postgresql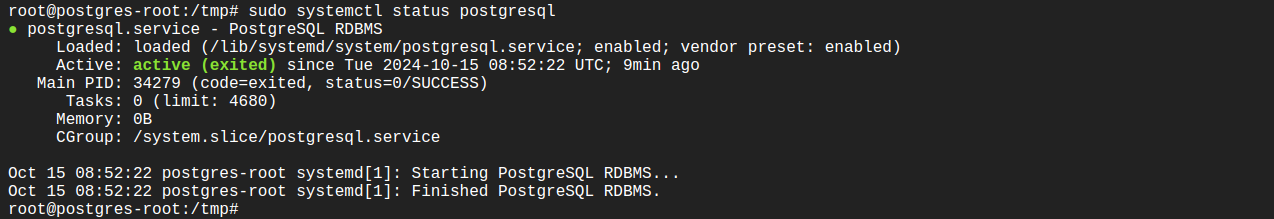
Create a replication user on the primary node
Next, create a replication user that will be used by the replica nodes to access the primary server:
- Connect to the PostgreSQL instance:
1sudo -u postgres psql
- Run the following command to create a user with replication privileges:
1CREATE ROLE replicator WITH REPLICATION PASSWORD 'yyooal8h' LOGIN;

- Once the replication user is created, grant it the necessary permissions and exit the PostgreSQL shell using
\q.
Step 4: Configuring another node
Any other node in the cluster must already be installed on PostgreSQL. To configure a secondary node for replication:
- Stop the PostgreSQL service on the replica server:
1sudo systemctl stop postgresql
- Next, copy the data directory from the primary node to the replica node using the
rsynccommand:1rsync -av --progress /var/lib/pgsql/data/ root@replica:/var/lib/pgsql/data/This copies the current state of the primary node to the replica, ensuring that both nodes are synchronized.
- After copying, on PostgreSQL 11 or earlier, modify the recovery.conf file on the replica to configure it for streaming replication:
12standby_mode = 'on'primary_conninfo = 'host=primary_ip_address port=5432 user=replica_user password=my_password'
- Start the PostgreSQL service on the replica server:
1sudo systemctl start postgresql
- The secondary node should now be part of the cluster and able to replicate data from the primary node.
Tips from the expert

Perry Clark
Professional Services Consultant
Perry Clark is a seasoned open source consultant with NetApp. Perry is passionate about delivering high-quality solutions and has a strong background in various open source technologies and methodologies, making him a valuable asset to any project.
In my experience, here are tips that can help you better manage and optimize a PostgreSQL cluster:
- Use synchronous replication for critical data: If your system handles highly critical data, consider configuring at least one replica with synchronous replication. This ensures no transactions are lost during a failover, as the primary will only commit data when the replica confirms the write.
- Consider quorum-based failover in multi-node clusters: When using multiple replicas, quorum-based failover can enhance resilience. Instead of promoting a single replica, the cluster promotes based on a majority consensus, minimizing the chances of a split-brain scenario.
- Optimize shard distribution with consistent hashing: When implementing sharding, use consistent hashing to evenly distribute data across nodes and reduce rebalancing when nodes are added or removed. This technique minimizes data movement and avoids hotspots that degrade performance.
- Tune WAL settings for optimal write performance: Tuning Write-Ahead Log (WAL) settings, such as
wal_compression,wal_buffers, andcheckpoint_timeout, can significantly improve write throughput and reduce I/O overhead, especially in high-write environments like OLTP systems. - Monitor and manage bloat with aggressive autovacuum: Regularly monitor table and index bloat using tools like
pgstattupleorpg_repack, and adjust autovacuum settings accordingly. Aggressive vacuuming on heavily updated tables ensures minimal bloat and maintains PostgreSQL performance.
Quick tutorial #2: Optimizing PostgreSQL cluster to get high throughput
To maximize the performance of a PostgreSQL database cluster, several optimization techniques can be implemented. These techniques improve query execution, ensure efficient data storage, and enable better scaling across multiple nodes.
Query optimization
Efficient query execution is essential for high throughput. PostgreSQL offers multiple tools for query optimization, including indexing and execution plan analysis. You can begin by creating appropriate indexes to speed up data retrieval. Use the EXPLAIN command to analyze how queries are executed and identify bottlenecks in the query plan.
For example, analyzing whether a query is using an index or performing a sequential scan helps optimize resource usage. Additionally, using parameters like work_mem and shared_buffers effectively can improve query performance, particularly for complex queries involving large datasets.
Example:
Suppose the table is named purchases, with columns for purchase_id, purchase_date, customer_id, and total_price. You want to generate a report showing the total spending of each customer in the past year.
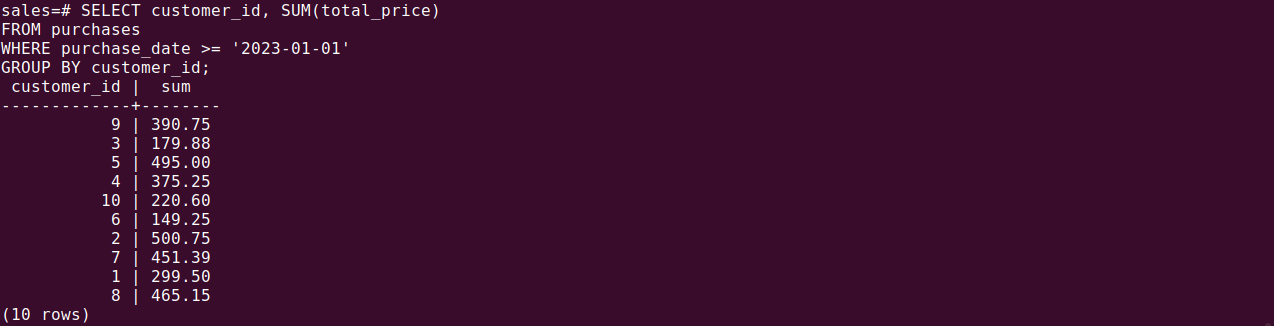
Basic query:
|
1 2 3 4 |
SELECT customer_id, SUM(total_price) FROM purchases WHERE purchase_date >= '2023-01-01' GROUP BY customer_id; |
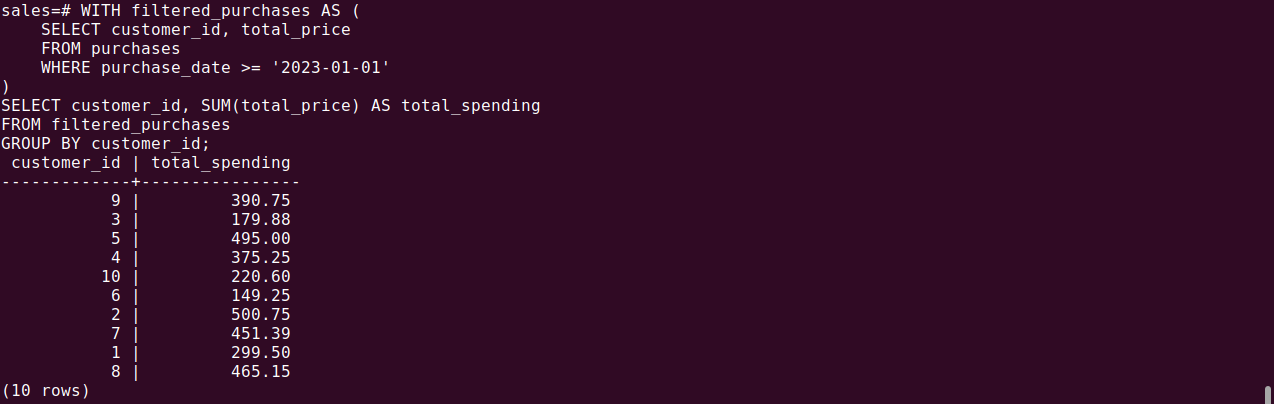
To optimize this query, use a Common Table Expression (CTE) to split the filtering and aggregation into distinct steps, improving performance by reducing the amount of data processed in each step:
|
1 2 3 4 5 6 7 8 |
WITH filtered_purchases AS ( SELECT customer_id, total_price FROM purchases WHERE purchase_date >= '2023-01-01' ) SELECT customer_id, SUM(total_price) AS total_spending FROM filtered_purchases GROUP BY customer_id; |
Physical row ordering with the CLUSTER command
PostgreSQL also includes a CLUSTER SQL command used for disk optimization. Running CLUSTER instructs PostgreSQL to physically reorder the rows of a table on disk to match the sequence of a specific index:
|
1 |
CLUSTER table_name USING index_name; |
- Performance boost: This drastically speeds up range queries that use that specific index, because related rows are stored together on disk.
- Static maintenance: The operation is not continuous. As new rows are updated or inserted, they become unclustered on disk over time, so you need to periodically run the
CLUSTERcommand again. - Locking: Running
CLUSTERrequires anACCESS EXCLUSIVElock, which makes the table temporarily inaccessible to application traffic while it runs.
Partitioning
Partitioning divides large tables into smaller, more manageable pieces, improving performance by reducing the number of rows that need to be scanned. PostgreSQL supports declarative partitioning, where tables can be partitioned based on range or list values.
For example, a table containing time-series data can be partitioned by date, allowing queries to target specific partitions rather than the entire dataset. This reduces I/O overhead and speeds up queries. Partitioning also helps manage large data volumes by enabling easier archival of old data, improving storage efficiency.
Example:
Suppose you want to partition the transactions table by quarter, with each partition covering three months in a year:
|
1 2 3 4 5 6 7 8 |
CREATE TABLE transactions ( transaction_id SERIAL PRIMARY KEY, transaction_date DATE NOT NULL, user_id INTEGER, amount DECIMAL(10, 2), ... ) PARTITION BY RANGE (transaction_date); |
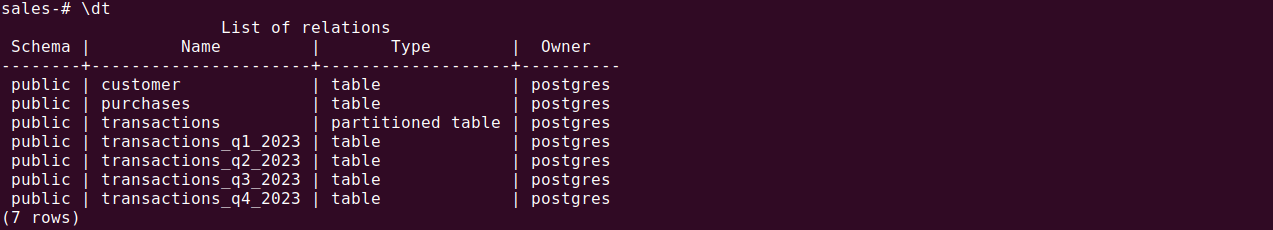
Now, create partitions for each quarter:
|
1 2 3 4 5 6 7 8 9 10 11 |
CREATE TABLE transactions_q1_2023 PARTITION OF transactions FOR VALUES FROM ('2023-01-01') TO ('2023-04-01'); CREATE TABLE transactions_q2_2023 PARTITION OF transactions FOR VALUES FROM ('2023-04-01') TO ('2023-07-01'); CREATE TABLE transactions_q3_2023 PARTITION OF transactions FOR VALUES FROM ('2023-07-01') TO ('2023-10-01'); CREATE TABLE transactions_q4_2023 PARTITION OF transactions FOR VALUES FROM ('2023-10-01') TO ('2024-01-01'); |
Scaling
Scaling a PostgreSQL cluster horizontally improves the system’s ability to handle increased load. Horizontal scaling can be achieved by adding more replica nodes to the cluster. Each replica node handles read queries, distributing the load across multiple servers and reducing pressure on the primary node.
Additionally, load balancers can be implemented to distribute query traffic intelligently across the cluster. This ensures that queries are routed to the appropriate nodes based on availability and resource usage, further enhancing the system’s capacity to handle large query volumes.
Example:
To horizontally scale a PostgreSQL database:
- Start by setting up replication. This involves creating replica databases that mirror the primary database, with read-only queries routed to the replicas while writes go to the primary. Tools like pgpool-II or pgBouncer can help manage query routing and failover.
- Next, you can add more replica servers to further distribute the load and improve performance.
- Alternatively, sharding can be used to divide data across multiple servers based on a sharding key, offering better scalability for large databases, though it is more complex to implement.
Archiving
Efficient archiving strategies prevent the database from growing uncontrollably, which can impact performance. There are several ways to archive data in PostgreSQL:
- Partitioning: Split a large table into smaller partitions based on specific columns, with older data moved to separate partitions. These can then be transferred to an archive database or table.
- Archiving to a separate table: Create an archive table with a similar schema but fewer indexes and constraints. Move older data from the main table to this archive table to improve performance.
- Archiving to an external system: Archive data to external storage, such as cloud services or file systems, reducing database storage but potentially making data access more complex.
Example:
You might want to adjust a partitioned table to separate archive data from other data. Suppose you want to detach the partition for transactions in 2022 from the main transactions table and attach it to an archive table called transactions_archive:
|
1 2 3 4 5 6 7 |
-- Detach the partition for transactions in 2022 from the main table ALTER TABLE transactions DETACH PARTITION transactions_2022; -- Attach the detached partition to the archive table ALTER TABLE transactions_archive ATTACH PARTITION transactions_2022 FOR VALUES FROM ('2022-01-01') TO ('2022-12-31'); |

Learn more in our detailed PostgreSQL tutorial
Quick tutorial #3: Monitoring PostgreSQL database cluster performance
Monitoring a PostgreSQL database is crucial to maintaining its performance, health, and overall usage efficiency. This process involves regularly collecting and analyzing various metrics such as CPU usage, disk I/O, memory consumption, and query performance. By actively monitoring these metrics, you can quickly identify bottlenecks or issues that may affect the database.
Tools for monitoring PostgreSQL include:
- PostgreSQL’s built-in statistics collector: PostgreSQL includes a built-in statistics collector that gathers essential information about database activity and performance. This tool can be configured to track specific metrics and store them for later analysis. Key performance indicators such as query execution times, table usage, and connection activity can be monitored directly from the database itself.
- External monitoring tools: There are several external monitoring tools that provide advanced capabilities for PostgreSQL monitoring, such as Datadog, New Relic, and Prometheus. These tools offer features like real-time dashboards, visualizations, and alerting systems to track the health of the database. They provide more detailed monitoring capabilities than the built-in collector, and often integrate with broader system monitoring solutions.
Example of monitoring using the built-in statistics collector:
- Enable the statistics collector: By default, the statistics collector is disabled. To enable it, modify the
postgresql.conffile and set thestats_collectorparameter to on. - Additionally, you can configure settings like
stats_temp_directoryto specify where the collected data should be stored.12stats_collector = onstats_temp_directory = '/var/lib/pgsql/pg_stat_tmp'Note: Don’t forget to restart postgresql after updating the configuration
- Collect and analyze metrics: Once enabled, PostgreSQL automatically collects metrics and stores them in system views such as
pg_stat_activityandpg_stat_database. You can query these views to get insights into performance and activity. For example, thepg_stat_databaseview provides information on connections, transactions, and queries.12SELECT datname, numbackends, xact_commit, xact_rollback, blks_read, blks_hitFROM pg_stat_database; - Configure alerts and dashboards: After gathering metrics, set up alerts and dashboards to monitor key indicators in real time. For example, you can configure alerts to trigger when the number of active connections exceeds a certain threshold or when query latency is unusually high.
Learn more in our detailed guide to PostgreSQL tuning
PostgreSQL on the Instaclustr Managed Platform: Experience the incredible power of open source
Instaclustr for PostgreSQL
Instaclustr simplifies the adoption of PostgreSQL by handling the heavy lifting for you. From provisioning and configuration to maintenance and scaling, it’s a seamless way to get the most out of your database. Here’s why businesses are trusting Instaclustr for their PostgreSQL needs:
1. Fully managed expertise
With Instaclustr, you’re in the hands of PostgreSQL experts. They’ll take care of routine tasks like updates, security patches, and backups while monitoring performance around the clock. Say goodbye to database headaches and hello to peace of mind.
2. Enterprise-grade security and reliability
Instaclustr for PostgreSQL prioritizes security and uptime. Advanced security features, including data encryption at rest and in transit, create a secure environment for mission-critical applications. High availability configurations ensure you never have to worry about costly downtime.
3. Seamless scalability
Whether you’re running a startup or managing enterprise-level workloads, scaling your database can be effortless with Instaclustr. Cloud-based solutions allow you to grow as you go, ensuring your database keeps pace with your business needs.
4. Open source freedom
Instaclustr is committed to the open source ethos, and PostgreSQL users benefit from complete transparency and zero lock-in. Use PostgreSQL the way it was meant to be: flexible, powerful, and free from proprietary constraints.
5. Performance optimization
Through expert tuning and monitoring, Instaclustr ensures that your PostgreSQL deployment delivers optimal performance. Whether you’re handling heavy transactional loads or complex analytics, Instaclustr keeps your database running smoothly.
For more information see: