The goal of this blog is to scale the Kongo IoT application on Production Instaclustr Kafka clusters. We’ll compare various approaches including scale-out, scale-up, and multiple clusters. There are two versions to the story. In the Blue Pill version scaling everything goes according to plan and scaling is easy. If you are interested in the journey to get there, read the Red Pill version, where we encounter and overcome some scalability challenges caused by a large number of consumers.
Let’s Go Scaling!
Even if the Congo river is only the second biggest river in the world, it does have the biggest rapids in the world! The Inga rapids occur where the river drops 100m, have an average flow of 43 thousand m³/s, and are perfect for a scalability challenge!

Kayaker fighting the rapids (Source: Adobe Stock)
It’s time to shoot the rapids and see how far we can scale Kongo. Our goal is to see how far Kongo will scale by increasing the Kafka cluster size (number of nodes and/or CPU cores per node) or cluster architecture.
This is your last chance. After this, there is no turning back. You take the blue pill—the story ends, you wake up in your bed and believe whatever you want to believe. You take the red pill—you stay in Wonderland, and I show you how deep the rabbit hole goes.
This blog has two “versions”. In the first version (The Blue Pill) everything goes according to plan and Kongo is easy to scale on Kafka. In the second version (The Red Pill) come with me on the journey that finally got us there!
1. Blue Pill—Scaling Is Easy
In order to scale the Kongo client application I had to make a change to run it across multiple processes and instances. I split the application into multiple “districts” with a subset of the Goods, Warehouses, and Trucks. Each process manages a district and uses dedicated sensor and rfid topics, but a common violations topic. This enabled the overall producer rate to be increased while retaining the correct ratio of primary producer, consumer, and secondary consumer events.
The maximum throughput for each configuration was determined by increasing the primary producer rate until the consumer SLA was violated. The SLA was 1 second average end-to-end response time (total time from producer timestamp to the consumer receiving each record). A soak test was then run multiple times at the maximum load to get reliable results.
For simplicity, we’ll report the total system throughput achieved (total throughput event/s = primary producers + secondary producers + consumers). We’ll treat the Kafka cluster as a black box for the time being, but will monitor the Kafka cluster and the client instance(s) CPU utilization. I’m also not doing any tuning of Kafka or the client-side application so these results are indicative only and not the absolute best possible. Note that as the Kongo IoT application wasn’t specifically designed for benchmarking (it’s non-deterministic), and we’re benchmarking an asynchronous distributed messaging system, on Amazon cloud infrastructure (dedicated VMs but shared infrastructure), there is inevitably variation in results across runs. The results are the average of three runs.
1.1 Scaling Out: 3 to 6 Node Kafka Cluster
For the first attempt at scaling Kongo we’ll start with a 3 node x 2 CPU cores per node Kafka cluster similar to the one we used in the last blog (this is the smallest professional size node offered by Instaclustr). We’ll use these results as the baseline to attempt to improve on. Note that this cluster has different settings to the previous test cluster (Broker to Broker encryption is turned on), and a change to the application code to improve scalability (see 2.3), so the results are not comparable. Here are the baseline cluster specifications:
3 nodes x Production EBS: tiny 500, replication factor 3, node size: r4.large-500, 500 GB Disk, 15.25 GB RAM, 2 CPU cores.
The baseline result was 90,000 events/s (3×2 bar).
One way of scaling Kafka is to increase the number of broker nodes. Let’s compare the 3 node cluster with a 6 node cluster with the same size nodes. In theory, doubling the number of nodes will give double the throughput, and the observed result (6×2 bar) was very close to this (176,000 events/s, x2 bar):
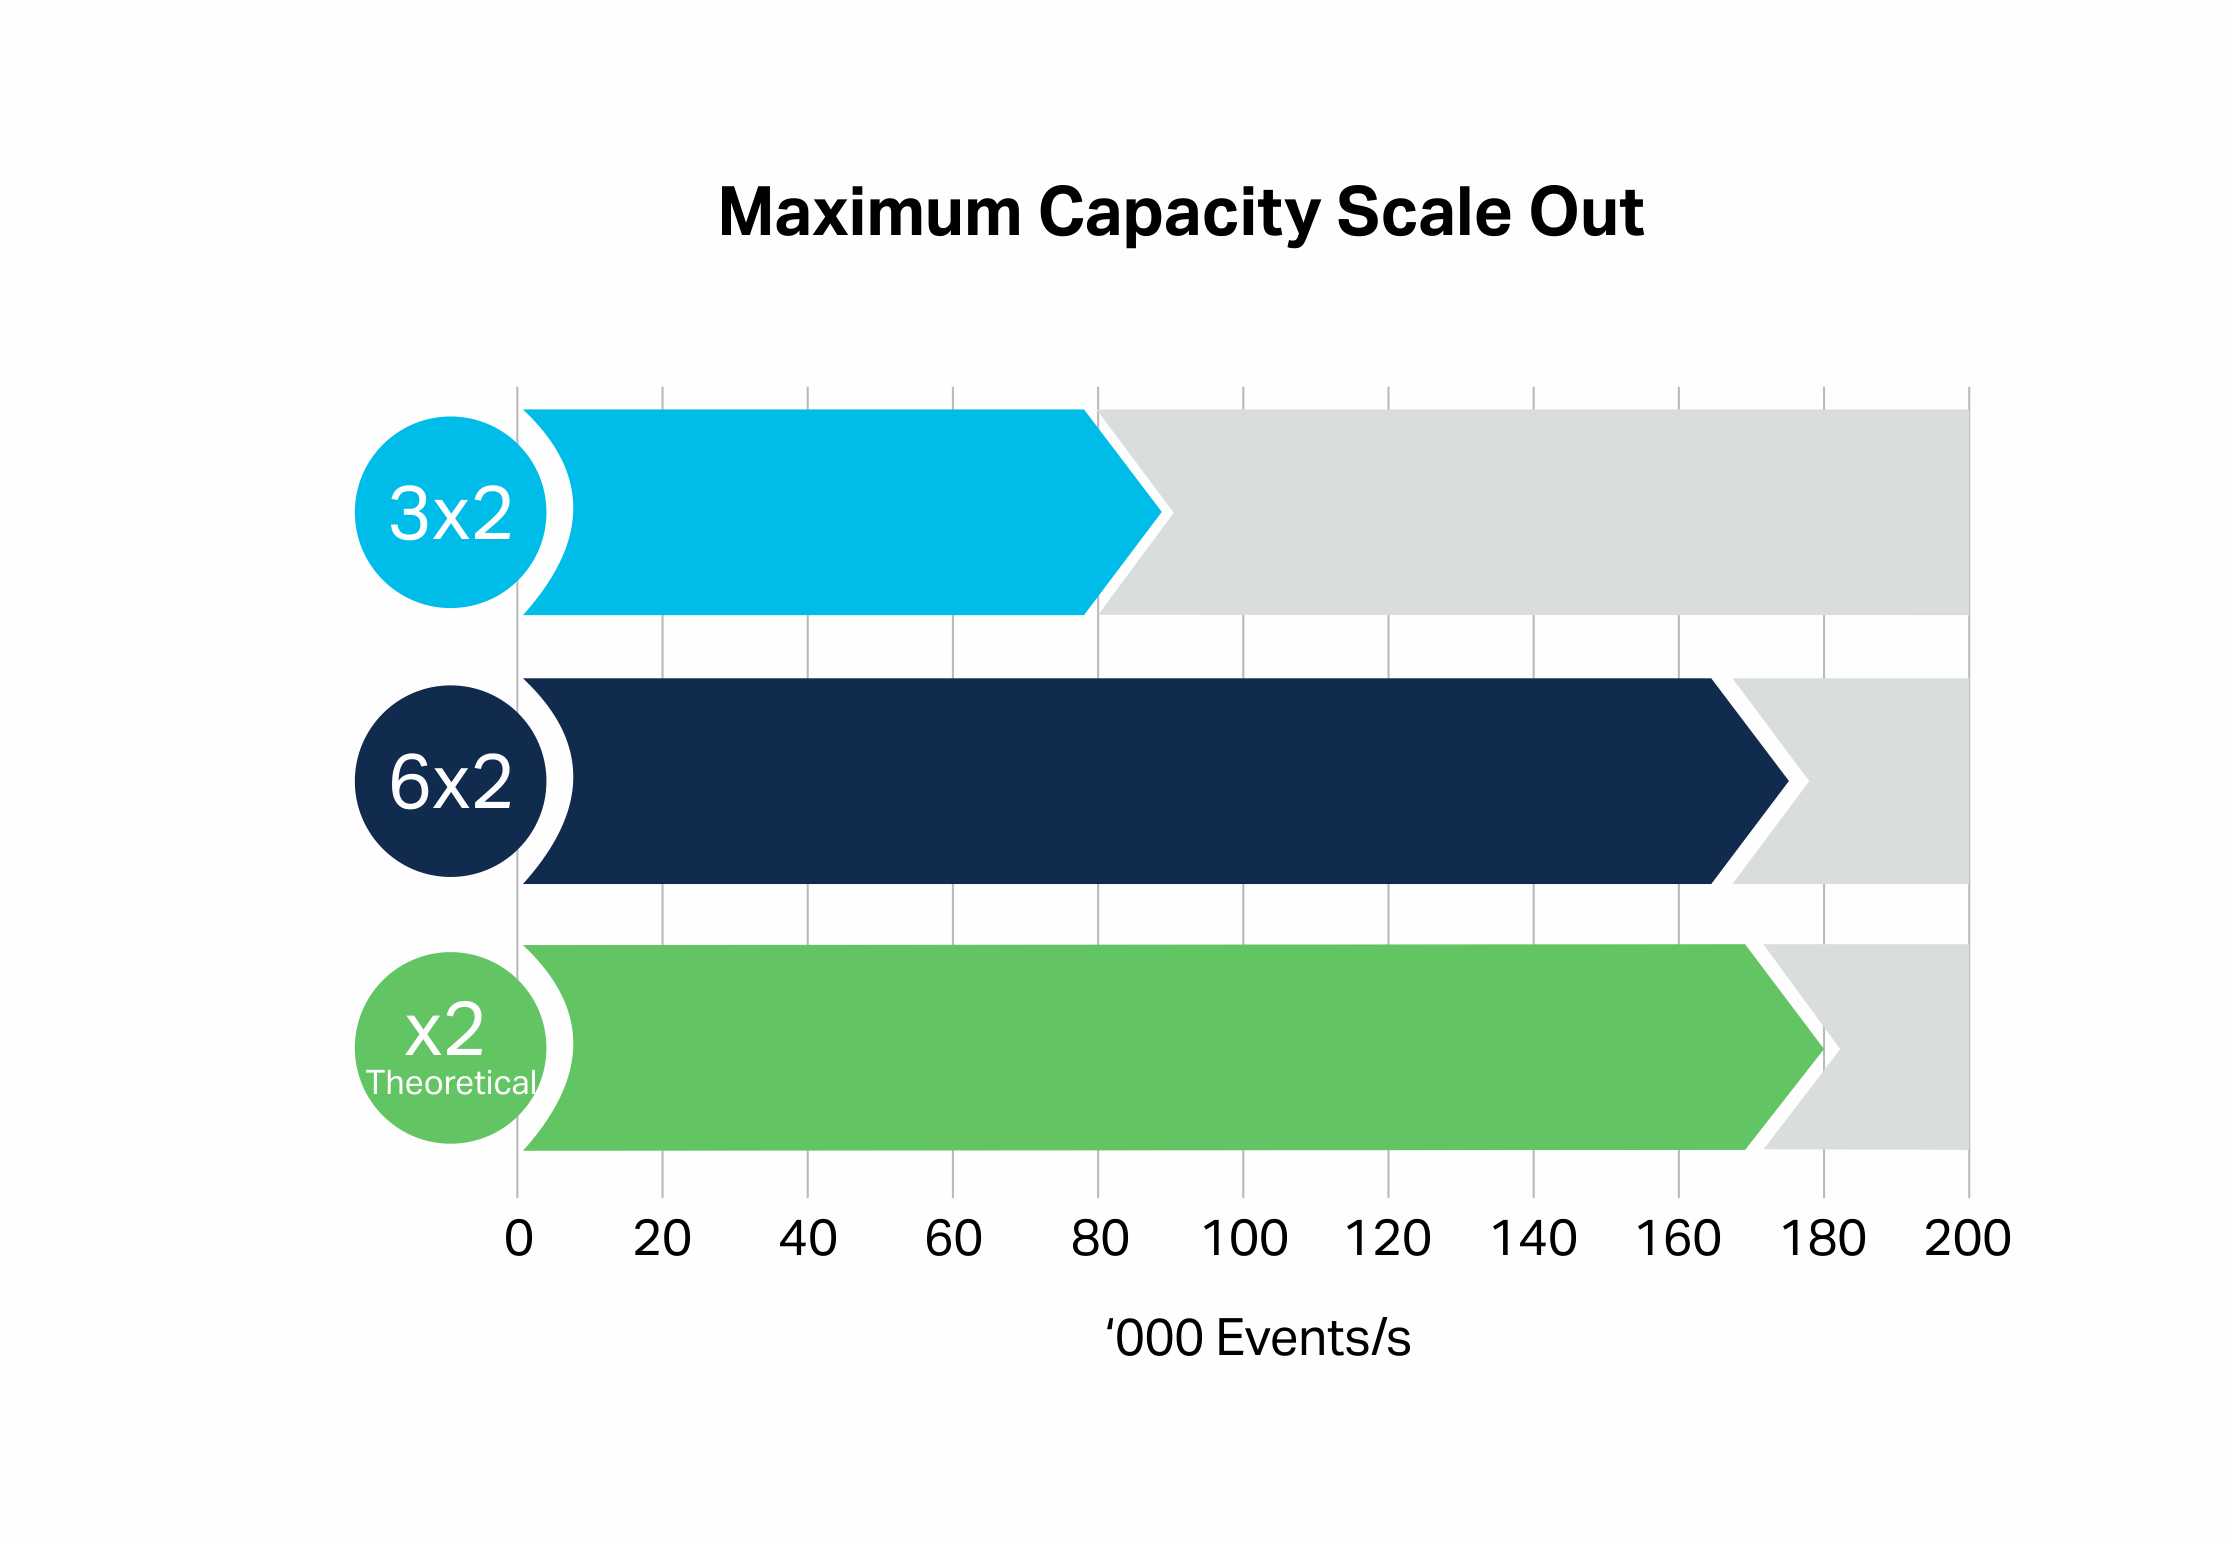
The Kafka cluster was at 85% CPU Utilization for the 3×2 configuration, and 90-95% for the 6×2 result, and 14 and 23 CPU cores were used on the client-side (running on two instances).
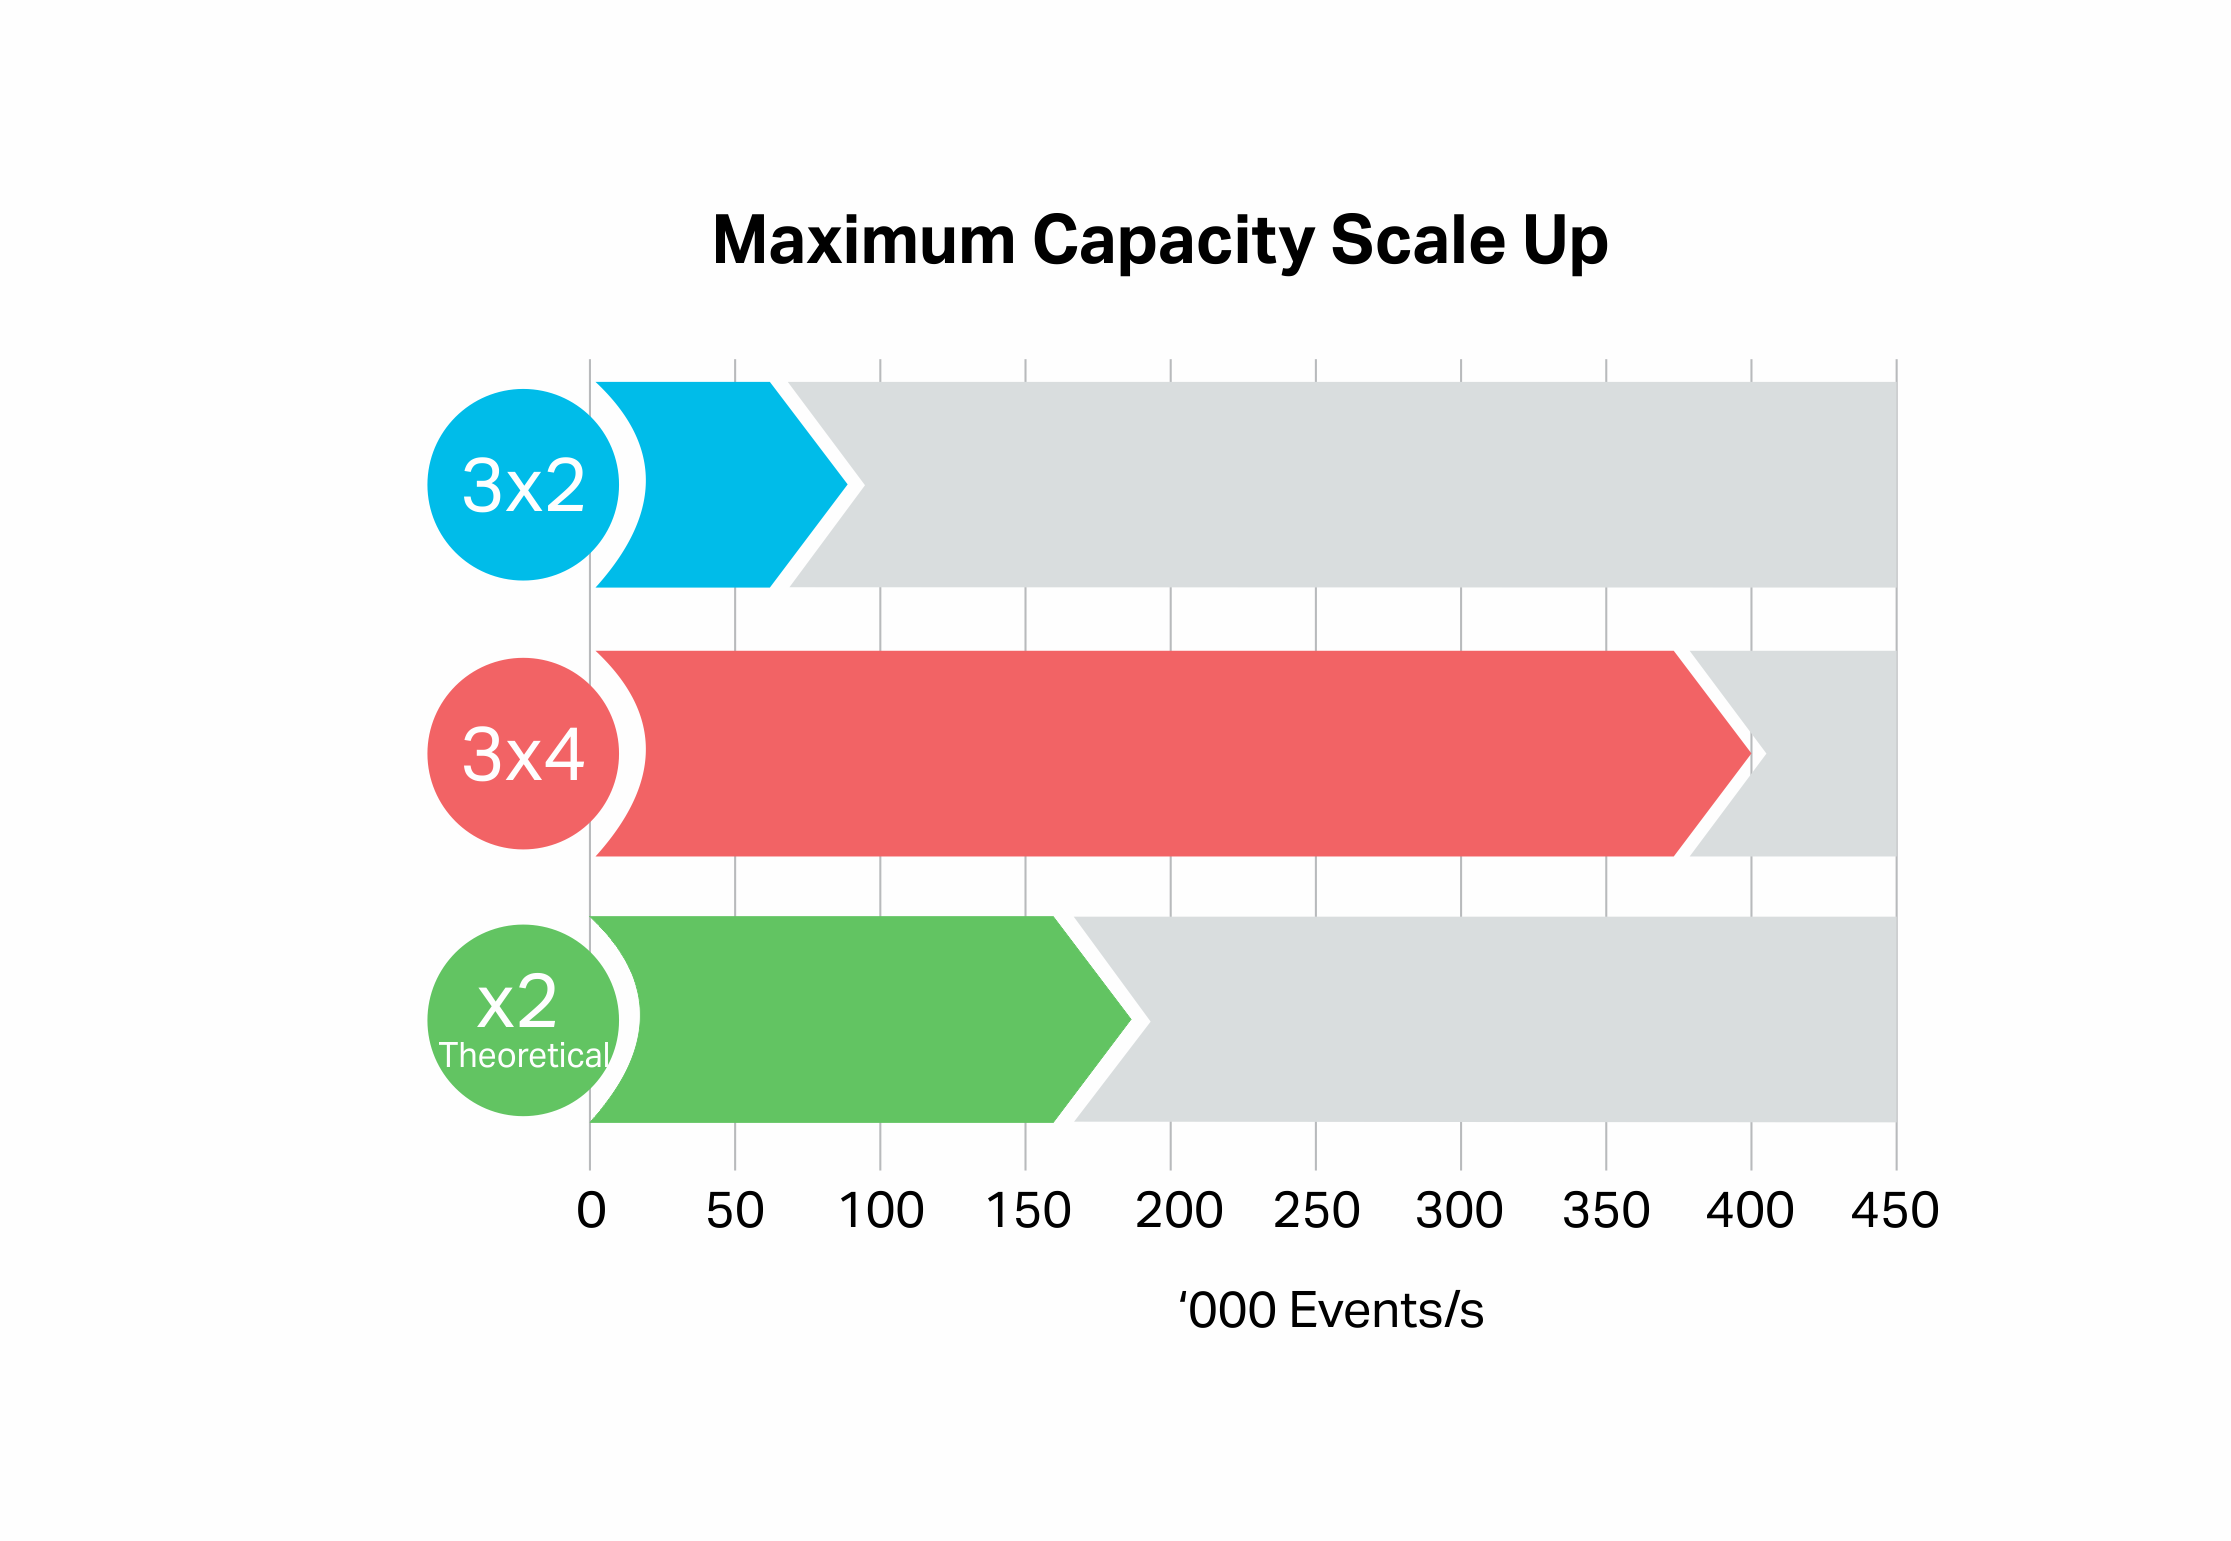
1.2 Scaling Up: 2 to 4 CPU Core Nodes
Another way to increase capacity is to scale up by increasing the size of the nodes. For the next experiment I created a bigger 3 x 4 CPU core per node cluster with the following specifications:
3 nodes x Production EBS: standard 750, replication factor 3, node size: r4.xlarge-750, 750 GB Disk, 30.5 GB RAM, 4 CPU cores.
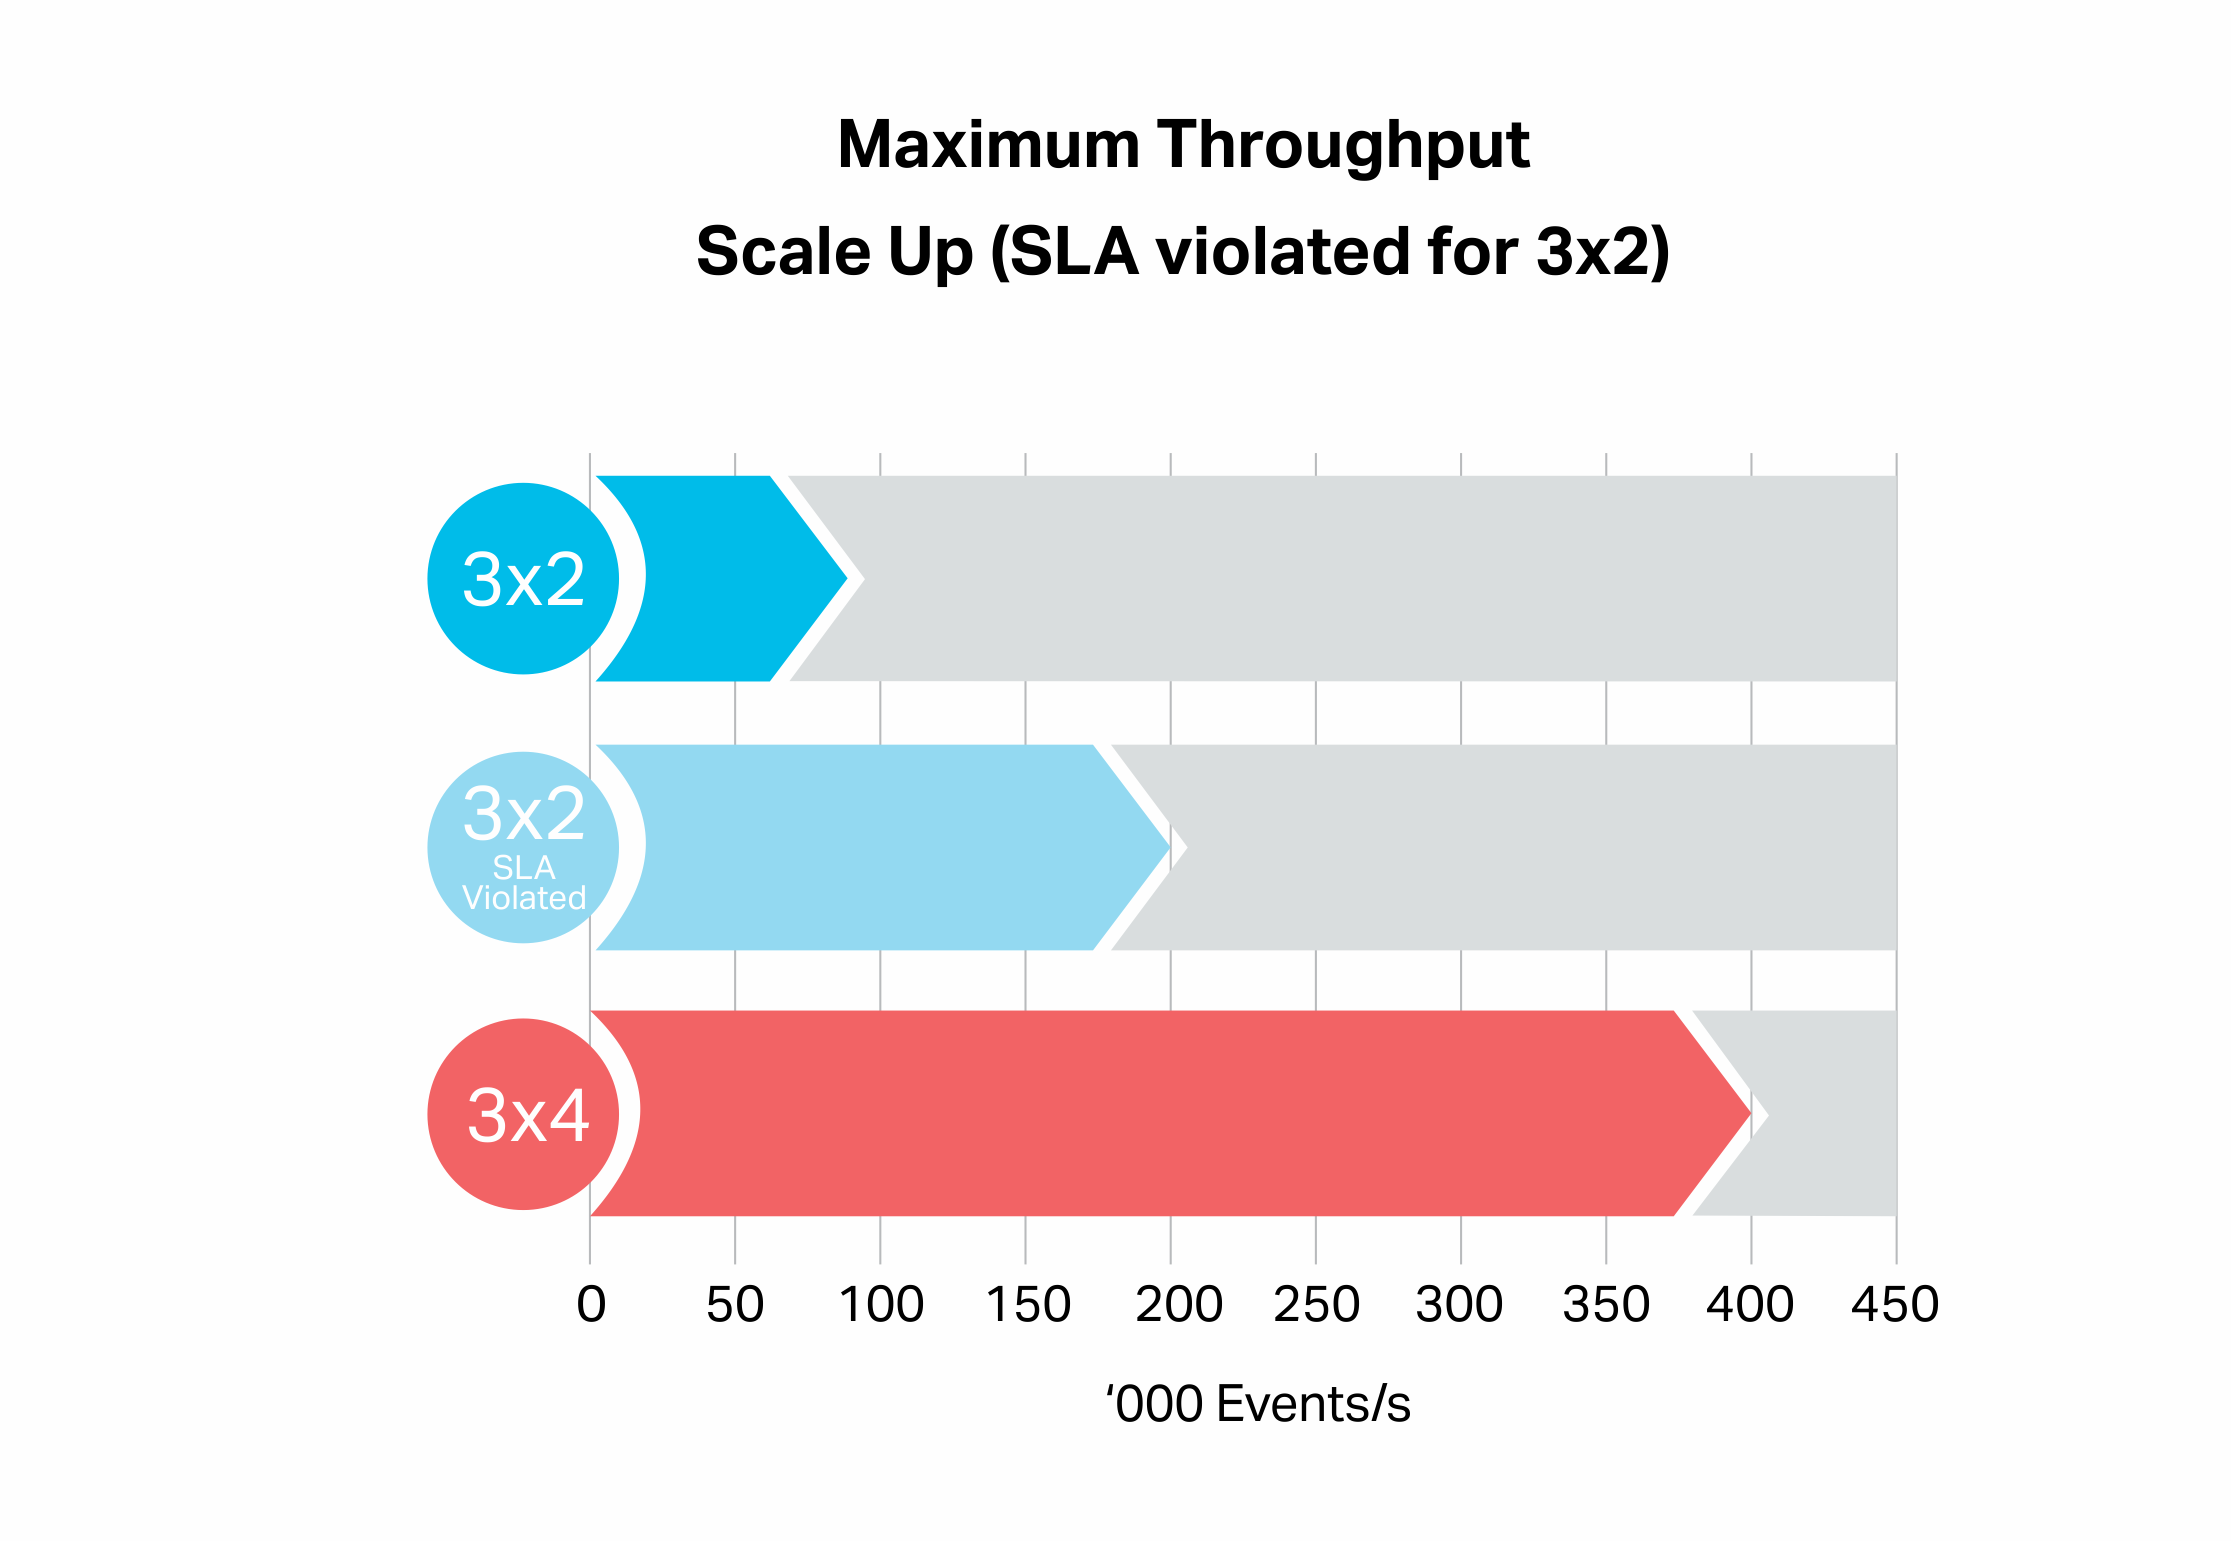
This result was surprising, giving a throughput of 400,00 events/s (red bar) which is significantly more than double (green bar) the baseline result (blue bar).
What’s going on here? The Kafka cluster utilization was 85%, and the number of client cores increased to 54 (4 processes running across 2 instances). I revisited the 3×2 baseline results by running the benchmark at even higher loads. It turns out that it is possible to achieve higher sustainable throughputs (consumers keeping up with producers, 200,000 events/s, pale blue bar), but the SLA was violated (i.e. average response times >> 1s). The 3×4 result (400,000 events/s) is twice this higher result:
See the Response Times section below (1.5) for further investigation.
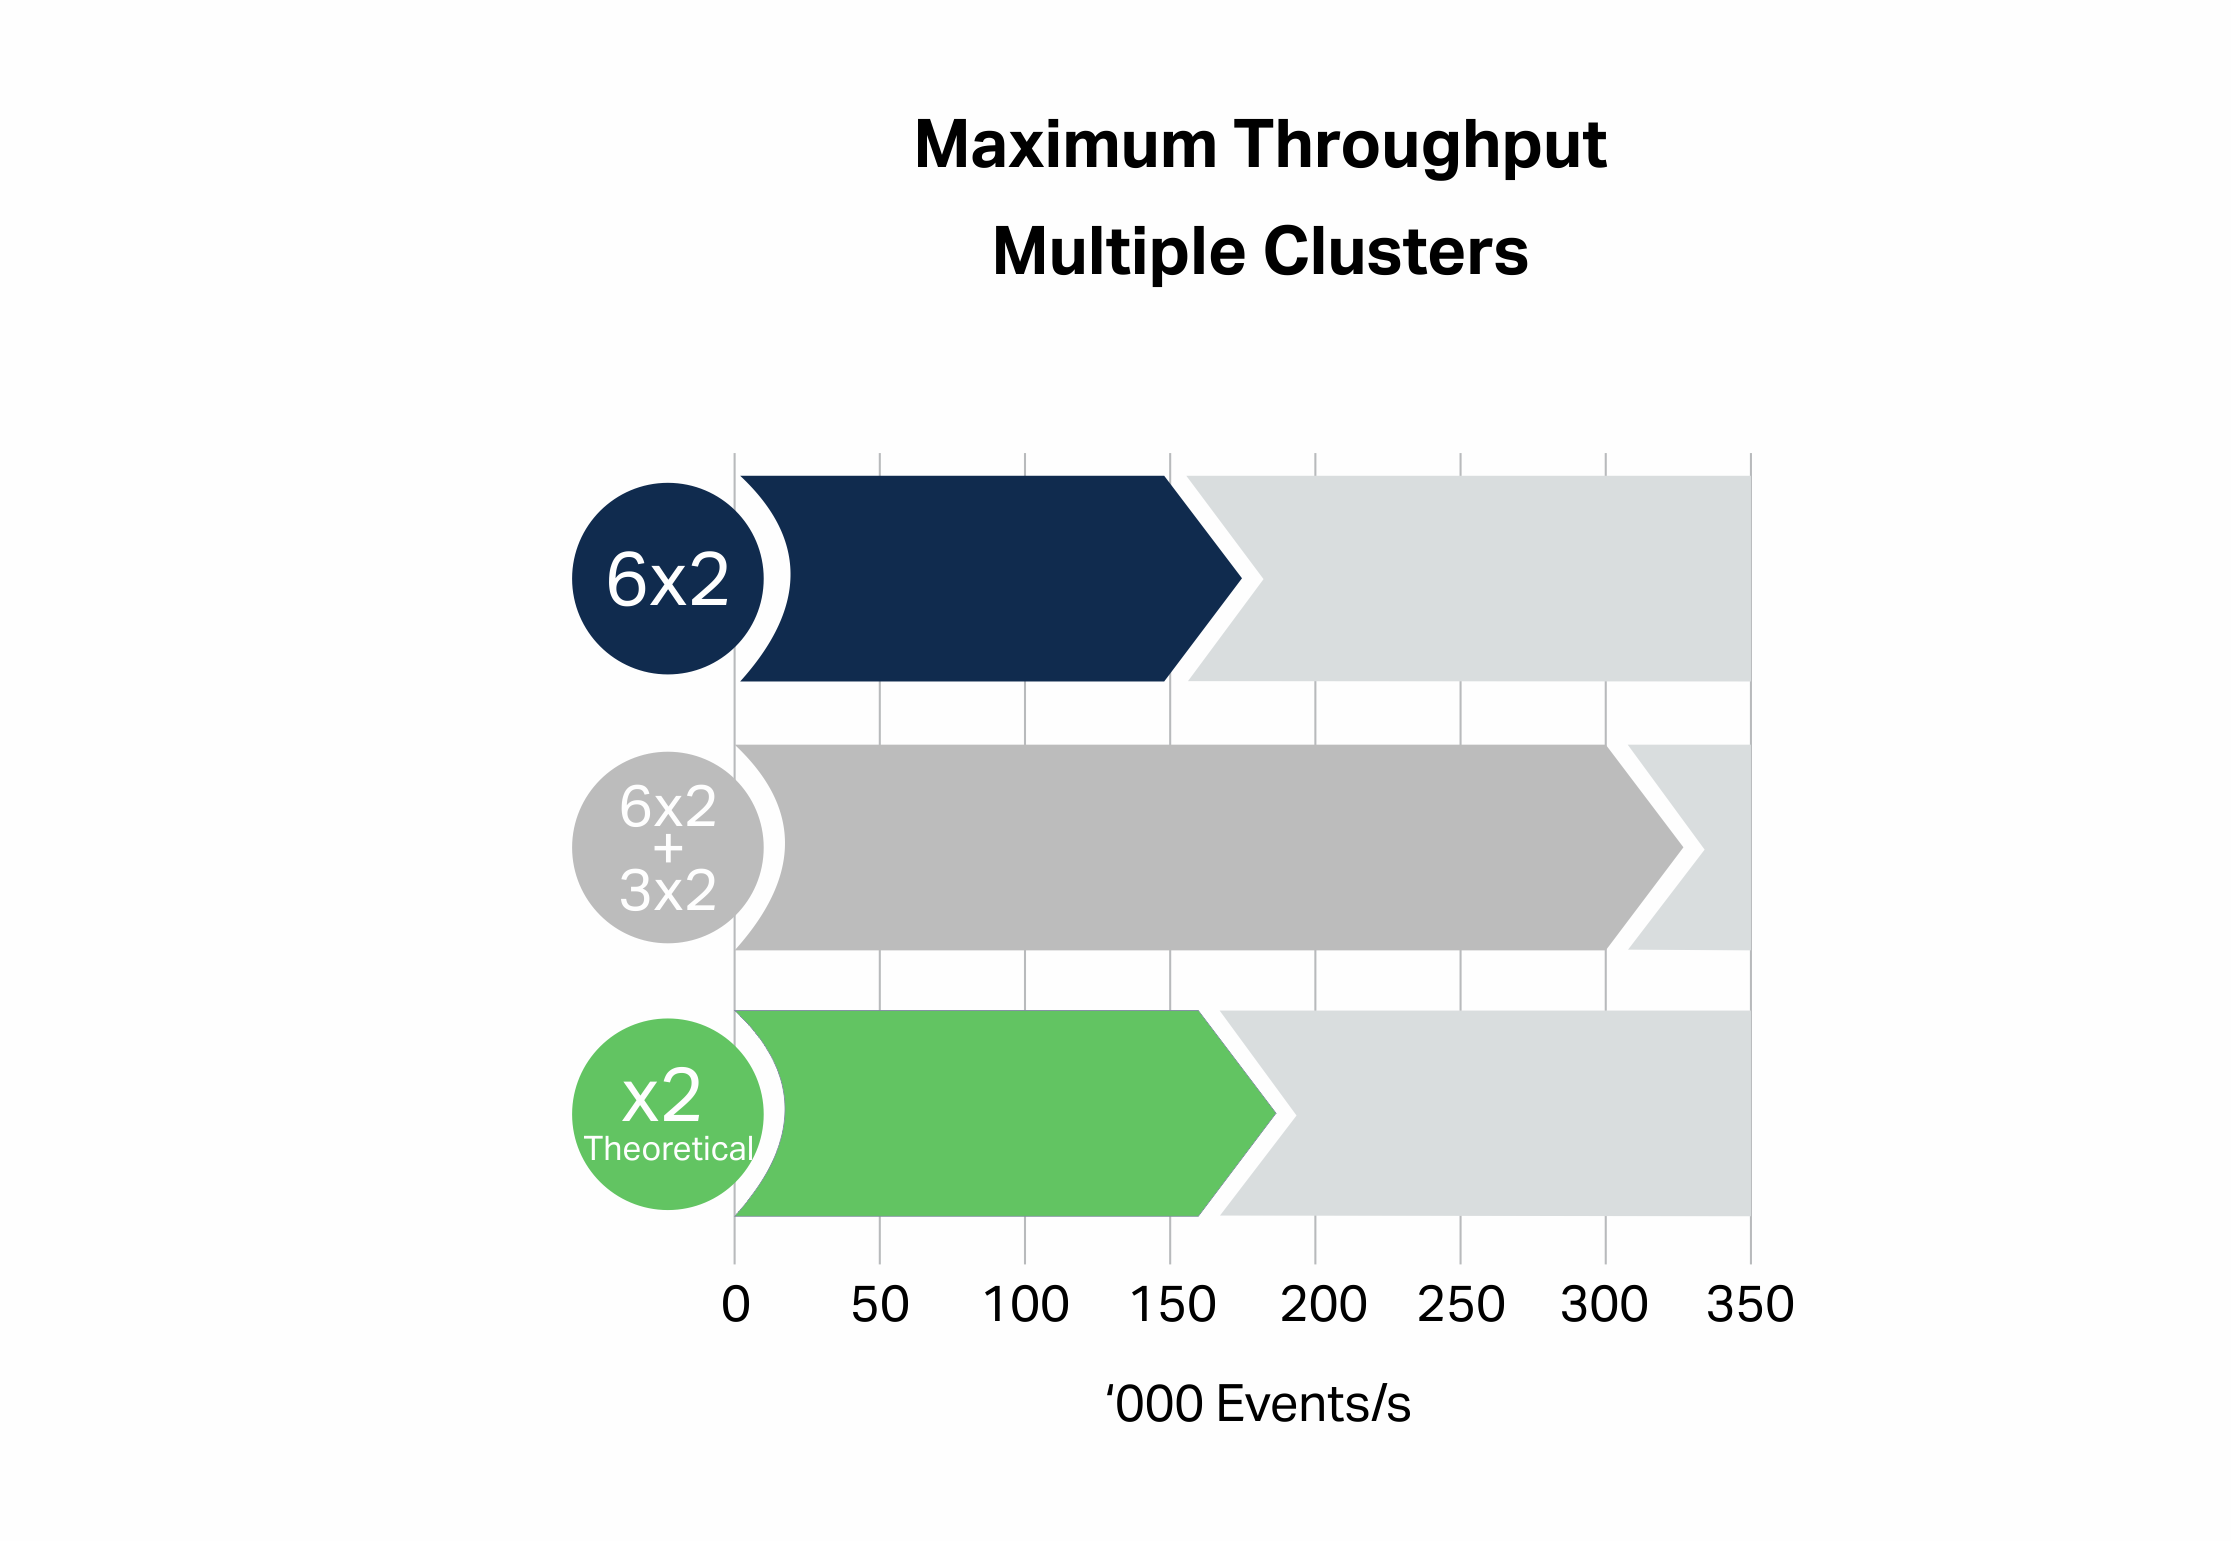
1.3 An Architectural Alternative: Multiple Clusters
A third way of scaling Kafka applications is to use multiple clusters. Multiple clusters is a flexible approach to scalability as it’s easier to diagnose if a cluster, workload, or topic is reaching maximum capacity, and different workloads/topics can be scaled independently. The Kongo application is suitable for scaling in this way because the secondary producers send data to the violations topic, i.e. it’s an output of the application and is not consumed by it. The violations topic is also responsible for up to 40% of the total events in and out of the system, so moving it to another cluster may take a significant load off the main cluster (the cluster left handling the primary producer and consumer loads). This diagram shows the division of work between the two Kafka clusters:
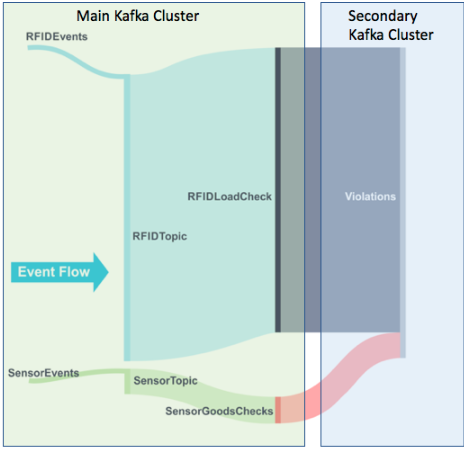
This experiment was tried with a combination of a larger 6 node x 2 cores per node cluster for the main cluster, and a smaller 3 node x 2 cores per node cluster for the secondary producer events and the violations topic.
This multi-cluster approach (grey bar) gave an 87% throughput improvement over the single 6 node cluster result, which exceeds the 50% increase in the number of cluster cores (from 12 to 18):
Kafka cluster CPU utilization was 95% for the primary cluster and 80% for the secondary cluster, and 37 client instance cores were used (4 processes on 2 instances).
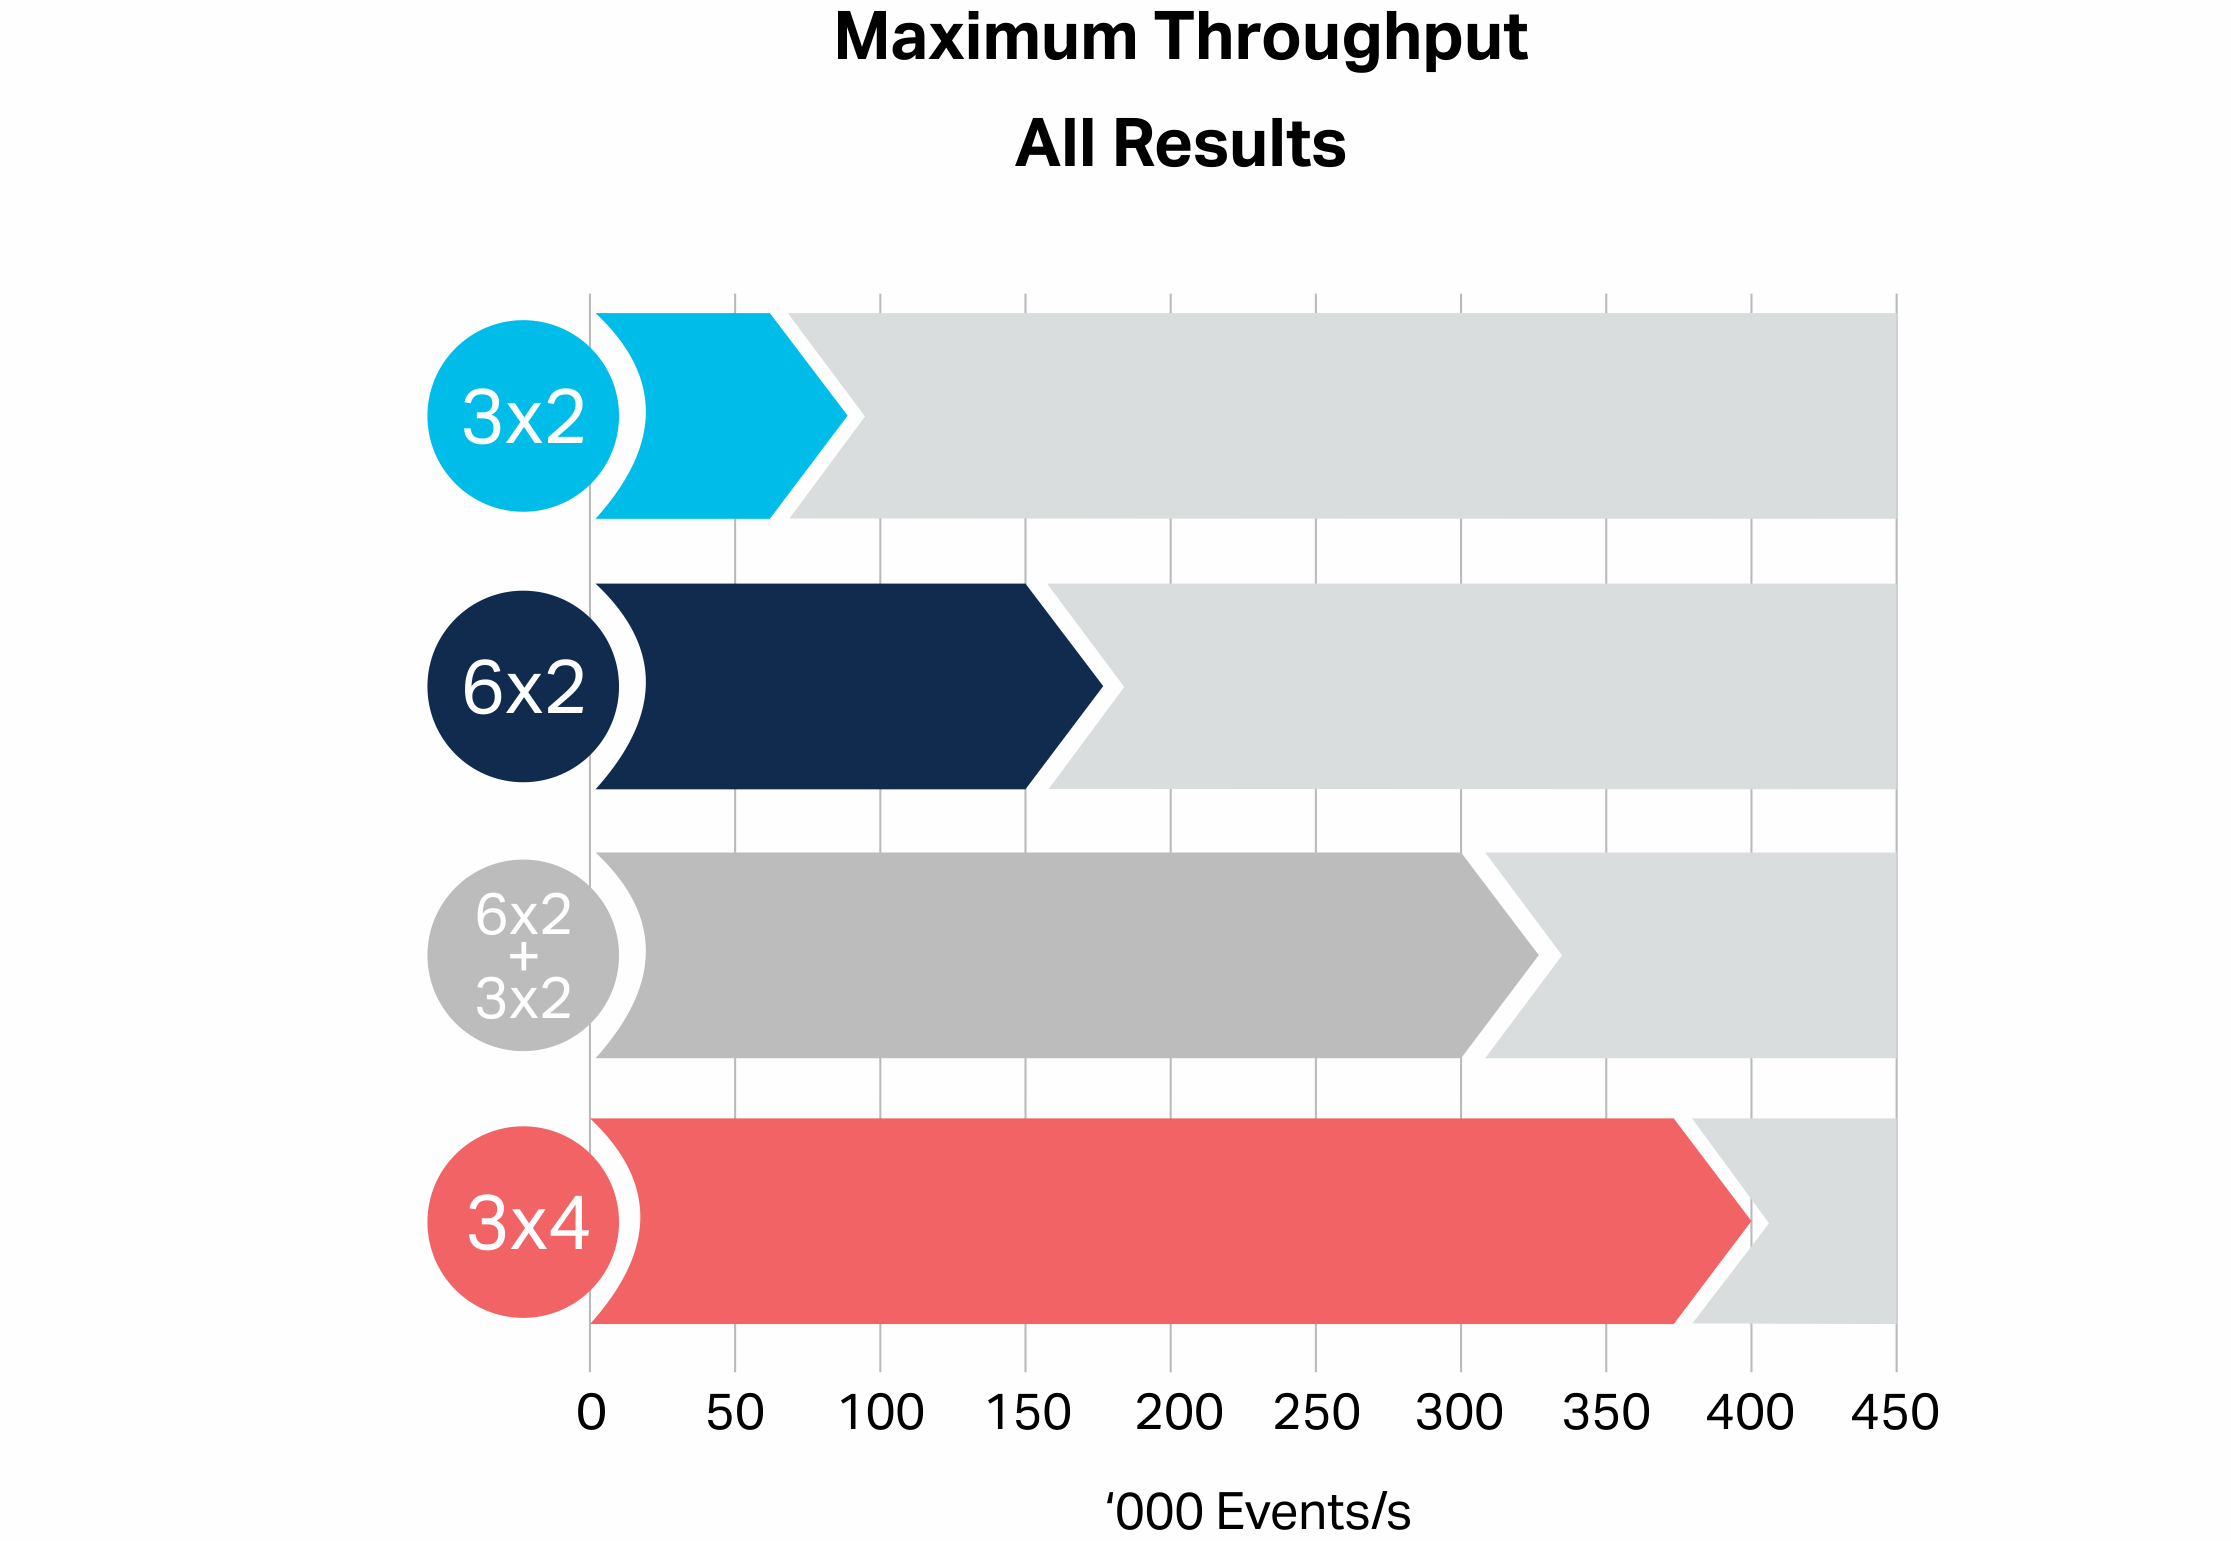
1.4 All Results
The following graph compares all the results, showing that the scale-up (3×4 bar) configuration gave the best improvement over the baseline (3×2 bar) result (close to 4 times the throughput), followed by the two cluster configuration (grey bar, which gave a 3.6 times improvement), and the scale-out configuration (6×2 bar, close to twice the throughput):
1.5 Response Times
Because I was focused on achieving maximum throughput for the SLA of 1 second, I initially missed a significant difference in the scale-up results. It turns out that there is a big difference in the minimum response times (measured as average response time at very low throughput). The 2 CPU core nodes have a higher latency (230 ms average) than the 4 CPU core nodes (20 ms average):
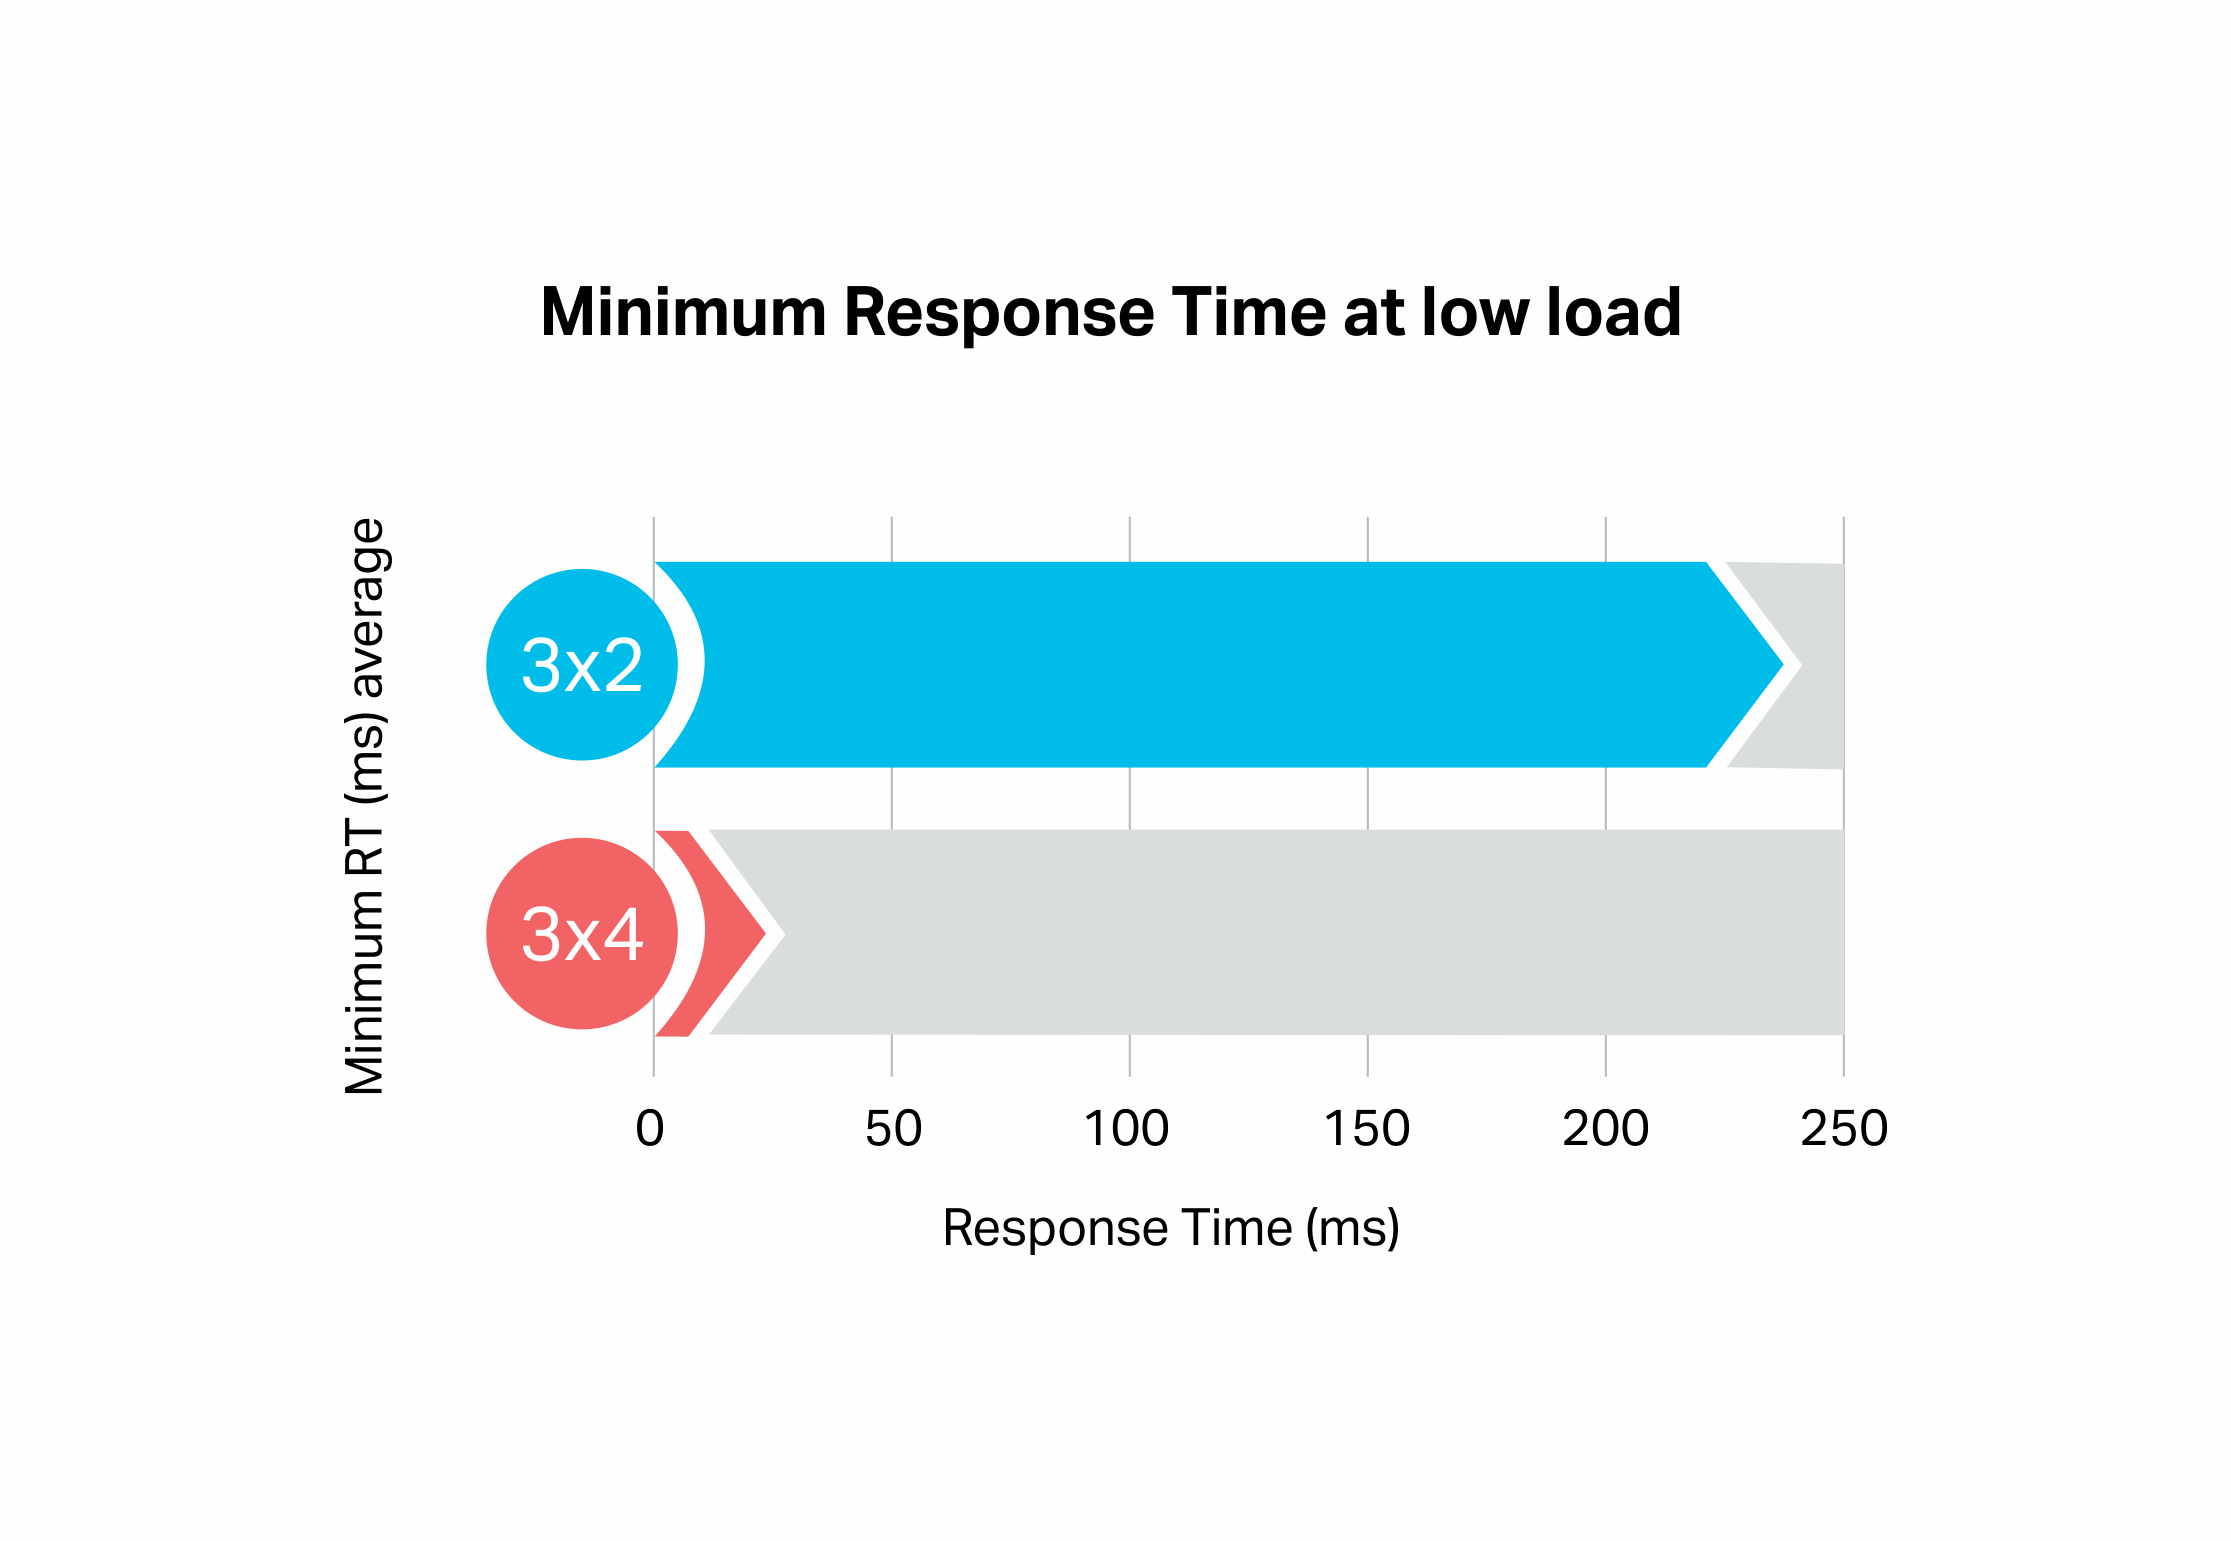
What does this mean? It explains why a higher throughput was achieved when ignoring the SLAs for the 2 CPU core node configuration, as the SLA is more easily violated (even with some headroom left) on 2 CPU core nodes. It also explains why the throughput of the scale-up configuration (4 cores per node) was more than expected. If latencies matter it’s a good idea to use larger node sizes.
A difference is also confirmed by the Instaclustr Kafka Brokers Monitoring Metric, Synthetic Transaction Latency. On the 2 CPU core nodes the maximum latency is 120ms, but on the 4 CPU core nodes, it’s only 20ms (average 10 ms c.f. 3 ms).
Why are the 2 CPU cores nodes slower? In theory, they use the same speed CPUs. One possible explanation is network performance. 2 core R4 instances have “up to 10 Gigabit” network performance, with 32 core instances having a full 10 Gigabit. It’s possible that a 2 core R4 actually only has 2/32 * 10 = 0.625 Gigabits (625 Megabits) available to it which could result in increased latency. However, according to this theory, an 8 node instance should have even less latency (but after extra testing it has comparable latency to the 4 core instances).
1.6 Server vs Client-Side Resources
As I was collecting both server and client-side instance CPU Utilization and load metrics, I was able to analyze this data and found a significant trend. The Kafka server is more efficient and uses fewer cores than the client-side. The client-side uses approximately double the number of cores as the server-side. The actual ratio of client to server cores depends to some extent on the node sizes so the following are averaged results, however the relationship between load and client cores is consistent, which allows the graph to be used to predict the expected number of client cores for a target load (e.g. 100 client cores for 1M events/s, extrapolation from 400k to 1M events/s):
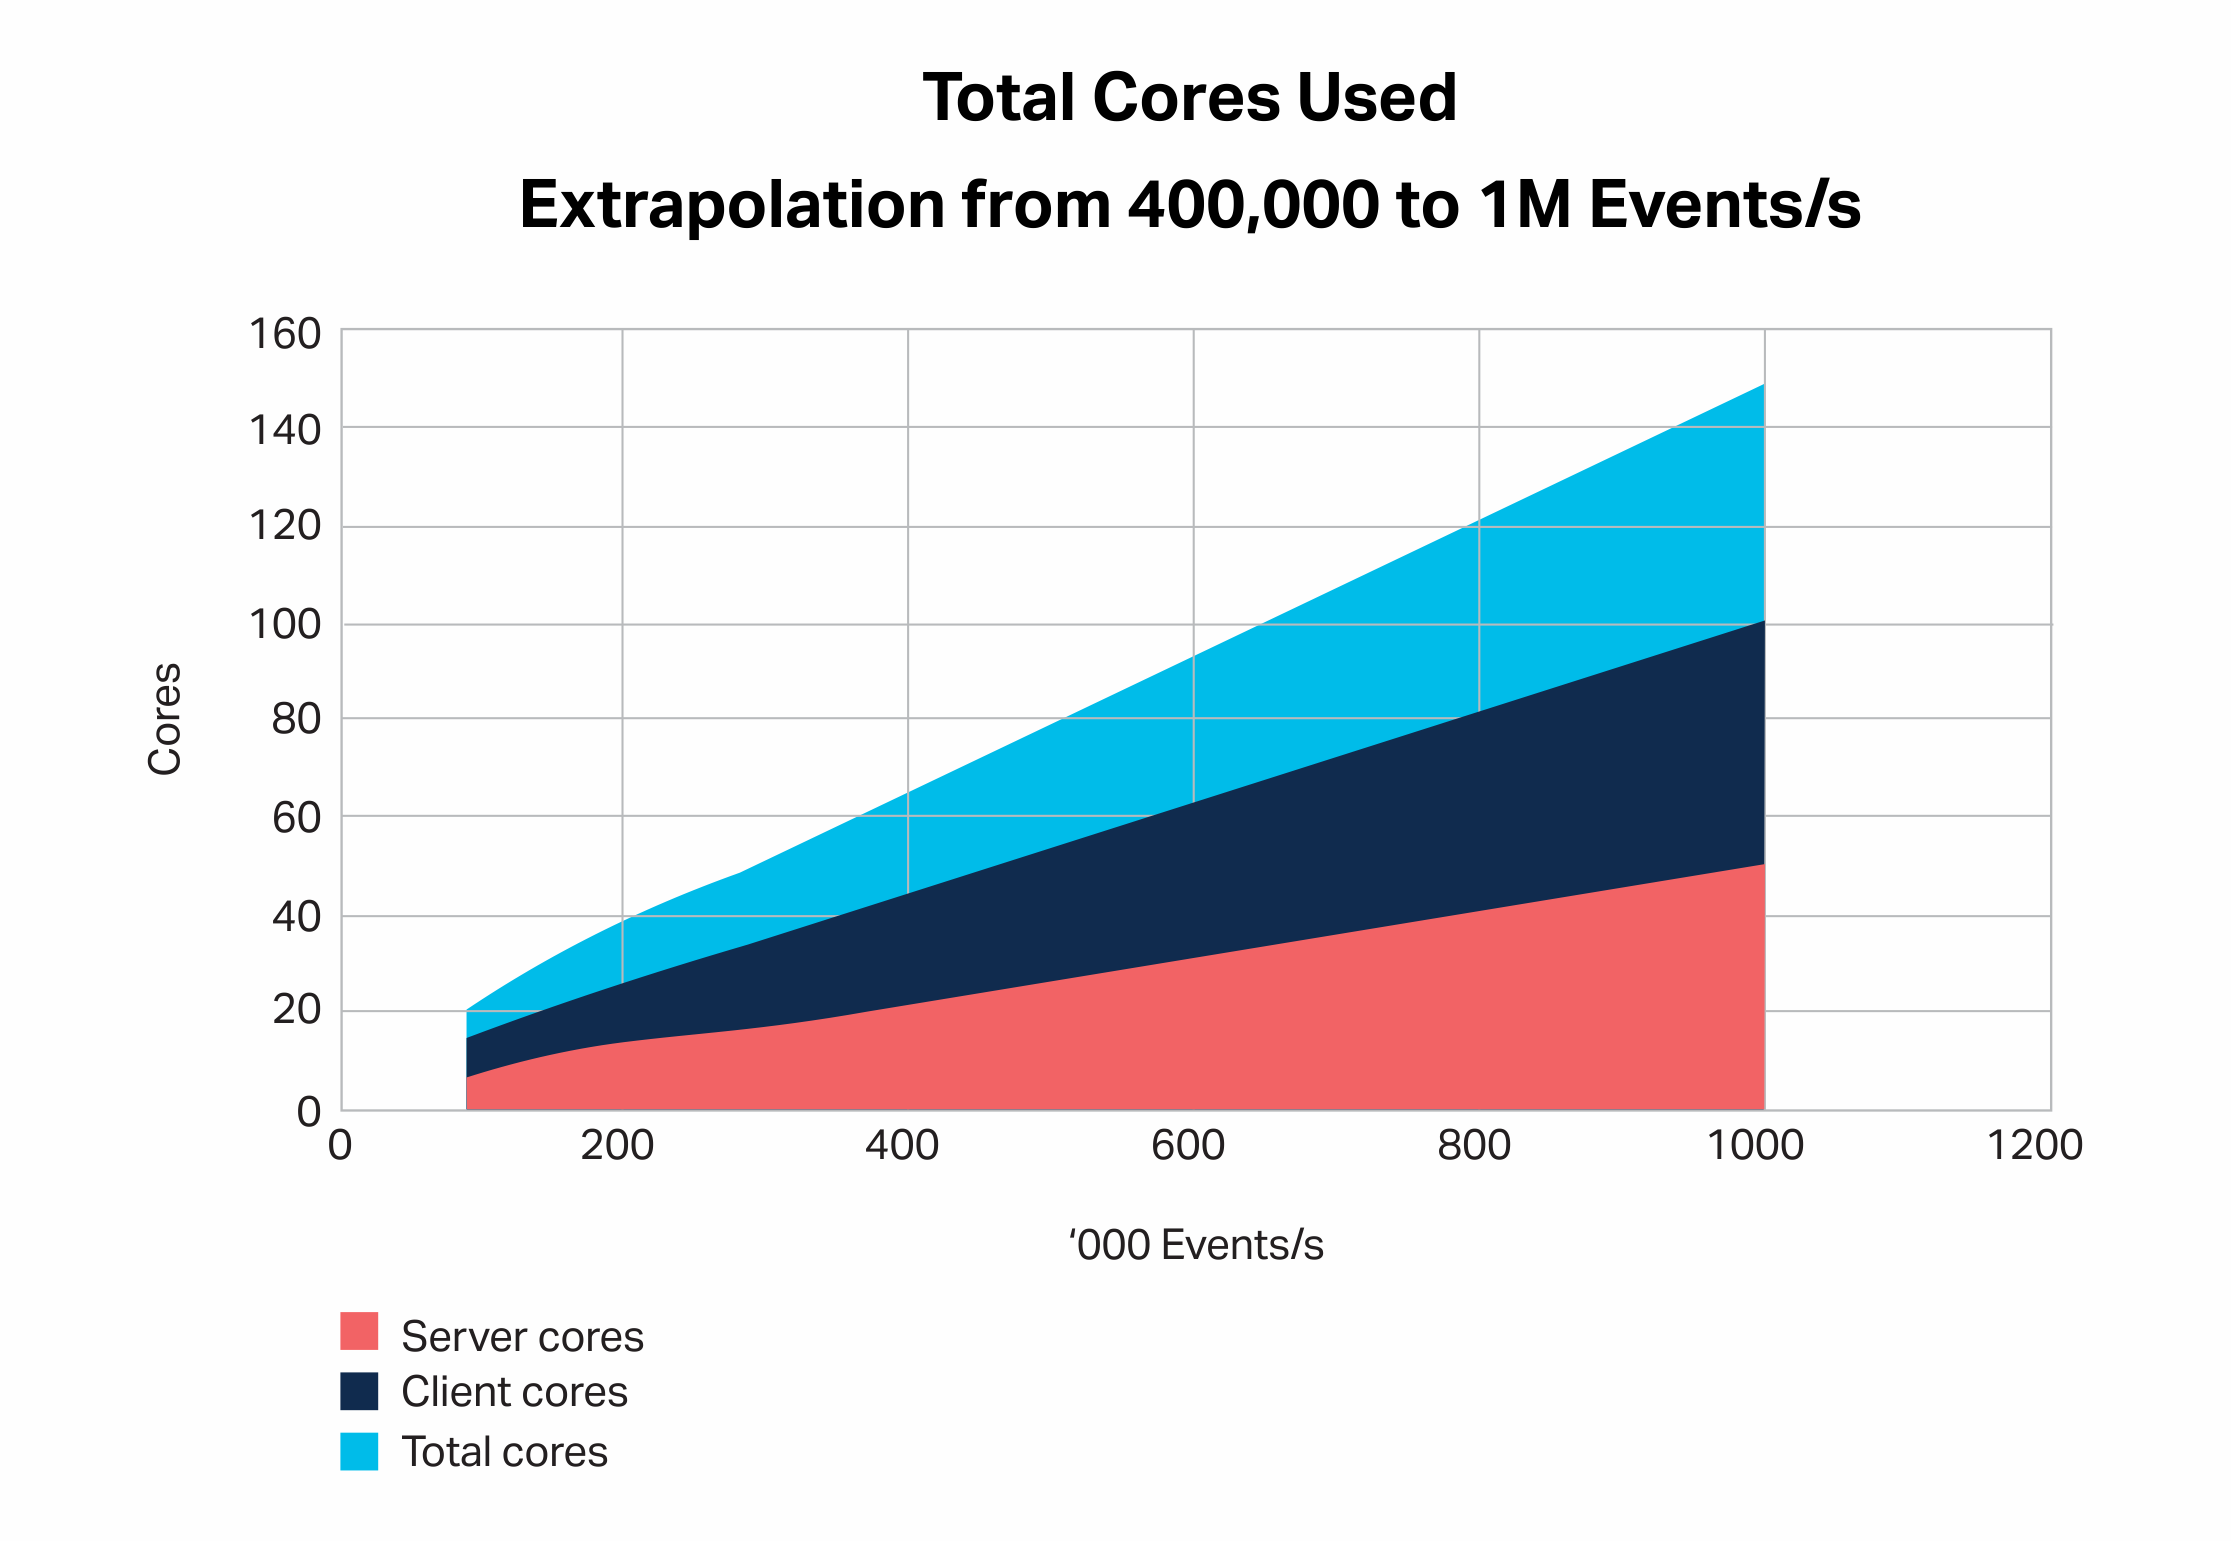
To achieve scalability the application must therefore be designed to scale out on multiple client instances, and have sufficient resources on the client-side.
2. Red Pill—Scaling is Harder
 Watch out for whirlpools (Source: Shutterstock – edited)
In the Red Pill version of the world, achieving linear scalability had some challenges.
Initial attempts to achieve linear scalability with Kongo failed. I could only get a 15% improvement with scale-out and 50% with scale-up. The fundamental problem turned out to be the large number of consumers. However, before finding the cause and managing to drastically reduce the number of consumers needed at higher loads, I tried to mitigate several issues I discovered running the benchmark with the large number of consumers. These insights may still be useful if your application really requires a large number (100s) of consumers, as scalability is harder to achieve with increasing numbers of consumers.
2.1 The Kafka “Key Parking Problem” (Hash Collisions)
At the end of the previous blog (6.2), I noted that during soak tests I was getting a “too many open files” exceptions which I fixed. It’s odd that I didn’t get this error when running the autonomic ramp-up tests. In hindsight, there was obviously something suspicious going on. Checking the logs I noticed that some of the consumers were actually timing out resulting in less than the expected total number of consumers running concurrently:
SensorConsumer 1036 closing after timeout (...)
2018-06-15 05:27:16,666 INFO [Thread-494] [org.apache.kafka.clients.consumer.internals.ConsumerCoordinator] [info:341] [Consumer clientId=consumer-494, groupId=KongoSensorConsumer] Revoking previously assigned partitions [kongo-sensor--115, kongo-sensor--114, kongo-sensor--116]
2018-06-15 05:27:16,667 INFO [Thread-494] [org.apache.kafka.clients.consumer.internals.AbstractCoordinator] [info:336] [Consumer clientId=consumer-494, groupId=KongoSensorConsumer] (Re-)joining group
To diagnose this problem I added code to Kongo to accurately keep track of the number of active consumer threads, and prevent an increase in the number of consumer threads if a decrease in threads due to timeouts is detected. But this doesn’t solve the underlying timeout problem. For some reason, some of the consumers were not receiving events.
How does consumer concurrency work? The number of partitions is important. For consumers in the same consumer group, the number of partitions must be greater than or equal to the number of consumers. I had sufficient partitions so this wasn’t the problem. I wondered if the data wasn’t being evenly balanced across the partitions? And if some partitions even had no data?
I tried using the kafka-consumer-groups console command to check if all the partitions had non-zero offsets. They did, so all partitions were “obviously” in use. Although, the offsets were not identical (would you expect them to be?). This gave me a valuable clue. Given that I was running Kongo as a benchmark the data created for each run was different to the previous runs. It was, therefore, possible that some partitions were being used in one run but not the next run. The final clue was when I noticed that the problem was only occurring for one of the two consumer types, SensorConsumers. The difference between RFID and Sensor consumers in the Kongo code was that the RFID topic didn’t use a key, but the Sensor topic did. The key was the location. For the benchmarking, I was using 100 warehouse locations + 200 trucks = 300 locations. This gives 300 keys for 300 partitions which I assumed was sufficient. To check I did some statistical analysis to see how many distinct values were produced using the kafka default partitioner, which uses this function:
return Utils.abs(Utils.murmur2(record.key())) % numPartitions;
However, using a 300 value location key only gives on average 200 unique values, so only 200 partitions are actually receiving data on any run. Only 200 consumer threads receive data, and the rest time out. A small set of key values will result in hashing collisions, so some partitions will get more messages than others, and some partitions may not get any messages at all! A Kafka Key/Partition “Parking Problem”?
 Car park “hash” collision (a variation of “Knuth’s Parking Problem” [See Note 1]). (Source: Shutterstock)
For Kafka keys to work correctly you have to ensure that:
number of key values >>>
number of partitions >=
number of consumers (in a group)
Some workarounds are to implement your own partitioner function, create a finer-grained key, or not use a key.
In Kongo, a simple partitioner function could be a 1-1 mapper that transforms the location GUID to a single partition (e.g. by using a stateful hashmap with the key=location and value, where value is a counter incrementing from 0, modulo the number of partitions, but would need some way to persist the state). A finer-grained location key (more values) can be created by concatenating location with say the metric name and works well (giving several thousand key values and a data in most partitions most of the time). Not using a key is the easiest solution and ensures perfect load balancing across all brokers. This is good for benchmarking, but in production, there may be good reasons for having a key. If event order matters, then you need keys and partitions. If you want to manually assign consumers to partitions you also need a key. If records are being used in Kafka streams or sent to Cassandra, then you need a key (or you can create a key just in time from something in the key-value). And if you want to use a topic cleanup policy of log compaction (which retains at least the latest value for each key) you need a key (the default policy is deleted which compacts based on time or size). In hindsight, a better key for the RFID topic in Kongo is Goods, as there are lots of Goods (10,000) and we want actions on Goods to be done in order (e.g. loads, unloads).
2.2 Cloudy With a Chance of Rebalancing Storms
To try and further understand what was limiting the scalability I took a closer look at the benchmarking harness I had written for Kongo to check that it was working as intended. The code was designed to start the target number of consumers as fast as possible before starting the Kongo IoT simulation and running the target load. However, it was apparent that it was not reliably starting the target number of consumer threads every run. Sometimes there were exceptions, there were rebalancing “storms”, and some of the consumers did not receive events from the start of the soak test. The autonomic code worked without any problems (probably due to the relatively slow and incremental increase in consumers as the load ramped up).
One of the exceptions suggested increasing the time for max.poll.interval.ms, which I tried without fixing the problem See here for more details of how max poll interval works.
The real cause of the problem turned out to be the way that Kafka balances consumers in a group across the partitions in topics. How does it work? Each consumer group has a single broker elected as the group coordinator. The first consumer in the group becomes the group leader. The leader is responsible for managing the assignment of partitions to each new consumer in the group, i.e. there’s one broker and one consumer responsible for rebalancing a consumer group. Here’s an extract from the documentation:
When a consumer wants to join a consumer group, it sends a JoinGroup request to the group coordinator. The first consumer to join the group becomes the group leader. The leader receives a list of all consumers in the group from the group coordinator (this will include all consumers that sent a heartbeat recently and are therefore considered alive) and it is responsible for assigning a subset of partitions to each consumer. It uses an implementation of PartitionAssignor interface to decide which partitions should be handled by which consumer. After deciding on the partition assignment, the consumer leader sends the list of assignments to the GroupCoordinator which sends this information to all the consumers. Each consumer only sees his own assignment – the leader is the only client process that has the full list of consumers in the group and their assignments. This process repeats every time a rebalance happens.
Not surprisingly this doesn’t scale, and for reliability, it’s important to wait until each consumer has been started and is polling (as it’s in the poll that everything related to the protocol happens) before trying to start another consumer. See Note 2 below for more resources.
Once this fix was introduced the consumers were consistently all ready to go by the time the soak test started. However, this didn’t make any appreciable difference to the throughput. The average consumer startup rate achieved was around 10 per second, an average time of 100ms, i.e. it takes a non-zero period of time to start a consumer thread. I wondered if there was a correlation between the time to start a new consumer and the number of consumers already in the group, but there wasn’t. However, the maximum time to start a new consumer was sometimes in excess of 20 seconds, due to particularly large rebalancing storms. This could be a downside of having a single consumer group with a very large number of consumers, better design options may be to use manual consumer partition assignment or a larger number of topics and consumer groups with fewer consumers per group.
2.3 Watch Out for Delays in Consumer Threads
 Whirlpools and rapids can cause serious delays in kayaking (Source: Adobe Stock)
It turned out that the main problem with achieving the expected scalability was a design flaw on the consumer side. I had originally used the Guava EventBus as a loosely coupled mechanism to deliver each event to many subscribed objects. EventBus is an asynchronous mechanism and allows the processing of each event (e.g. Sensor/Goods checks, and Goods/Trucks co-location events) to be carried out independently to the consumer thread, allowing the consumer to focus purely on getting events from Kafka and handing them over for processing as fast as possible. However, what I hadn’t realized was that the EventBus post method itself is actually synchronous, and waits until the event has been delivered to every subscriber before returning. It was simple enough to wrap the put method in a thread pool so that the consumers can immediately return to looping through the records and polling. This resulted in a significant reduction in the number of consumers needed to process events within the 1s SLA at higher loads (from hundreds to tens) and solved the scalability problem.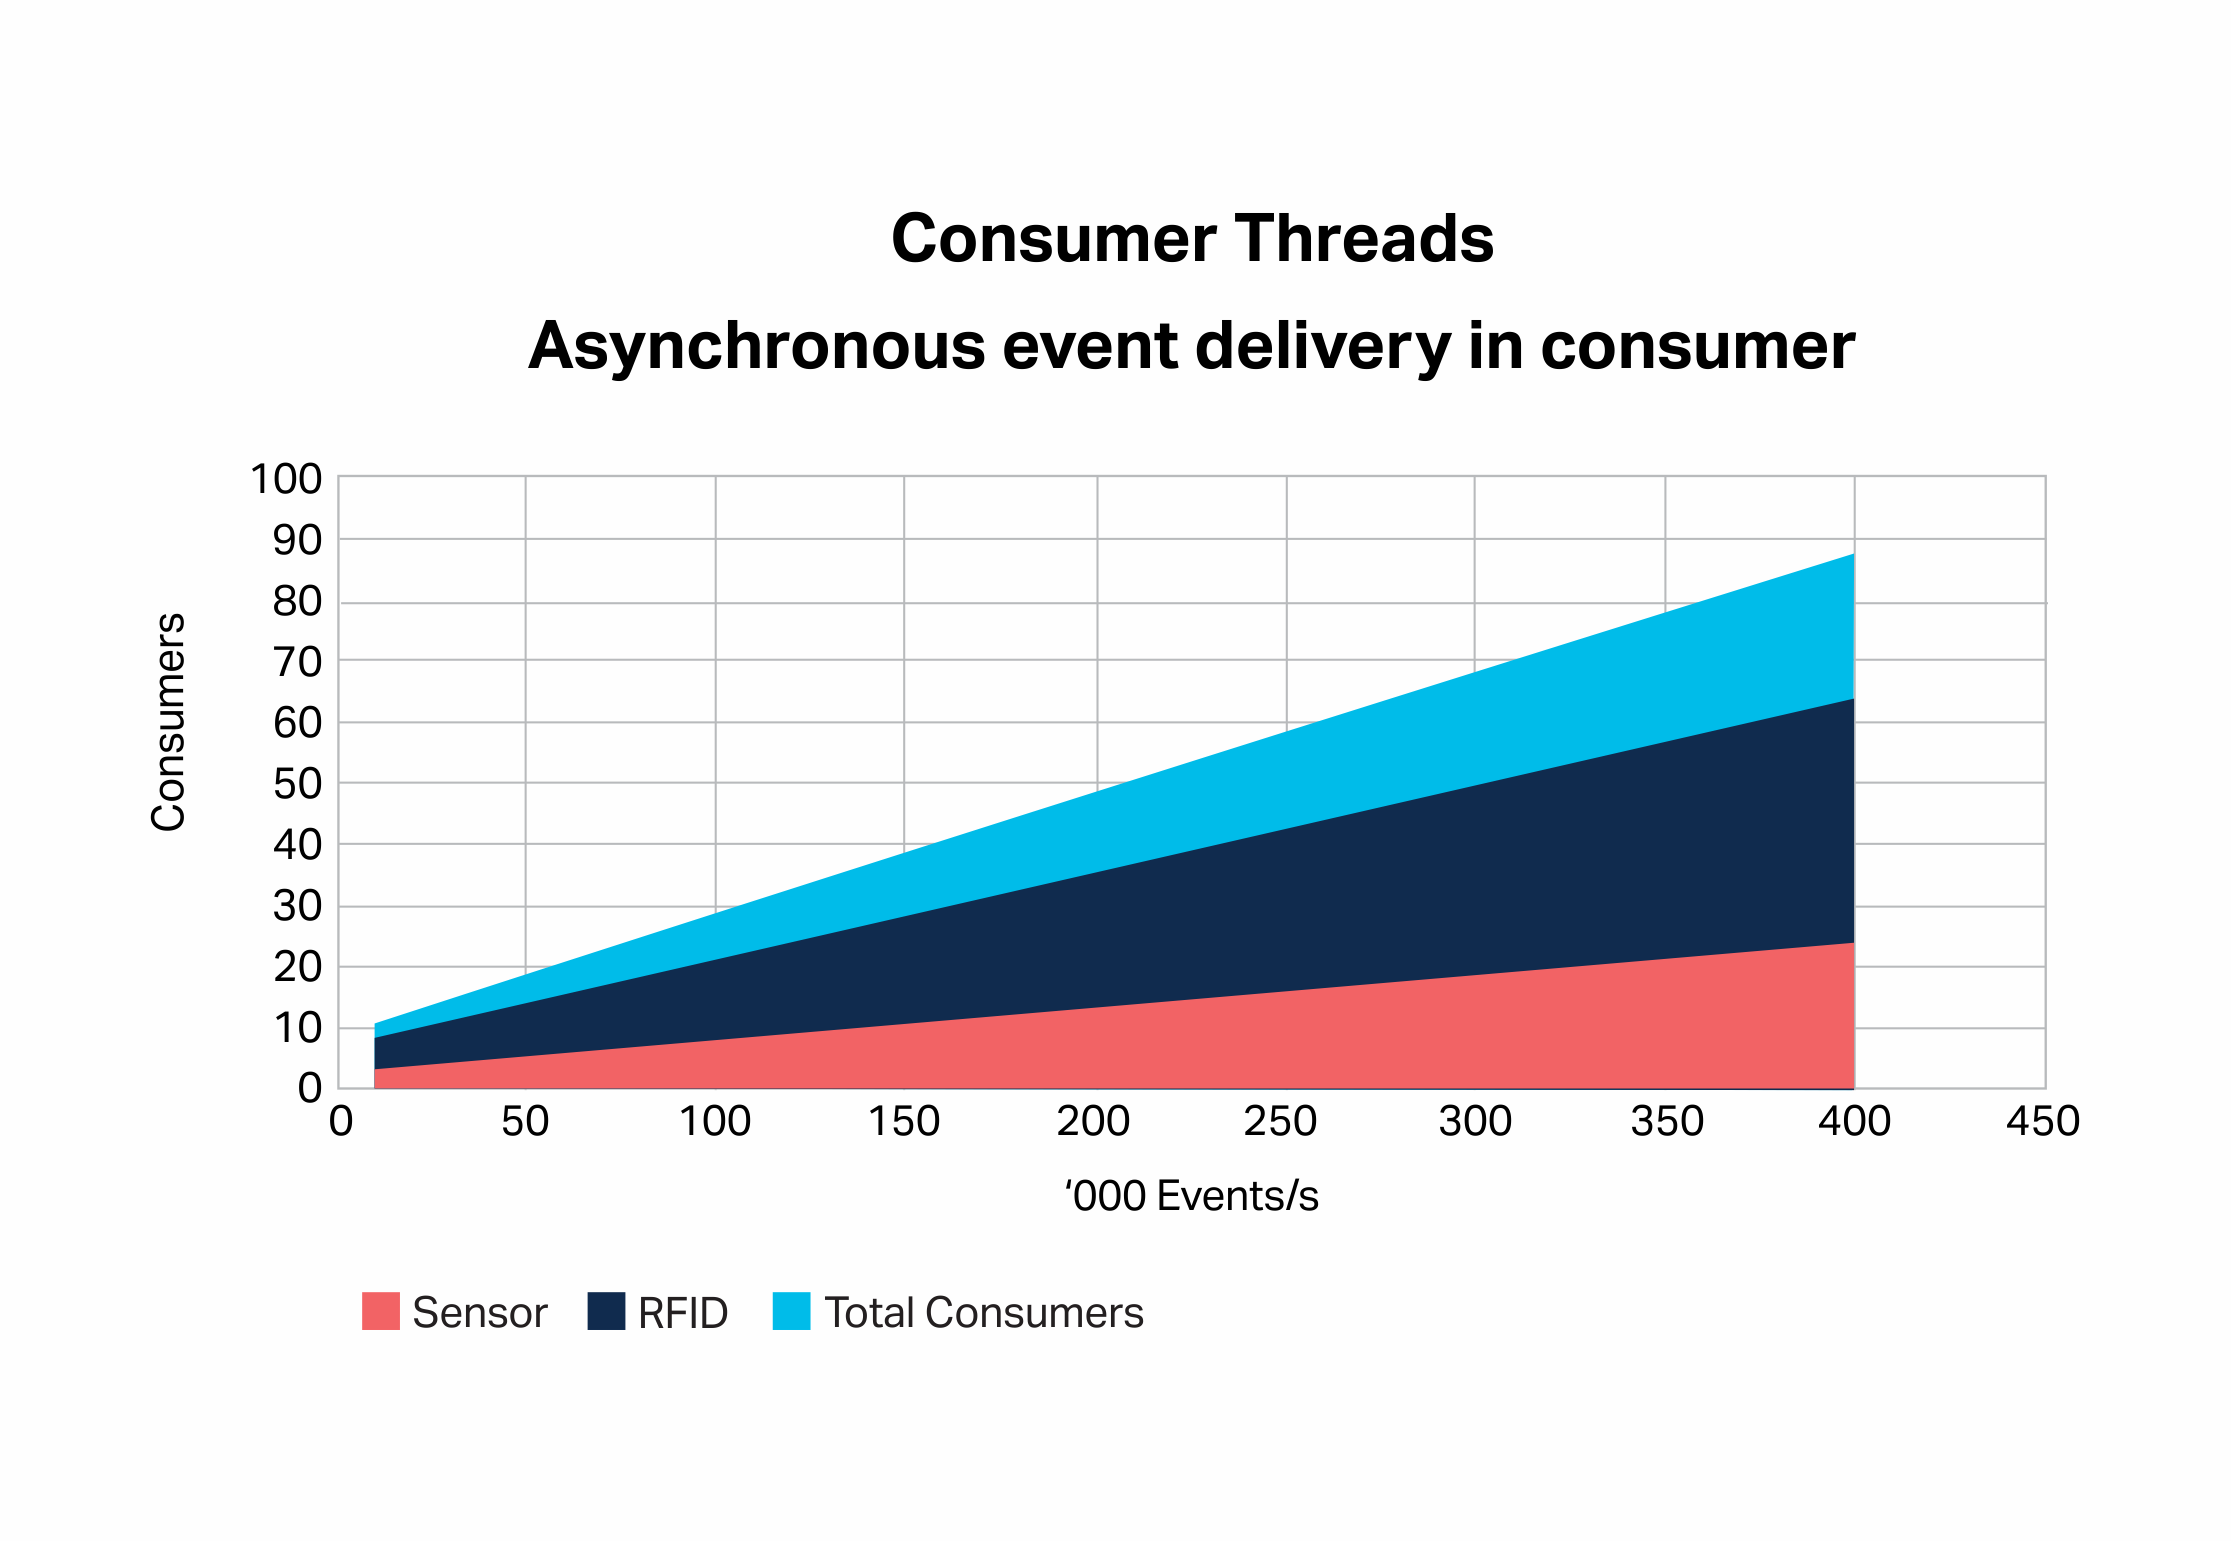
3. Kafka Scalability Conclusions
Which pill did you pick? In the Blue Pill world, Kafka is easy to scale with small numbers of consumers and sufficient client-side resources. In the Red Pill world, we encountered several scalability challenges related to having a large number of consumers. If you really need lots of consumers to make sure you have sufficient key values to ensure all the partitions are able to be used by the consumers and watch out for rebalancing storms. Reducing the number of consumers needed (e.g. by reducing the time spent processing events in the consumer) resulted in the biggest improvement in scalability.
The Instaclustr managed Kafka service makes it really easy to create different sized Kafka clusters for benchmarking and for provisioning flexible alternatives for production, but I didn’t try all the permutations. There are bigger instance sizes available (up to 8 cores per node using r4.2xlarge-4500 nodes), and another option for scaling is to add nodes incrementally (under the “Add” tab in the Instaclustr console). Scale-out and up, and multiple clusters are all useful strategies for scalability, however, larger instance sizes have less latency and are a good choice for applications requiring low latency.
Note 1: Knuth’s Parking Problem (dates from 1962!)
”A certain one-way street has m parking spaces in a row numbered 1 to m. A man and his dozing wife drive by, and suddenly, she wakes up and orders him to park immediately. He dutifully parks at the first available space…”
D. E. Knuth. Notes on “open” addressing. Unpublished memorandum, 1963. (Memo dated July 22, 1963. With annotation “My first analysis of an algorithm, originally done during Summer 1962 in Madison”
Referenced in: Alfredo Viola. Distributional Analysis of the Parking Problem and Robin Hood Linear Probing Hashing with Buckets. Discrete Mathematics and Theoretical Computer Science, DMTCS, 2010, 12 (2), pp.307-332. <hal-00990469>