In the previous blog, we deployed the Anomalia Machina application in a production-like Kubernetes environment. In this blog, we test it out and see many anomalies it can detect at scale on small Kafka and Cassandra Instaclustr production clusters.
Coming towards the end of our epic odyssey we now have a final challenge to overcome. Can we ride out the storm and scale the application?
 (Source: Shutterstock)
Kubernetes Resource Management (Replicas, Pods, Nodes)
I ended my initial Kubernetes experiments (Anomalia Machina 7) by accidentally exploding my Kubernetes cluster – I overloaded the Kubernetes worker nodes with too many Pods.
This time we’ll try and scale correctly. As we discovered, Kubernetes by default assumes pods require no resources, so will (try) to create an infinite number of Pods on a finite number of Nodes. Here’s the Kubernetes resource management documentation.
In the kubernetes configuration file, you can specify the minimum (requests) and maximum (limits) resources a Pod requires to run in terms of CPU and/or memory resources. This is how Pods are scheduled to Nodes:
When you create a Pod, the Kubernetes scheduler selects a node for the Pod to run on. Each node has a maximum capacity for each of the resource types: the amount of CPU and memory it can provide for Pods. The scheduler ensures that, for each resource type, the sum of the resource requests of the scheduled Containers is less than the capacity of the node.
If a Pod exceeds its resource limits then it might be evicted from the node. We won’t use limits.
It’s therefore easy enough to force Kubernetes to allocate only one Pod per Node, and at the same time prevent accidental overloading of the nodes, by setting the resources request to the number of cores each EC2 instance provides.
If we pick a small instance size, with say 2 cores, and use a resource request of 2 (cpu: “2000m” below) this gives us the flexibility to scale up in small increments:
|
1 2 3 4 5 6 7 8 9 10 11 12 13 14 15 16 17 18 19 20 21 22 23 24 |
apiVersion: apps/v1 kind: Deployment metadata: name: consumer-deployment labels: app: consumer spec: replicas: 1 selector: matchLabels: app: consumer template: metadata: labels: app: consumer spec: containers: - name: consumer image: myimages/consumer:latest ports: - containerPort: 1235 resources: requests: cpu: "2000m" |
This also gives us the opportunity to tune the application so it’s scalable in units of 2 cores. Our anomaly detection application pipeline consists of a Kafka consumer and a Cassandra client (and detector algorithm) in two separate thread pools.
After some experimentation, we settled on 1 thread for the Kafka consumer and 20 threads for the Cassandra client as optimal. Kafka consumers are fast and return many events per poll, and Kafka scales best with fewer consumers.
However, the writes and reads to/from Cassandra and the detector algorithm are slower, so more threads are needed to keep up with the consumer.
This also means that each Pod has 1 Kafka consumer and at least one Cassandra connection (Cassandra uses connection pooling by default, so the 20 threads can use 1 or more connections depending on configuration).
As we scale further, we need to ensure that the number of Kafka Partitions on the topic is >= the number of Pods (otherwise any excess Kafka consumers, and therefore Pods, will be idle). Cassandra doesn’t have a maximum connection limit, each Cassandra node will easily handle 100s of connections, and the Java client automatically manages the connection pool.
Anomaly Detection at Scale
Checking a few events for anomalies is easy, but what happens when there are many events to check?
 (Source: Shutterstock)
In order to scale the application, we need sufficient worker nodes/EC2 instances. As discovered in the last blog, Kubernetes by default doesn’t automatically manage the instances. Unlike pods and services, a node is not inherently created by Kubernetes: it is created externally by cloud providers.
In AWS EKS the simplest way of increasing worker nodes is to manually increase the desired and maximum values in the worker nodes auto-scaling group. Is it possible to actually get autoscaling working? Yes, in theory. There are two aspects to Kubernetes autoscaling: Pods and Nodes.
The Horizontal Pod Autoscaler scales the number of Pods based on triggers such as CPU utilisation. As such it’s probably not a good fit for this benchmarking use case where we want each Pod to run flat out and use close to 100% of the resources available to it.
The Cluster Autoscaler scales the worker nodes based on pending Pods. Although the Cluster Autoscaler is the de facto standard for automatic scaling in Kubernetes, it is not part of the main release. Here are some blogs on how to run the Cluster Autoscaler on AWS. And here’s a good blog explaining the differences between the scaling approaches.
One reason I ran into problems initially with pod scaling was that I naively assumed Kubernetes was more intelligent than it actually is (by default).
I thought it could somehow automatically work out resource usage for Pods. Well, it turns out that I wasn’t completely crazy. There’s also a second Pod autoscaler called the Vertical Pod Autoscaler which sets resource requests on pod containers automatically based on historical usage. This is a good blog which covers all three autoscalers.

Odysseus had a nasty encounter with the giant shepherd Polyphemus but used the flock of sheep to escape the blinded Cyclops. (Source: Shutterstock)
Results: 18,000 Anomaly checks per second
Finally, we can reveal some results. I spun up (small) production sized Cassandra (version 3.11.3) and Kafka (version 2.1.0) clusters in the same region as my AWS EKS cluster. Here are the cluster and the worker nodes and producer instance details:
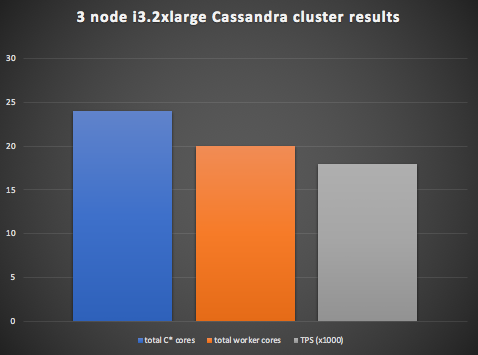
Cassandra Cluster
3 nodes x 8 cores = 24 cores (i3.2xlarge, 1900GB SSD, 61GB RAM, 8 cores)
Kafka Cluster
3 nodes x 4 cores = 12 cores (r4.xlarge-750, 750GB Disk, 30.5GB RAM, 4 cores)
Kubernetes Worker Nodes
10 nodes x 2 cores = 20 cores (c5.large)
Kafka Producer
1 node x 8 cores = 8 cores (m4.2xlarge)
For simplicity, I ran the Kafka producer flat out (around 2 million TPS) for long enough to create sufficient data (billions of events) in Kafka to run the rest of the pipeline and produce consistent results. I then gradually increased the number of Pods from 1 to the maximum number of worker nodes available, 10, by increasing the number of replicas with this command:
|
1 |
kubectl scale deployment consumer-deployment --replicas=10 |
Using the Prometheus monitoring metrics, the maximum throughput obtained for the business level metric (Anomaly Checks per second) was 18,000 TPS, with all the worker nodes and Cassandra cluster at 100% CPU Utilization.
Unsurprisingly, the throughput didn’t increase further with more worker nodes. The Kafka cluster had plenty of spare CPU capacity. Here’s a graph showing these results:
What’s also informative is to understand the throughput (events in and out) for each sub-system (Kafka load generator, Kafka cluster, Kubernetes cluster, and Cassandra cluster), and compute the total system throughput as the sum of the subsystem throughputs.
This will give us extra insights such as, how much of the total workload each subsystem handles, and how many events in total are required to perform each anomaly check.
We assume a Kafka load generator rate of Z events per second, and a steady-state (i.e. all subsystems keep up with this event rate). Specifically, this means that the business metric, Anomaly Checks per second (step 9 below) is also equal to Z.
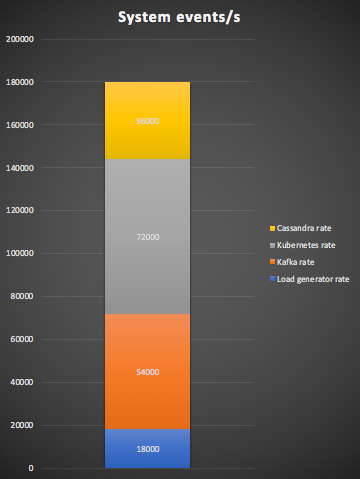
The subsystem throughputs are: Kafka load generator (step 1: 1 x Z), Kafka cluster (steps 2, 3, 10: 3 x Z), Kubernetes cluster (steps 4, 5, 8, 9: 4 x Z), and Cassandra cluster (steps 6, 7: 2 x Z). The total system throughput is, therefore: (1 + 3 + 4 + 2) x Z = 10 x Z. i.e. The system throughput is an order of magnitude higher than the business metric.
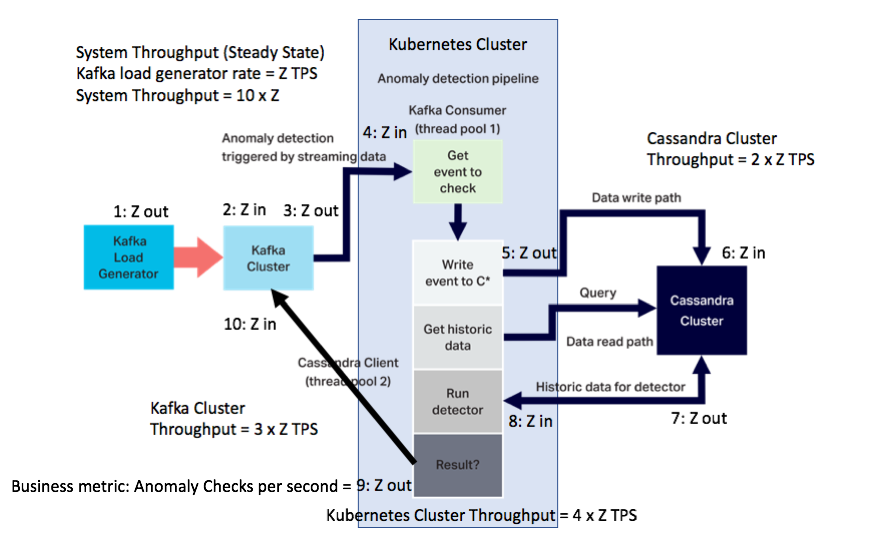
For the initial small production cluster this gives a system throughput of: 18,000 x 10 = 180,000 events/s. This stacked bar graph shows the breakdown for the subsystems and the total. The load generator rate on the bottom is the same value as Anomaly Checks per second (18,000):
Next blog we’ll keep scaling the system and see how far we can go.