Overview
NetApp has expanded its Cadence® offering on the NetApp Instaclustr Managed Platform to include AWS Graviton3 instances. In announcing that release, we promised to deliver enhanced price-performance.
To prove this claim, we conducted benchmark tests comparing the previously available M5 series of instances powered by x86 processors with the new M7g instances utilizing ARM-based AWS Graviton3 processors.
The primary performance metric we used to measure this claim is the rate of successful workflow executions per second. This gives us a good approximation of instance performance when running Cadence.
This blog documents the detailed process that we followed in conducting this testing and the potential cost savings of up to 58% that we demonstrated based on the improved price-performance of the graviton-based instances.
Benchmarking setup
To generate the test workload we utilized the cadence-bench tool to generate standardized bench loads on a series of Cadence test clusters.
Note: To minimize variables in the benchmarking process, we only used the basic loads functionality that does not require the Advanced Visibility feature.
As per the cadence-bench README, it requires the “Cadence Server” and “Bench Workers.”
The term “Cadence Server” refers to the Cadence frontend, matching, history and internal worker services operating within the Cadence clusters. “Bench Workers” denotes the external worker processes that execute on AWS EC2 instances to generate the benchmark loads on the “Cadence Server”. Below we’ve outlined the configurations we’ve used for benchmarking:
Cadence Server
At Instaclustr, a managed Cadence cluster relies on a managed Apache Cassandra® cluster for its persistence layer. The test Cadence and Cassandra clusters were provisioned in their own VPCs and utilized VPC Peering for inter-cluster communication.
We provisioned 8 test sets comprising of both Graviton3 and x86 Cadence clusters and the corresponding Cassandra clusters, as shown in the table below. The Cassandra clusters were sized so that they would not be a limiting factor in the benchmark results.
| Test Set | Application | Node Size | Number of Nodes |
| M7g.large | Cadence | CAD-PRD-m7g.large-50
(2 vCPU + 8 GiB Memory) |
3 |
| Cassandra | CAS-PRD-r7g.xlarge-400
(4 vCPU + 32 GiB Memory) |
6 | |
| M5ad.large | Cadence | CAD-PRD-m5ad.large-75
(2 vCPU + 8 GiB Memory) |
3 |
| Cassandra | CAS-PRD-r7g.xlarge-400
(4 vCPU + 32 GiB Memory) |
6 | |
| M7g.xlarge | Cadence | CAD-PRD-m7g.xlarge-50
(4 vCPU + 16 GiB Memory) |
3 |
| Cassandra | CAS-PRD-r7g.2xlarge-800
(8 vCPU + 64 GiB Memory) |
6 | |
| M5ad.xlarge | Cadence | CAD-PRD-m5ad.xlarge-150
(4 vCPU + 16 GiB Memory) |
3 |
| Cassandra | CAS-PRD-r7g.2xlarge-800
(8 vCPU + 64 GiB Memory) |
6 | |
| M7g.2xlarge | Cadence | CAD-PRD-m7g.2xlarge-50
(8 vCPU + 32 GiB Memory) |
3 |
| Cassandra | CAS-PRD-r7g.4xlarge-800
(16 vCPU + 128 GiB Memory) |
6 | |
| M5ad.2xlarge | Cadence | CAD-PRD-m5ad.2xlarge-300
(8 vCPU + 32 GiB Memory) |
3 |
| Cassandra | CAS-PRD-r7g.4xlarge-800
(16 vCPU + 128 GiB Memory) |
6 | |
| M7g.4xlarge | Cadence | CAD-PRD-m7g.4xlarge-50
(16 vCPU + 64 GiB Memory) |
3 |
| Cassandra | CAS-PRD-r7g.4xlarge-800
(16 vCPU + 128 GiB Memory) |
12 | |
| M5ad.4xlarge | Cadence | CAD-PRD-m5ad.4xlarge-500
(16 vCPU + 64 GiB Memory) |
3 |
| Cassandra | CAS-PRD-r7g.4xlarge-800
(16 vCPU + 128 GiB Memory) |
12 |
Bench workers
AWS EC2 instances were used to run the Bench Workers with each EC2 instance running multiple Bench Workers. To minimize network latency between the Cadence Server and Bench Workers, the EC2 instances were provisioned within the same VPC as the corresponding Cadence cluster.
For the majority of the test sets, we used C4.xlarge instances, while C4.4xlarge instances were used for the M7g.4xlarge and M5ad.4xlarge test sets to guarantee that the Bench Workers could produce sufficient bench loads on the Cadence clusters. The following are the configurations of the EC2 instances used in this benchmarking:
| Bench Worker Instance Size | Number of Instances |
| C4.xlarge (4 vCPU + 7.5 GiB Memory) | 3 |
| C4.4xlarge (16 vCPU + 30 GiB Memory) | 3 |
Bench loads
We used the following configurations for the basic bench loads to be generated on the Cadence clusters:
|
1 2 3 4 5 6 7 8 9 10 11 12 13 14 15 16 17 18 19 20 21 22 23 |
{ "useBasicVisibilityValidation": true, "contextTimeoutInSeconds": 10, "failureThreshold": 0.01, "totalLaunchCount": variable, "routineCount": variable, "waitTimeBufferInSeconds": 300, "chainSequence": 12, "concurrentCount": 1, "payloadSizeBytes": 1024, "executionStartToCloseTimeoutInSeconds": 300 } |
All configuration properties, except for totalLaunchCount and routineCount, were kept constant across the different test sets. The totalLaunchCount property defines the total number of stress workflows to be generated and was used to control the duration of the bench runs. The routineCount property specifies the number of parallel launch activities that initiate the stress workflows. This affects the rate of generating concurrent test workflows and can be used to evaluate Cadence’s ability to handle concurrent workflows.
Below are the variable bench load configurations used for each test set, along with the corresponding number of task lists. The total number of Bench Workers was equal to the number of task lists, and hence the number of Bench Workers on each EC2 instance was one-third of the number of task lists.
| Test Set | Bench Load Configurations | Number of Task Lists |
| M7g.large | totalLaunchCount: 100000
routineCount: 5 |
15 |
| M5ad.large | totalLaunchCount: 50000
routineCount: 3 |
15 |
| M7g.xlarge | totalLaunchCount: 150000
routineCount: 10 |
30 |
| M5ad.xlarge | totalLaunchCount: 80000
routineCount: 5 |
30 |
| M7g.2xlarge | totalLaunchCount: 350000
routineCount: 20 |
60 |
| M5ad.2xlarge | totalLaunchCount: 180000
routineCount: 10 |
60 |
| M7g.4xlarge | totalLaunchCount: 500000
routineCount: 28 |
120 |
| M5ad.4xlarge | totalLaunchCount: 280000
routineCount: 16 |
120 |
These bench loads were designed to apply reasonable and sustainable pressure on the Cadence test clusters, bringing them close to their maximum capacity without causing degradation. The following criteria were used to verify this objective:
- CPU utilization on Cadence nodes mostly ranged between 70-90%.
- Available memory on Cadence nodes was greater than 500 MB.
- Failed or timed-out workflow executions were less than 1% of the total workflow executions.
We used cron jobs on the Bench Worker instances to automatically trigger bench loads every hour.
Results
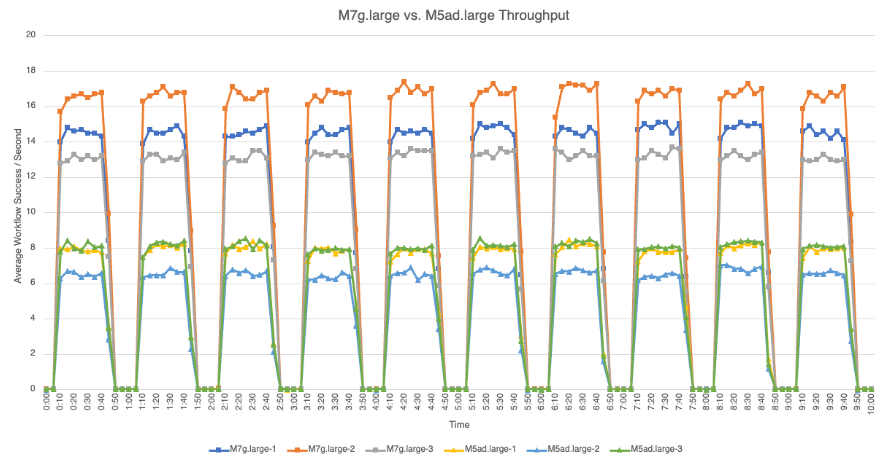
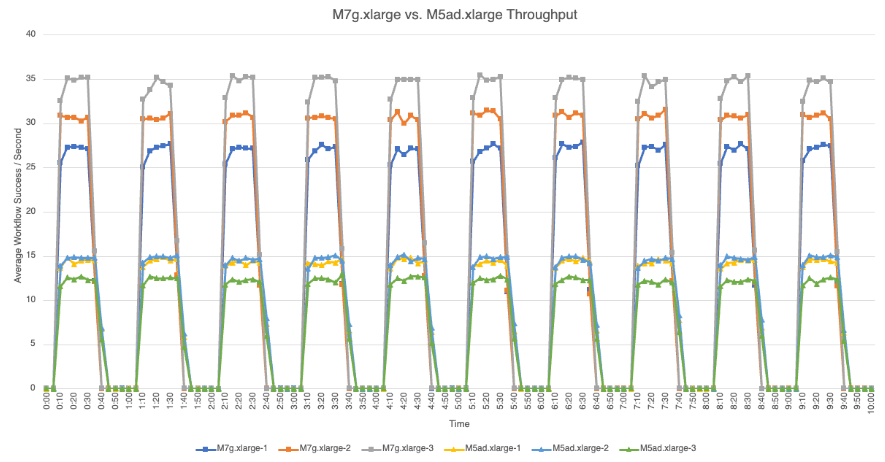
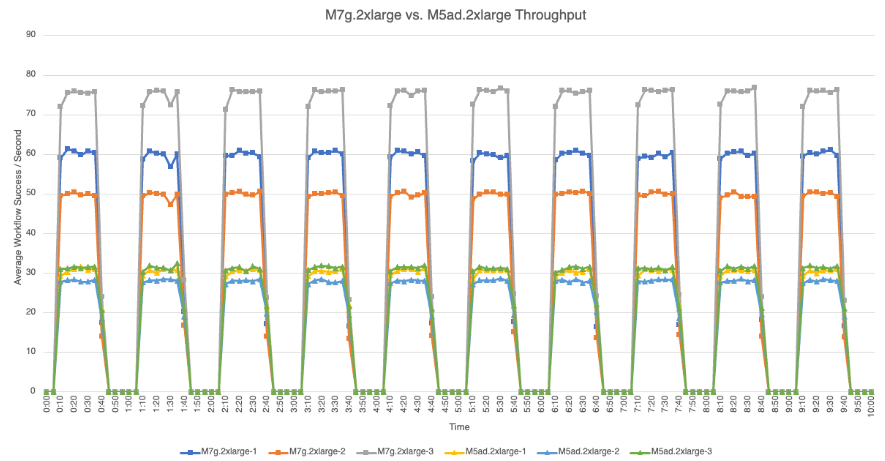
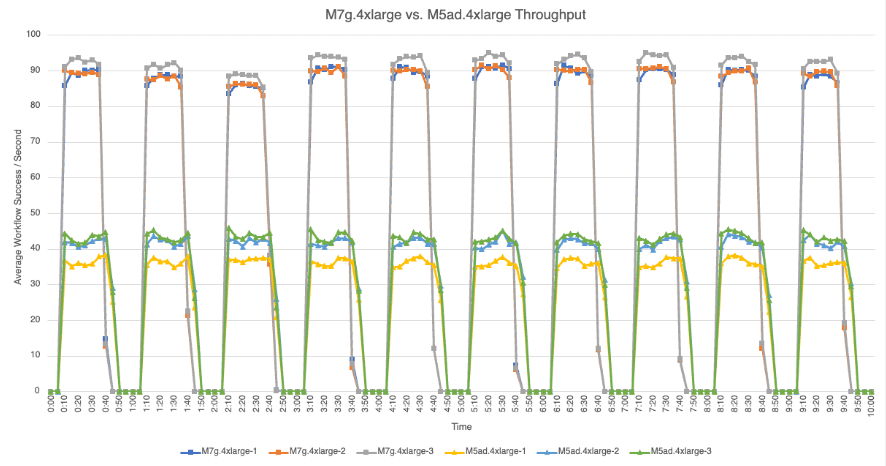
The table below shows the recorded average successful workflow executions for the corresponding Graviton3 and x86 node sizes under bench loads. Overall, M7g node sizes demonstrate approximately a 100% performance gain.
| Graviton3 Node Size | Workflow Success / Sec | x86 Node Size | Workflow Success / Sec | Performance Gain |
| CAD-PRD-m7g.large-50 | 14.8 | CAD-PRD-m5ad.large-75 | 7.5 | 97.3% |
| CAD-PRD-m7g.xlarge-50 | 30.7 | CAD-PRD-m5ad.xlarge-150 | 13.8 | 122.4% |
| CAD-PRD-m7g.2xlarge-50 | 61.7 | CAD-PRD-m5ad.2xlarge-300 | 29.9 | 106.4% |
| CAD-PRD-m7g.4xlarge-50 | 90.1 | CAD-PRD-m5ad.4xlarge-600 | 40.5 | 122.5% |
The following graphs provide detailed views of the average number of successful workflow executions per second that each node achieved during bench loads for each test set.
M7g.large vs. M5ad.large
M7g.xlarge vs. M5ad.xlarge
M7g.2xlarge vs. M5ad.2xlarge
M7g.4xlarge vs. M5ad.4xlarge
Conclusion
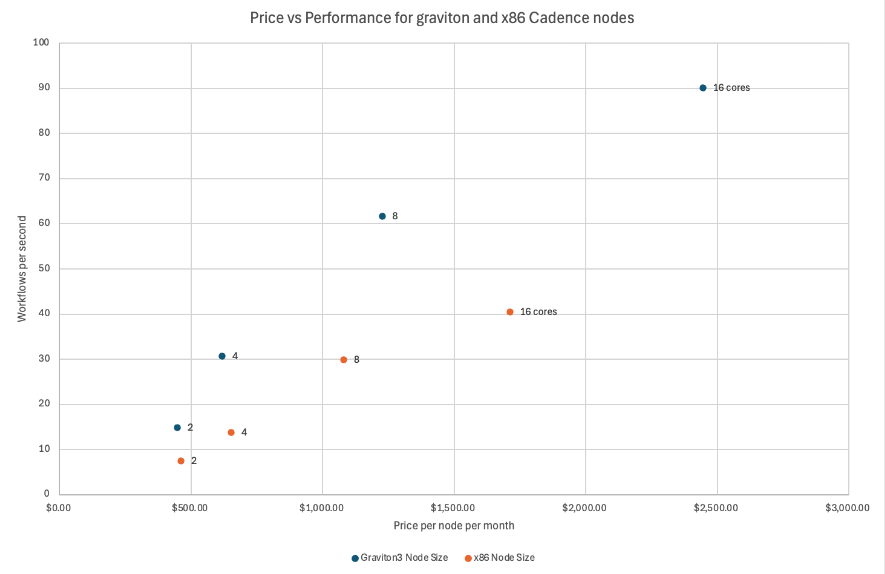
Our benchmarking tests demonstrate that AWS Graviton3-powered M7g instances offer substantial performance improvements over the x86-powered M5ad instances for Cadence clusters. As illustrated in the table and graph below, the M7g node sizes consistently delivered approximately twice the performance of their M5ad counterparts. This significant enhancement in performance underscores the potential benefits of migrating to Graviton3-powered Cadence node sizes.
The table and graph also compare the prices of M7g and M5ad node sizes. The prices are based on the “Run In Instaclustr Account” pricing in USD for the AWS region us-east-1 (this pricing includes not only the instance cost but also estimated network and storage cost and the Instaclustr management fee). Notably, the CAD-PRD-m7g.xlarge-50 node size with 4 vCPU cores and CAD-PRD-m7g.2xlarge-50 with 8 vCPU cores emerge as the optimal choices for migration to Graviton3-powered Cadence nodes, offering the lowest Price / Workflow Per Second.
| Graviton3 Node Size | Workflow Success / Sec | Price/Node/Month | Price / Workflow Per Sec | x86 Node Size | Workflow Success / Sec | Price/Node/Month | Price / Workflow Per Sec | Potential Savings |
| CAD-PRD-m7g.large-50 | 14.8 | $448.02 | $30.27 | CAD-PRD-m5ad.large-75 | 7.5 | $461.41 | $61.52 | 50.8% |
| CAD-PRD-m7g.xlarge-50 | 30.7 | $617.63 | $20.12 | CAD-PRD-m5ad.xlarge-150 | 13.8 | $652.83 | $47.31 | 57.5% |
| CAD-PRD-m7g.2xlarge-50 | 61.7 | $1,226.85 | $19.88 | CAD-PRD-m5ad.2xlarge-300 | 29.9 | $1,080.66 | $36.14 | 45.0% |
| CAD-PRD-m7g.4xlarge-50 | 90.1 | $2,445.28 | $27.14 | CAD-PRD-m5ad.4xlarge-600 | 40.5 | $1,711.31 | $42.25 | 35.8% |
Sign up for a free trial on our Console today to see the improved performance with our managed Cadence on Graviton3 or migrate your existing Cadence clusters to Graviton3 node sizes using our in-place Vertical Scaling.