When dealing with large-scale deployments, ensuring data reliability and minimal performance impact can be challenging. OpenSearch’s Cross-Cluster Replication (CCR) introduces a solution by replicating data across clusters to improve disaster recovery and availability. To understand the real-world impact of CCR, we performed detailed OpenSearch performance benchmarking, focusing on metrics like CPU usage, throughput, latency, and replication lag.
This blog explores our key findings, providing actionable insights for anyone looking to optimize their OpenSearch clusters with CCR.
Why test OpenSearch performance for CCR?
Cross-cluster replication enables secondary clusters (followers) to replicate data from a primary cluster (leader). While it increases redundancy, it’s crucial to measure its effect on cluster performance. Our two goals were:
- Assess how CCR impacts OpenSearch cluster performance.
- Measure replication lag to evaluate its reliability under varying workloads.
This study evaluates the performance impact of cross-cluster replication (CCR) on OpenSearch clusters, focusing on CPU usage, indexing throughput, latency, and replication lag. Using OpenSearch 2.16.0, we established a baseline without CCR and assessed the effects of active replication with 1, 2, and 3 follower clusters. Key findings include:
- Leader CPU usage: Increased by 12.41% during indexing and 9.45% overall with 3 followers
- Indexing throughput: Decreased by 3.42% with 3 followers
- Indexing latency: 50th percentile latency increased by 1.61% and 90th percentile latency by 3.91% with 3 followers
- Search throughput and latency: Remained largely unaffected
- Replication lag: Averaged 4380.68 operations during indexing, consistently less than 20 seconds behind the leader
These results suggest that CCR can be effectively implemented to enhance data redundancy and availability without significant degradation of service, supporting its use in production environments for improved disaster recovery and data distribution.
Testing methodology
To ensure accurate and reliable OpenSearch performance benchmarking, we established a baseline performance for clusters without CCR. We then incrementally tested with one, two, and three follower clusters using OpenSearch Benchmark and a PMC workload (574,199 academic documents). Tests were conducted in the AWS us-east-1 region with r6g.xlarge instances running OpenSearch 2.16.0. We had two goals for this performance test:
- Evaluate the performance impact of an OpenSearch cluster being a cross-cluster replication leader with active replication occurring and see how the performance impact scales with multiple followers. This helped us understand what sort of performance headroom is required to safely add replication to a cluster’s workload.
- Monitor the replication lag between a leader and its followers. For cross-cluster replication, this is quantified by the number of replication operations by which a follower lags behind the leader. This analysis provided insight into acceptable levels of replication lag and identified when such lag might indicate potential issues.
Baseline for OpenSearch performance benchmarking
First, we established a performance baseline of a cluster without cross-cluster replication and performed 3 test runs using the OpenSearch Benchmark tool. The OpenSearch Benchmark configuration remained the same across all test runs (baseline, 1, 2, and 3 followers). We chose the following OpenSearch Benchmark configuration:
| Parameter | Description | Chosen value | Rationale |
| Workload | Pre-defined dataset and sequence of OpenSearch operations to run against that dataset | Built-in PMC workload that contains academic medical articles | The PMC workload represents a general-purpose use case, with an appropriate mix of indexing and searching tasks for our testing |
| Bulk indexing clients | Number of clients OpenSearch Benchmark will use for indexing tasks | 1 | Chosen via preliminary testing, to ensure baseline CPU Usage was as close to 50% as possible |
| Search clients | Number of clients OpenSearch Benchmark will use for search tasks | 3 | Chosen via preliminary testing, to ensure baseline CPU Usage was as close to 50% as possible |
| Target search throughput | Number of search requests per second that OpenSearch Benchmark will attempt to perform across all clients combined | 50 | Chosen via preliminary testing, to ensure baseline CPU Usage was as close to 50% as possible |
These parameters were chosen so the baseline test would not exceed 50% mean CPU usage, to allow headroom for adding followers in later tests without affecting cluster health.
All testing was performed in the AWS us-east-1 region, using OpenSearch 2.16.0 (the latest version at the time this testing was performed), and 3 cluster nodes using the r6g.xlarge instance size. The OpenSearch Benchmark tool was run from a dedicated r6g.xlarge instance in a different VPC but the same region as the test cluster to minimise network latency as a factor.
The metrics we collected from this baseline case were:
- The CPU usage of the cluster nodes.
- the mean throughput for the index-append and term tasks as reported by OpenSearch Benchmark.
- 50th and 90th percentile latencies for the index-append and term tasks.
The index-append task indexes the entire PMC article dataset of 574,199 documents using the bulk indexing API to index 500 documents at a time. The term task performs a search request with a term query for documents that contain the term “physician”.
Collecting mean throughput gives us a measure of the overall performance of indexing/searching, while collecting 50th and 90th percentile latencies give insight into the typical (50th percentile) and near-worst-case (90th percentile) latencies.
The OpenSearch Benchmark metrics were taken directly from the output of the tool and then aggregated across each test run to produce a mean result:
| Metric | Task | Unit | Round 1 | Round 2 | Round 3 | Mean |
| Mean Throughput | index-append | docs/s | 890.54 | 861.06 | 896.86 | 882.82 |
| 50th percentile latency | index-append | ms | 505.9 | 502.36 | 503.36 | 503.87 |
| 90th percentile latency | index-append | ms | 654.64 | 655.74 | 637.53 | 649.30 |
| Mean Throughput | term | ops/s | 49.99 | 49.98 | 49.99 | 49.99 |
| 50th percentile latency | term | ms | 10.73 | 11.58 | 11.87 | 11.39 |
| 90th percentile latency | term | ms | 12.17 | 12.93 | 13.43 | 12.84 |
CPU usage was measured via the Instaclustr Monitoring API, using the node with the highest usage in each test round, excluding the initial warmup period of OpenSearch Benchmark. The CPU usage from each run was broken down into overall mean CPU usage, mean during indexing peak, and mean during searching peak, and then aggregated to produce an overall result:
| CPU usage period | Round 1 | Round 2 | Round 3 | Mean |
| Overall mean CPU usage | 27.60% | 30.60% | 31.70% | 29.97% |
| During indexing peak | 37.80% | 38.20% | 40.80% | 38.93% |
| During searching peak | 50.20% | 54.70% | 59.30% | 54.73% |
We recorded the indexing and searching peak separately to the overall mean CPU usage as the CPU usage changes dramatically throughout the test, based on the tasks being performed at the time, for example:

Figure 1: The different lines on the graph denote the CPU usage for each of the cluster’s three nodes during one test run.
This also allowed us to see the impact of replication on indexing and searching performance specifically.
Active replication testing
Once we established the baseline performance level with cross-cluster replication disabled, we repeated the same testing again but this time for cross-cluster replication leader clusters with 1, 2, and 3 actively replicating followers. In addition to the CPU usage, indexing and search mean throughput and latency recorded in the baseline test, we also recorded the cross-cluster replication lag from each follower for the entire test duration. The lag was calculated by subtracting the follower cluster’s reported checkpoint value from leader cluster’s reported checkpoint value at the same point in time (or as close as possible). The lag represents how many replication operations a follower is behind its leader cluster and cannot simply be expressed as a time delay.
To more easily test cross-cluster replication using OpenSearch Benchmark, we used a modified version of the “pmc” workload that used a unique index name for each test run. We did this by changing all references to the pmc index name to pmc{{ now | int }} in an openearch-benchmark-workloads branch. This means each test run would use a unique index name, like pmc1741753021. Without this we would need to manually delete the pmc index from the leader and followers in between test runs to avoid replication errors. The default workload behaviour would delete and re-create the test index on the leader, but since these changes are not replicated to followers, the leader and follower would end up with inconsistent state.
Before starting the OpenSearch Benchmark tests, we configured the followers to automatically replicate any indices matching the pmc* pattern, using this API request:
|
1 2 3 4 5 6 7 8 9 10 |
curl -X POST -u <replication username>:<replication user password> "<cluster endpoint>:9200/_plugins/_replication/_autofollow" -H 'Content-Type: application/json' -d' { "leader_alias": "<leader cluster ID>", "name": "pmc-autofollow", "pattern": "pmc*", "use_roles":{ "leader_cluster_role": "cross_cluster_replication_leader_full_access", "follower_cluster_role": "cross_cluster_replication_follower_full_access" } }' |
Results
| OpenSearch-Benchmark Metric | Task | Unit | Baseline Mean | 1 Follower | 2 Followers | 3 Followers |
| Mean Throughput | index-append | docs/s | 882.82 | +1.00% | -3.22% | -2.23% |
| 50th percentile latency | index-append | ms | 503.87 | -1.59% | -0.56% | +1.61% |
| 90th percentile latency | index-append | ms | 649.30 | -0.81% | -0.41% | +3.91% |
| Mean Throughput | term | ops/s | 49.99 | -0.05% | -0.02% | -0.03% |
| 50th percentile latency | term | ms | 11.39 | -4.80% | -11.97% | -17.73% |
| 90th percentile latency | term | ms | 12.84 | -4.15% | -10.33% | -17.93% |
| Leader CPU usage period | Baseline Mean | 1 Follower | 2 Followers | 3 Followers |
| Overall mean CPU usage | 29.97% | 31.30% | 31.27% | 32.80% |
| During indexing peak | 38.93% | 40.77% | 40.67% | 43.77% |
| During searching peak | 54.73% | 53.63% | 52.60% | 52.27% |
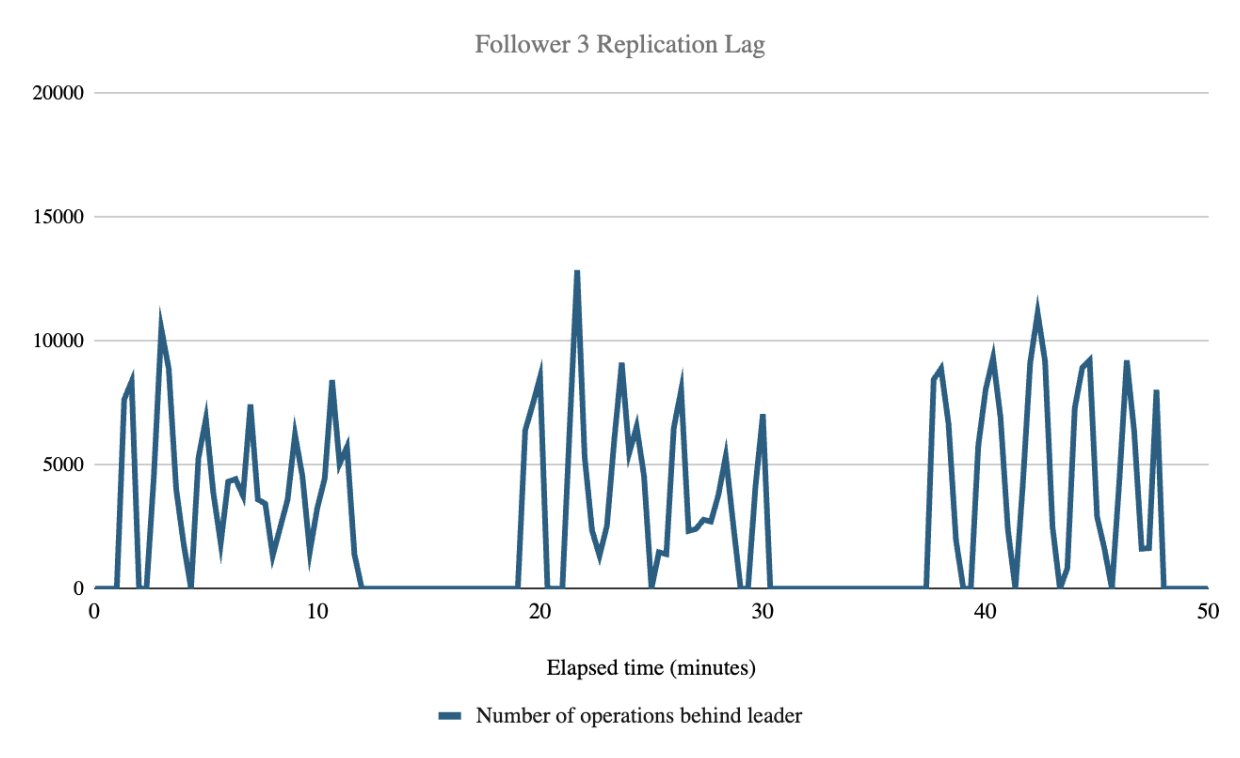
| Follower Replication Lag (# of operations behind Leader) | 1 Follower | 2 Followers | 3 Followers | Overall mean |
| Replication Lag mean across all followers during indexing | 4575.12 | 4212.14 | 4354.77 | 4380.68 |
Our results show a measurable increase in leader CPU usage when there are actively replicating followers, which increases as more followers are added. With 3 followers, leader CPU usage increased by 12.41% during indexing, and 9.45% during the test overall. There was no leader CPU usage increase during the search part of the test, regardless of the number of followers. This was expected as no replication is being performed during the searching part of the test workload. In fact, we even recorded reduced CPU usage during the searching component—likely due to uncontrolled performance variations between the tests.
Indexing throughput and latency were negatively affected with three followers, but search throughput and latency seemed unaffected. Mean indexing throughput decreased 3.42% with 3 followers, 50th and 90th percentile latencies increased by 1.9% and 2.7% respectively.
While indexing was measurably impacted, it was only relatively minor and with no clearly defined trend. Perhaps a clear trend would appear if we kept increasing followers far above 3, where we are only beginning to see a small impact (2.23% decreased throughput, 1.61% increased 50th percentile latency).
An interesting additional observation was reduced search latencies in the 1, 2, and 3 follower cases compared to the baseline test. This is like the reduced leader CPU usage we saw in the follower cases compared to baseline, but more pronounced. While we are not certain why this is, one potential theory is that the presence of replicating followers could affect the way documents are cached in memory (e.g. a document could be kept in memory longer than normal if a follower was recently replicating it). Unfortunately, because we did not analyze memory usage patterns in the different test cases we can only guess for now.
Follower CPU usage was similar for all the 1, 2, and 3 follower cases, averaging 23.32% overall and 36.2% during the indexing peak of the test.
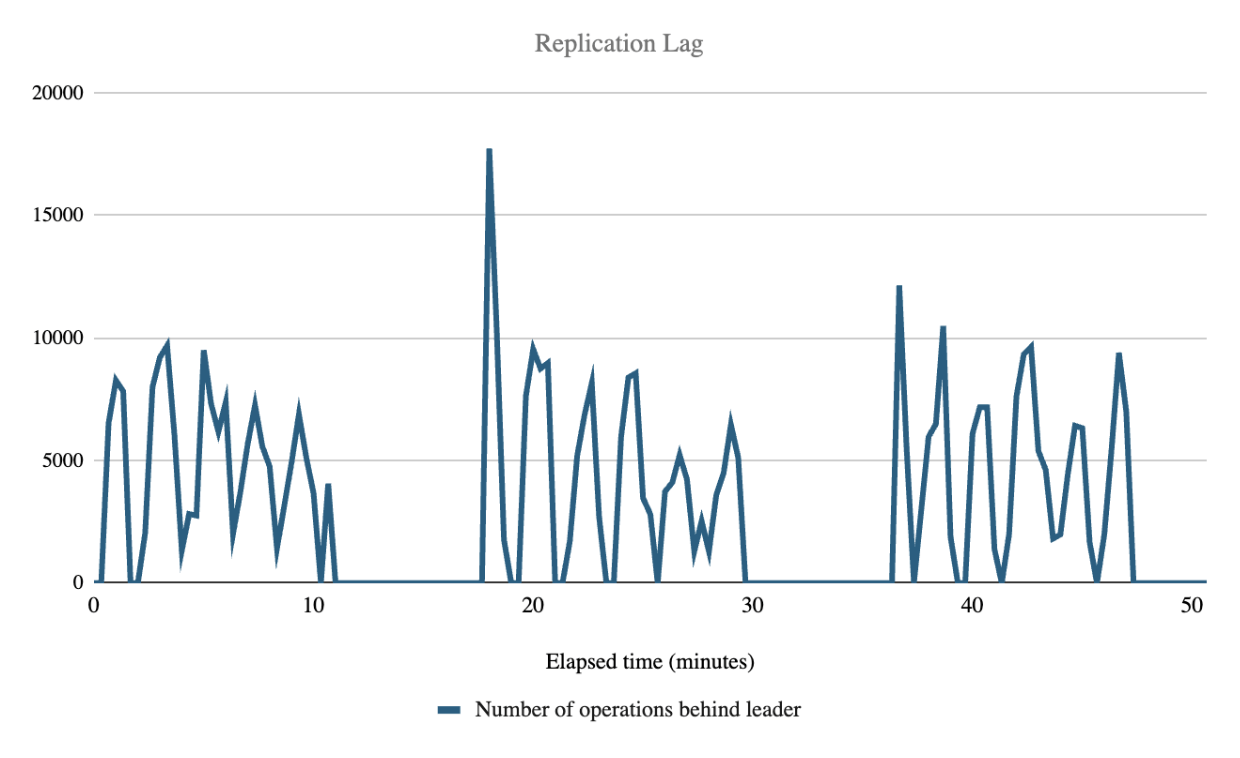
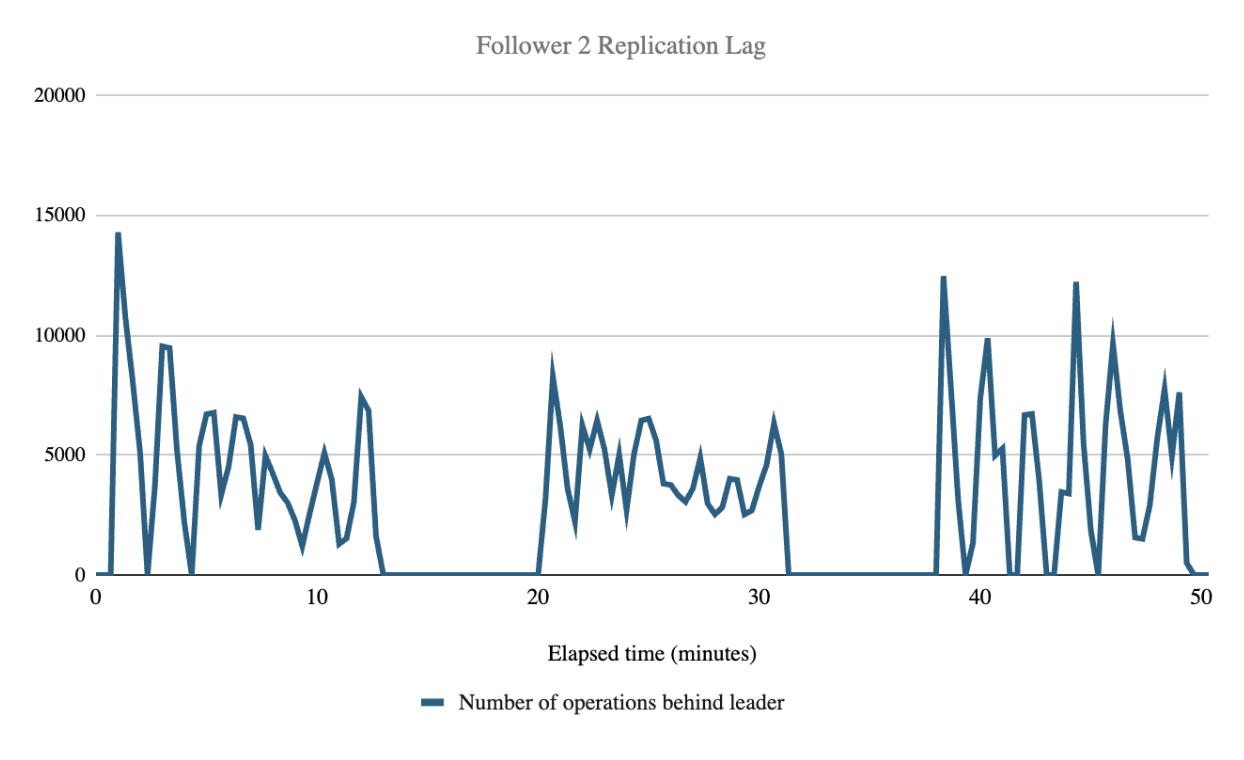
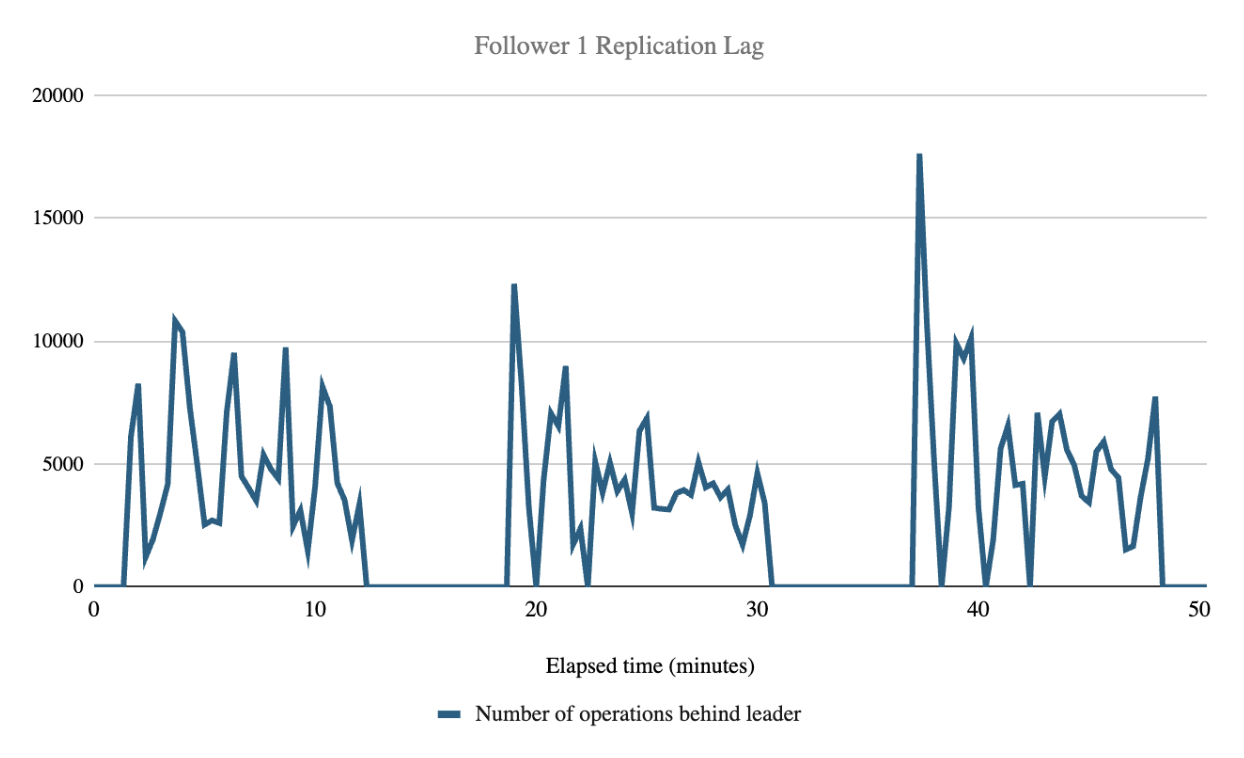
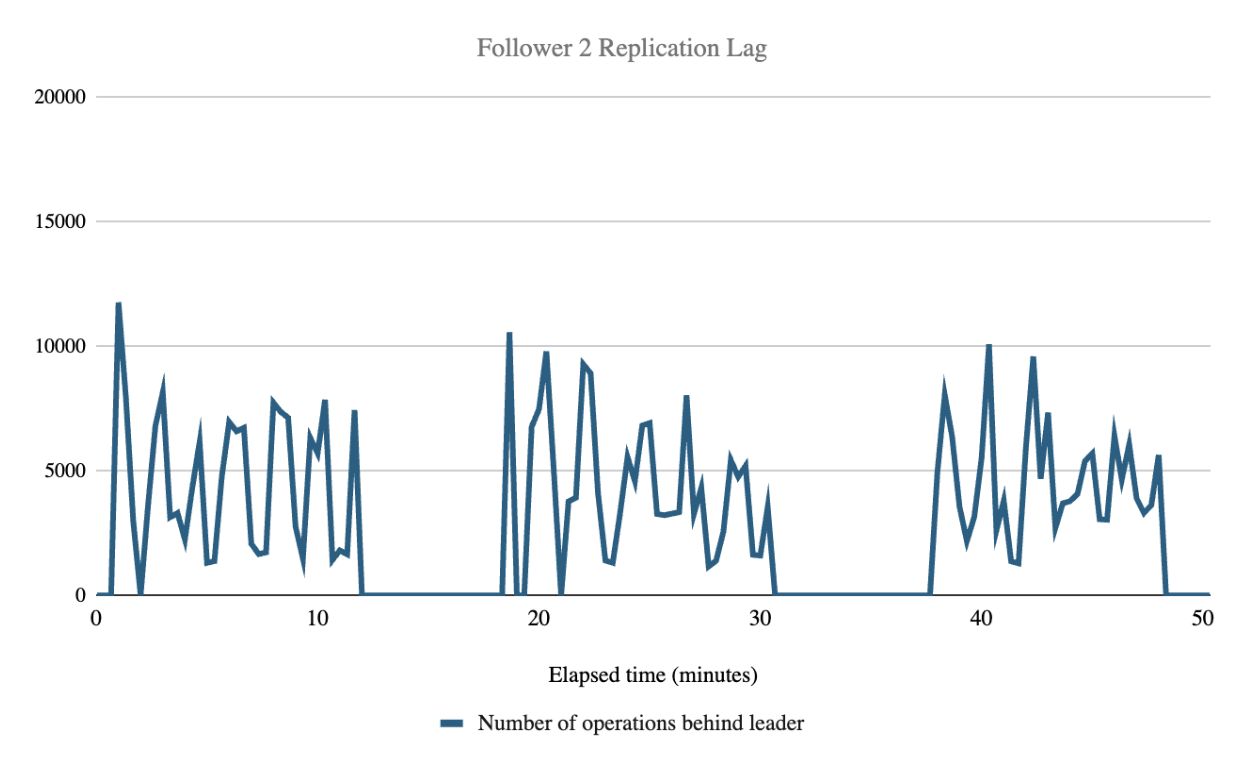
Follower replication lag (how many operations behind the leader cluster a follower is) was not affected by the number of followers and averaged 4380.68 operations during indexing. While this number cannot be directly converted to an elapsed time value, we observed that during the test the follower checkpoint values always exceeded the leader checkpoint value reported at the previous 20 second interval. This indicates that the followers consistently remained less than 20 seconds behind the leader, but our metrics collection interval cannot offer any more granularity than that.
While the replication lag spiked up and down throughout the test, the mean lag remained consistent rather than constantly increasing. The graphs below show how the replication lag spiked up and down during the three test runs, likely due to batch processing of replication operations.

OpenSearch performance benchmarking: Conclusion
Our performance testing of OpenSearch’s Cross-Cluster Replication (CCR) revealed that while CCR introduces a measurable increase in CPU usage on the leader cluster, particularly during indexing activities, the overall impact on search performance was minimal. With up to three followers, the indexing throughput saw a slight decrease, and latency experienced a modest increase, but these changes were within acceptable ranges for most use cases. Importantly, the replication lag remained consistent and manageable, indicating that CCR can be effectively used without significant degradation of service.
For customers using CCR, this means that it can be confidently implemented to enhance data redundancy and availability. This ensures that the benefits of CCR, such as improved disaster recovery and data distribution, can be leveraged without compromising the performance and reliability of the OpenSearch cluster.
Interested in optimizing your OpenSearch clusters? Stay tuned for more insights and guides to make the most of your deployment! For professional support in implementing CCR, connect with our team today.