Summary
Recently, Cassandra made changes to the Native Transport Requests (NTR) queue behaviour. Through our performance testing, we found the new NTR change to be good for clusters that have a constant load causing the NTR queue to block. Under the new mechanism the queue no longer blocks, but throttles the load based on queue size setting, which by default is 10% of the heap.
Compared to the Native Transport Requests queue length limit, this improves how Cassandra handles traffic when queue capacity is reached. The “back pressure” mechanism more gracefully handles the overloaded NTR queue, resulting in a significant lift of operations without clients timing out. In summary, clusters with later versions of Cassandra can handle more load before hitting hard limits.
Introduction
At Instaclustr, we are responsible for managing the Cassandra versions that we release to the public. This involves performing a review of Cassandra release changes, followed by performance testing. In cases where major changes have been made in the behaviour of Cassandra, further research is required. So without further delay let’s introduce the change to be investigated.
Change:
- Prevent client requests from blocking on executor task queue (CASSANDRA-15013)
Versions affected:
- 3.11.5 and above (CHANGES.txt)
- Backported to 3.0.19
Background
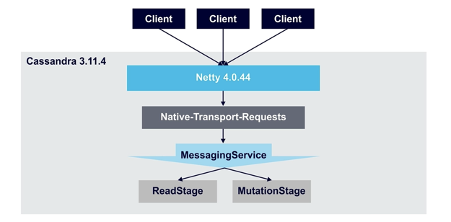
Native Transport Requests
Native transport requests (NTR) are any requests made via the CQL Native Protocol. CQL Native Protocol is the way the Cassandra driver communicates with the server. This includes all reads, writes, schema changes, etc. There are a limited number of threads available to process incoming requests. When all threads are in use, some requests wait in a queue (pending). If the queue fills up, some requests are silently rejected (blocked). The server never replies, so this eventually causes a client-side timeout. The main way to prevent blocked native transport requests is to throttle load, so the requests are performed over a longer period.
Prior to 3.11.5
Prior to 3.11.5, Cassandra used the following configuration settings to set the size and throughput of the queue:
- native_transport_max_threads is used to set the maximum threads for handling requests. Each thread pulls requests from the NTR queue.
- cassandra.max_queued_native_transport_requests is used to set queue size. Once the queue is full the Netty threads are blocked waiting for the queue to have free space (default 128).
Once the NTR queue is full requests from all clients are not accepted. There is no strict ordering by which blocked Netty threads will process requests. Therefore in 3.11.4 latency becomes random once all Netty threads are blocked.
Change After 3.11.5
In 3.11.5 and above, instead of blocking the NTR queue as previously described, it throttles. The NTR queue is throttled based on the heap size. The native transport requests are limited in terms of total size occupied in memory rather than the number of them. Requests are paused after the queue is full.
- native_transport_max_concurrent_requests_in_bytes a global limit on the number of NTR requests, measured in bytes. (default heapSize / 10)
- native_transport_max_concurrent_requests_in_bytes_per_ip an endpoint limit on the number of NTR requests, measured in bytes. (default heapSize / 40)
Maxed Queue Behaviour
From previously conducted performance testing of 3.11.4 and 3.11.6 we noticed similar behaviour when the traffic pressure has not yet reached the point of saturation in the NTR queue. In this section, we will discuss the expected behaviour when saturation does occur and breaking point is reached.
In 3.11.4, when the queue has been maxed, client requests will be refused. For example, when trying to make a connection via cqlsh, it will yield an error, see Figure 2.

Or on the client that tries to run a query, you may see NoHostAvailableException.
Where a 3.11.4 cluster previously got blocked NTRs, when upgraded to 3.11.6 NTRs are no longer blocked. The reason is that 3.11.6 doesn’t place a limit on the number of NTRs but rather on the size of memory of all those NTRs. Thus when the new size limit is reached, NTRs are paused. Default settings in 3.11.6 result in a much larger NTR queue in comparison to the small 128 limit in 3.11.4 (in normal situations where the payload size would not be extremely large).
Benchmarking Setup
This testing procedure requires the NTR queue on a cluster to be at max capacity with enough load to start blocking requests at a constant rate. In order to do this we used multiple test boxes to stress the cluster. This was achieved by using 12 active boxes to create multiple client connections to the test cluster. Once the cluster NTR queue is in constant contention, we monitored the performance using:
- Client metrics: requests per second, latency from client perspective
- NTR Queue metrics: Active Tasks, Pending Tasks, Currently Blocked Tasks, and Paused Connections.
For testing purposes we used two testing clusters with details provided in the table below:
| Cassandra | Cluster size | Instance Type | Cores | RAM | Disk |
| 3.11.4 | 3 | M5xl-1600-v2 | 4 | 16GB | 1600 GB |
| 3.11.6 | 3 | m5xl-1600-v2 | 4 | 16GB | 1600 GB |
To simplify the setup we disabled encryption and authentication. Multiple test instances were set up in the same region as the clusters. For testing purposes, we used 12 KB blob payloads. To give each cluster node a balanced mixed load, we kept the number of test boxes generating write load equal to the number of instances generating read load. We ran the load against the cluster for 10 mins to temporarily saturate the queue with reading and write requests and cause contention for the Netty threads.
Our test script used Cassandra-stress for generating the load, you can also refer to Deep Diving Cassandra-stress – Part 3 (Using YAML Profiles) for more information.
In the stressSpec.yaml, we used the following table definition and queries:
table_definition: |
 CREATE TABLE typestest (
       name text,
       choice boolean,
       date timestamp,
       address inet,
       dbl double,
       lval bigint,
               ival int,
       uid timeuuid,
       value blob,
       PRIMARY KEY((name,choice), date, address, dbl, lval, ival, uid)
 ) WITH compaction = { 'class':'LeveledCompactionStrategy' }
   AND comment='A table of many types to test wide rows'

columnspec:
 - name: name
   size: fixed(48)
   population: uniform(1..1000000000) # the range of unique values to select for the field
 - name: date
   cluster: uniform(20..1000)
 - name: lval
   population: gaussian(1..1000)
   cluster: uniform(1..4)
 - name: value
   size: fixed(12000)

insert:
 partitions: fixed(1)       # number of unique partitions to update in a single operation
                                 # if batchcount > 1, multiple batches will be used but all partitions will
                                 # occur in all batches (unless they finish early); only the row counts will vary
 batchtype: UNLOGGED               # type of batch to use
 select: uniform(1..10)/10       # uniform chance any single generated CQL row will be visited in a partition;
                                 # generated for each partition independently, each time we visit it

#
# List of queries to run against the schema
#
queries:
  simple1:
     cql: select * from typestest where name = ? and choice = ? LIMIT 1
     fields: samerow             # samerow or multirow (select arguments from the same row, or randomly from all rows in the partition)
  range1:
     cql: select name, choice, uid  from typestest where name = ? and choice = ? and date >= ? LIMIT 10
     fields: multirow            # samerow or multirow (select arguments from the same row, or randomly from all rows in the partition)
  simple2:
     cql: select name, choice, uid from typestest where name = ? and choice = ? LIMIT 1
     fields: samerow             # samerow or multirow (select arguments from the same row, or randomly from all rows in the partition)
Write loads were generated with:
cassandra-stress user no-warmup 'ops(insert=10)' profile=stressSpec.yaml cl=QUORUM duration=10m -mode native cql3 maxPending=32768 connectionsPerHost=40 -rate threads=2048 -node file=node_list.txt
Read loads were generated by changing ops to
ops(simple1=10,range1=1)'Comparison
3.11.4 Queue Saturation Test
The active NTR queue reached max capacity (at 128) and remained in contention under load. Pending NTR tasks remained above 128 throughout. At this point, timeouts were occurring when running 12 load instances to stress the cluster. Each node had 2 load instances performing reads and another 2 performing writes. 4 of the read load instances constantly logged NoHostAvailableExceptions as shown in the example below.
ERROR 04:26:42,542 [Control connection] Cannot connect to any host, scheduling retry in 1000 milliseconds
com.datastax.driver.core.exceptions.NoHostAvailableException: All host(s) tried for query failed (tried: ec2-18-211-4-255.compute-1.amazonaws.com/18.211.4.255:9042 (com.datastax.driver.core.exceptions.OperationTimedOutException: [ec2-18-211-4-255.compute-1.amazonaws.com/18.211.4.255] Timed out waiting for server response), ec2-35-170-231-79.compute-1.amazonaws.com/35.170.231.79:9042 (com.datastax.driver.core.exceptions.OperationTimedOutException: [ec2-35-170-231-79.compute-1.amazonaws.com/35.170.231.79] Timed out waiting for server response), ec2-35-168-69-19.compute-1.amazonaws.com/35.168.69.19:9042 (com.datastax.driver.core.exceptions.OperationTimedOutException: [ec2-35-168-69-19.compute-1.amazonaws.com/35.168.69.19] Timed out waiting for server response))
The client results we got from this stress run are shown in Table 2.
| Box | Op rate (op/s) | Latency mean (ms) | Latency median (ms) | Latency 95th percentile (ms) | latency 99th percentile (ms) | Latency 99.9th percentile (ms) | Latency max (ms) |
| 1 | 700.00 | 2,862.20 | 2,078.30 | 7,977.60 | 11,291.10 | 19,495.10 | 34,426.80 |
| 2 | 651.00 | 3,054.50 | 2,319.50 | 8,048.90 | 11,525.90 | 19,528.70 | 32,950.50 |
| 3 | 620.00 | 3,200.90 | 2,426.40 | 8,409.60 | 12,599.70 | 20,367.50 | 34,158.40 |
| 4 | 607.00 | 3,312.80 | 2,621.40 | 8,304.70 | 11,769.20 | 19,730.00 | 31,977.40 |
| 5 | 568.00 | 3,529.80 | 3,011.50 | 8,216.60 | 11,618.20 | 19,260.20 | 32,698.80 |
| 6 | 553.00 | 3,627.10 | 3,028.30 | 8,631.90 | 12,918.50 | 20,115.90 | 34,292.60 |
| Writes | 3,699.00 | 3,264.55 | 2,580.90 | 8,264.88 | 11,953.77 | 19,749.57 | 34,426.80 |
| 7 | 469.00 | 4,296.50 | 3,839.90 | 9,101.60 | 14,831.10 | 21,290.30 | 35,634.80 |
| 8 | 484.00 | 4,221.50 | 3,808.40 | 8,925.50 | 11,760.80 | 20,468.20 | 34,863.10 |
| 9 | Crashed due to time out | – | – | – | – | – | – |
| 10 | Crashed due to time out | – | – | – | – | – | – |
| 11 | Crashed due to time out | – | – | – | – | – | – |
| 12 | Crashed due to time out | – | – | – | – | – | – |
| Reads | 953.00 | 4,259.00 | 3,824.15 | 9,092.80 | 14,800.40 | 21,289.48 | 35,634.80 |
| Summary | 4,652.00 | 3,761.78 | 3,202.53 | 8,678.84 | 13,377.08 | 20,519.52 | 35,634.80 |
* To calculate the total write operations, we summed the values from 6 instances. For max write latency we used the max value from all instances and for the rest of latency values, we calculated the average of results. Write results are summarised in the Table 2 “Write” row. For the read result we did the same, and results are recorded in the “Read” row. The last row in the table summarises the results in “Write” and “Read” rows.
The 6 write load instances finished normally, but the read instances struggled. Only 2 of the read load instances were able to send traffic through normally, the other clients received too many timeout errors causing them to crash. Another observation we have made is that the Cassandra timeout metrics, under client-request-metrics, did not capture any of the client timeout we have observed.
Same Load on 3.11.6
Next, we proceeded to test 3.11.6 with the same load. Using the default NTR settings, all test instances were able to finish the stress test successfully.
| Box | Op rate (op/s) | Latency mean (ms) | Latency median (ms) | Latency 95th percentile (ms) | latency 99th percentile (ms) | Latency 99.9th percentile (ms) | Latency max (ms) |
| 1 | 677.00 | 2,992.60 | 2,715.80 | 7,868.50 | 9,303.00 | 9,957.30 | 10,510.90 |
| 2 | 658.00 | 3,080.20 | 2,770.30 | 7,918.80 | 9,319.70 | 10,116.70 | 10,510.90 |
| 3 | 653.00 | 3,102.80 | 2,785.00 | 7,939.80 | 9,353.30 | 10,116.70 | 10,510.90 |
| 4 | 608.00 | 3,340.90 | 3,028.30 | 8,057.30 | 9,386.90 | 10,192.20 | 10,502.50 |
| 5 | 639.00 | 3,178.30 | 2,868.90 | 7,994.30 | 9,370.10 | 10,116.70 | 10,510.90 |
| 6 | 650.00 | 3,120.50 | 2,799.70 | 7,952.40 | 9,353.30 | 10,116.70 | 10,510.90 |
| Writes | 3,885.00 | 3,135.88 | 2,828.00 | 7,955.18 | 9,347.72 | 10,102.72 | 10,510.90 |
| 7 | 755.00 | 2,677.70 | 2,468.30 | 7,923.00 | 9,378.50 | 9,982.40 | 10,762.60 |
| 8 | 640.00 | 3,160.70 | 2,812.30 | 8,132.80 | 9,529.50 | 10,418.70 | 11,031.00 |
| 9 | 592.00 | 3,427.60 | 3,101.70 | 8,262.80 | 9,579.80 | 10,452.20 | 11,005.90 |
| 10 | 583.00 | 3,483.00 | 3,160.40 | 8,279.60 | 9,579.80 | 10,435.40 | 11,022.60 |
| 11 | 582.00 | 3,503.60 | 3,181.40 | 8,287.90 | 9,588.20 | 10,469.00 | 11,047.80 |
| 12 | 582.00 | 3,506.70 | 3,181.40 | 8,279.60 | 9,588.20 | 10,460.60 | 11,014.20 |
| Reads | 3,734.00 | 3,293.22 | 2,984.25 | 8,194.28 | 9,540.67 | 10,369.72 | 11,047.80 |
| Summary | 7,619.00 | 3,214.55 | 2,906.13 | 8,074.73 | 9,444.19 | 10,236.22 | 11,047.80 |
Default Native Transport Requests (NTR) Setting Comparison
Taking the summary row from both versions (Table 2 and Table 3), we produced Table 4.
| Op rate (op/s) | Latency mean (ms) | Latency median (ms) | Latency 95th percentile (ms) | latency 99th percentile (ms) | Latency 99.9th percentile (ms) | Latency max (ms) | |
| 3.11.4 | 4652 | 3761.775 | 3202.525 | 8678.839167 | 13377.08183 | 20519.52228 | 35634.8 |
| 3.11.6 | 7619 | 3214.55 | 2906.125 | 8074.733333 | 9444.191667 | 10236.21667 | 11047.8 |
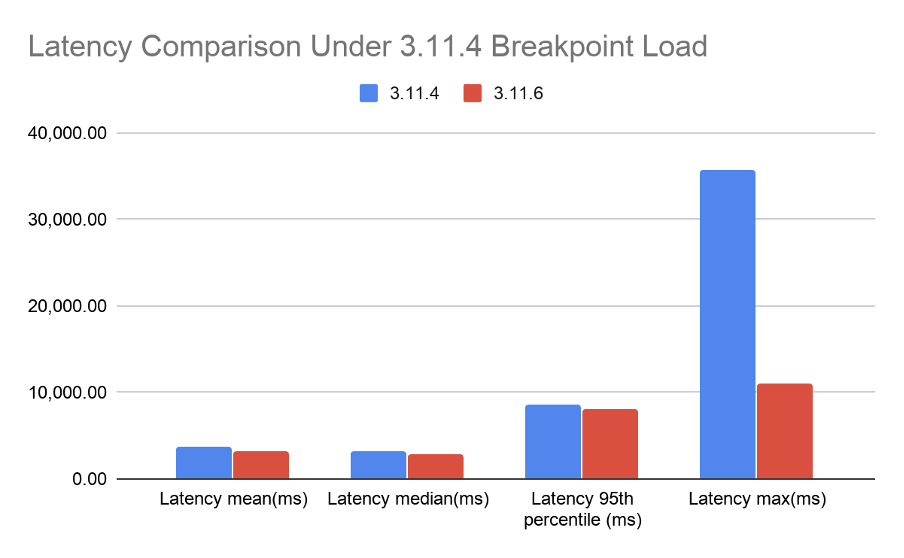
Figure 2 shows the latencies from Table 4. From the results, 3.11.6 had slightly better average latency than 3.11.4. Furthermore, in the worst case where contention is high, 3.11.6 handled the latency of a request better than 3.11.4. This is shown by the difference in Latency Max. Not only did 3.11.6 have lower latency but it was able to process many more requests due to not having a blocked queue.
3.11.6 Queue Saturation Test
The default native_transport_max_concurrent_requests_in_bytes is set to 1/10 of the heap size. The Cassandra max heap size of our cluster is 8 GB, so the default queue size for our queue is 0.8 GB. This turns out to be too large for this cluster size, as this configuration will run into CPU and other bottlenecks before we hit NTR saturation.
So we took the reverse approach to investigate full queue behaviour, which is setting the queue size to a lower number. In cassandra.yaml, we added:
native_transport_max_concurrent_requests_in_bytes: 1000000This means we set the global queue size to be throttled at 1MB. Once Cassandra was restarted and all nodes were online with the new settings, we ran the same mixed load on this cluster, the results we got are shown in Table 5.
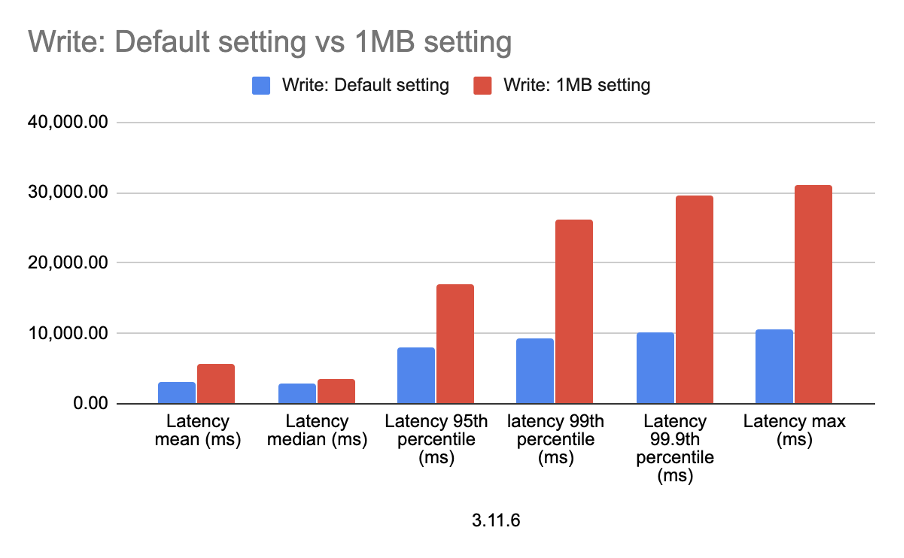
| 3.11.6 | Op rate (op/s) | Latency mean (ms) | Latency median (ms) | Latency 95th percentile (ms) | latency 99th percentile (ms) | Latency 99.9th percentile (ms) | Latency max (ms) |
| Write: Default setting | 3,885.00 | 3,135.88 | 2,828.00 | 7,955.18 | 9,347.72 | 10,102.72 | 10,510.90 |
| Write: 1MB setting | 2,105.00 | 5,749.13 | 3,471.82 | 16,924.02 | 26,172.45 | 29,681.68 | 31,105.00 |
| Read: Default setting | 3,734.00 | 3,293.22 | 2,984.25 | 8,194.28 | 9,540.67 | 10,369.72 | 11,047.80 |
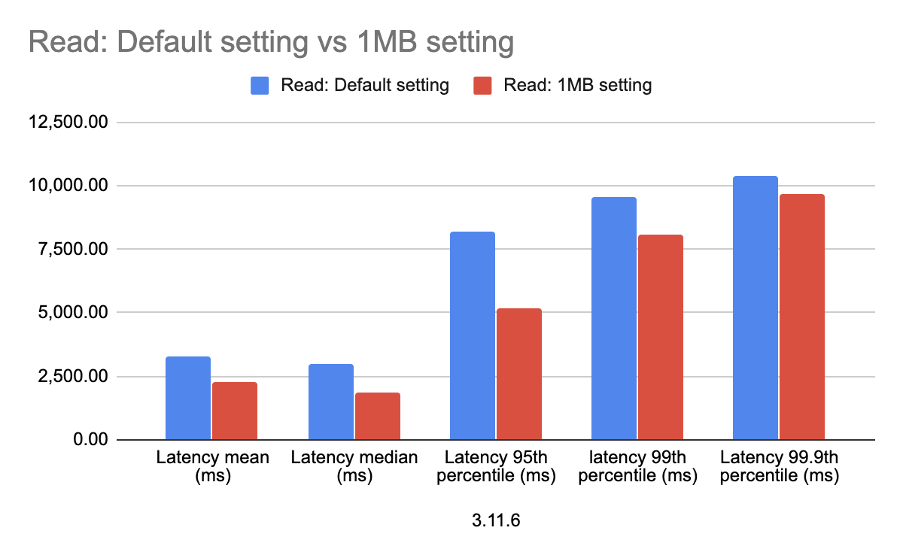
| Read: 1MB setting | 5,395.00 | 2,263.13 | 1,864.55 | 5,176.47 | 8,074.73 | 9,693.03 | 15,183.40 |
| Summary: Default setting | 7,619.00 | 3,214.55 | 2,906.13 | 8,074.73 | 9,444.19 | 10,236.22 | 11,047.80 |
| Summary: 1MB setting | 7,500.00 | 4,006.13 | 2,668.18 | 11,050.24 | 17,123.59 | 19,687.36 | 31,105.00 |
Table 5: 3.11.6 native_transport_max_concurrent_requests_in_bytes default and 1MB setting
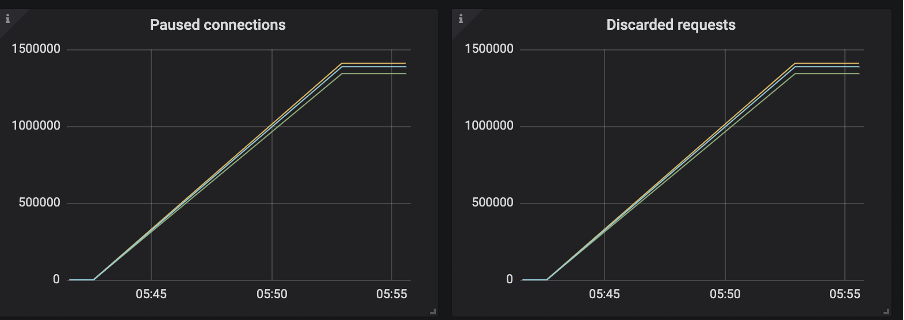
During the test, we observed a lot of paused connections and discarded requests—see Figure 3. For a full list of Instaclustr exposed metrics see our support documentation.
After setting native_transport_max_concurrent_requests_in_bytes to a lower number, we start to get paused connections and discarded requests, write latency increased resulting in fewer processed operations, shown in Table 5. The increased write latency is illustrated Figure 4.
On the other hand, read latency decreased, see Figure 5, resulting in a higher number of operations being processed.
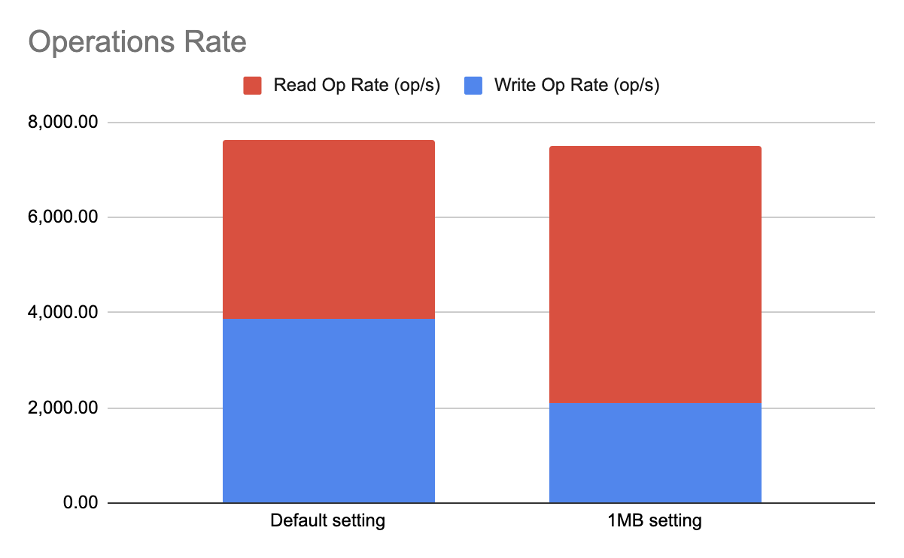
As illustrated in Figure 6, the total number of operations decreased slightly with the 1MB setting, but the difference is very small and the effect of read and write almost “cancel each other out”. However, when we look at each type of operation individually, we can see that rather than getting equal share of the channel in a default setting of “almost unlimited queue”, the lower queue size penalizes writes and favors read. While our testing identified this outcome, further investigation will be required to determine exactly why this is the case.
Conclusion
In conclusion, the new NTR change offers an improvement over the previous NTR queue behaviour. Through our performance testing we found the change to be good for clusters that have a constant load causing the NTR queue to block. Under the new mechanism the queue no longer blocks, but throttles the load based on the amount of memory allocated to requests.
The results from testing indicated that the changed queue behaviour reduced latency and provided a significant lift in the number of operations without clients timing out. Clusters with our latest version of Cassandra can handle more load before hitting hard limits. For more information feel free to comment below or reach out to our Support team to learn more about changes to 3.11.6 or any of our other supported Cassandra versions.