End-to-end distributed tracing of complex applications is a critical pillar of modern distributed systems observability development and operations. Previously, I’ve used OpenTelemetry to trace a complex Kafka application, including Kafka Streams, and looked at the traces in several open source OpenTelemetry GUIs, including Jaeger, Uptrace, and SigNoz. And earlier, I used its predecessor, OpenTracing, to trace Anomalia Machina.
Recently, I found out that OpenSearch has an extensive Observability plugin, and I was excited to find out that it has Trace Analytics, which supports OpenTelemetry traces.
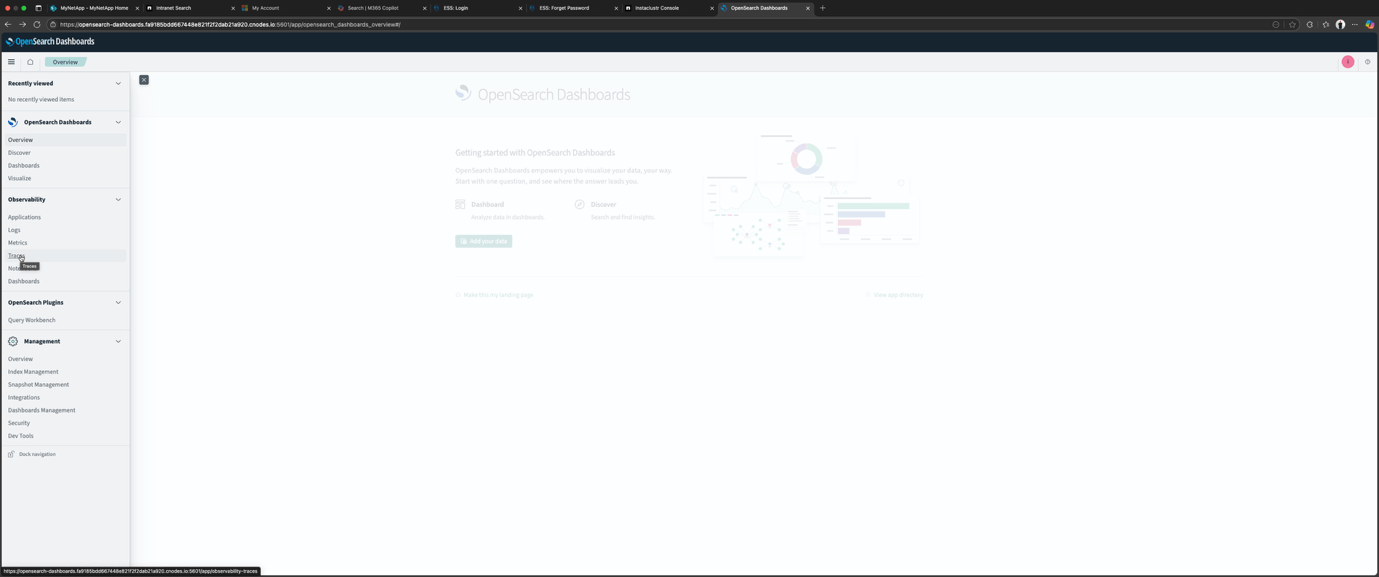
I was also very pleased to find out that NetApp Instaclustr Managed OpenSearch supports the Observability plugin, so I spun up an OpenSearch cluster (documentation on how to do this is here) to see what it looks like (information on connection to the cluster and starting the Dashboard is here). Once you connect to the OpenSearch dashboard, it’s available as expected. Click on “Observability → Traces” on the left-hand side.
Next, to explore OpenSearch trace analytics, you have to get some OpenTelemetry trace data into OpenSearch. There are two possible data sources that you can select from:
- Jaeger. Trace data stored within OpenSearch as its backend
- Data Prepper. Data ingested into OpenSearch through Data Prepper
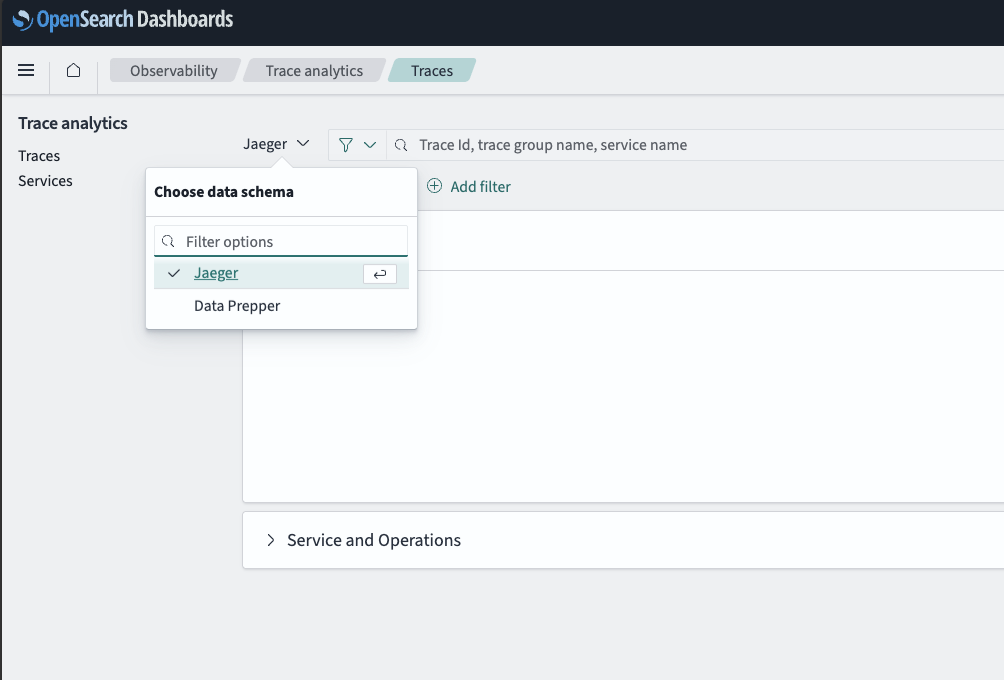
Because I’ve already used Jaeger and had it running locally, I started with that option, so this will be the focus of part 1. We’ll look at Data Prepper in part 2.
OpenTelemetry Java auto instrumentation
What will this pipeline look like? We’ll run some Kafka clients with Java OpenTelemetry auto-instrumentation enabled as described in the documentation and send traces to the local Jaeger instance. I tested this out first, and it worked as previously described in this blog, including Trace Graph, System Architecture, and Deep Dependency Graph views.
On the Kafka client side, this is what you have to run to automatically produce traces from a Java program:
|
1 2 3 |
java -javaagent:opentelemetry-javaagent.jar -Dotel.traces.exporter=otlp -Dotel.resource.attributes=service.name=test_producer -Dotel.metrics.exporter=none -jar producer.jar |
The documentation and opentelemetry-javaagent.jar are available here.
This command runs a Java application (in this case, a Kafka producer client) with OpenTelemetry auto-instrumentation. The agent (-javaagent:opentelemetry-javaagent.jar) automatically adds traces without modifying the application code.
-Dotel.traces.exporter=otlp sets the trace exporter to OTLP (OpenTelemetry Protocol), allowing the traces to be sent to an OTLP-compatible backend (e.g. Collectors, backends). Note that otel.traces.exporter=otlp now, rather than jaeger as in the earlier blog. What’s the reason for this? Because Jaeger now supports OTLP out of the box.
The -Dotel.resource.attributes option adds arbitrary key:value metadata to the traces, in the format:
|
1 |
-Dotel.resource.attributes=key=value |
For this example, -Dotel.resource.attributes=service.name=test_producer, you have to come up with a logical service.name to uniquely identify each component that emits traces. For a real Kafka application, you would likely have multiple producer and consumer clients, so it would make sense to come up with sensible descriptive names. As well as service resource.attributes, others include host, cloud, container, k8s, etc. More information here.
The final option disables metrics export, as I’m not interested in those at present, so only traces will be exported.
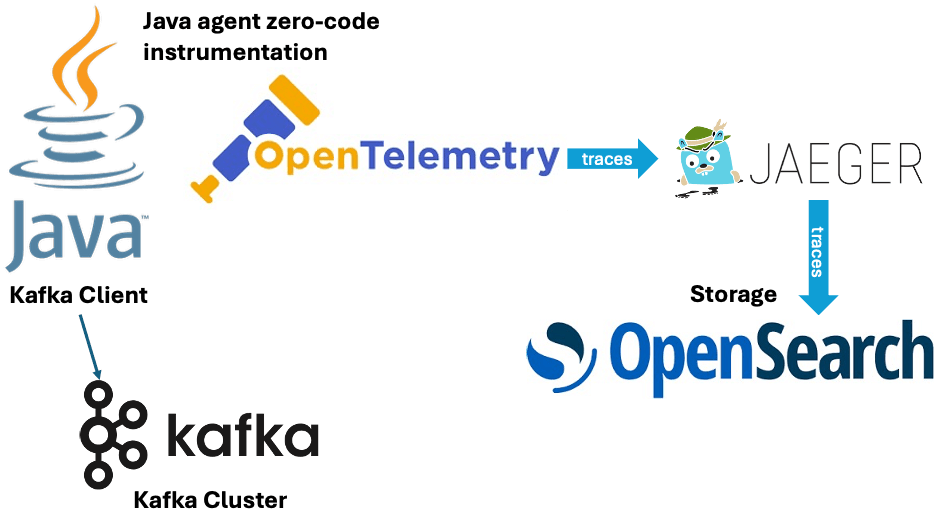
Here’s a diagram showing this first pipeline, with traces flowing directly from Java Kafka clients to Jaeger.
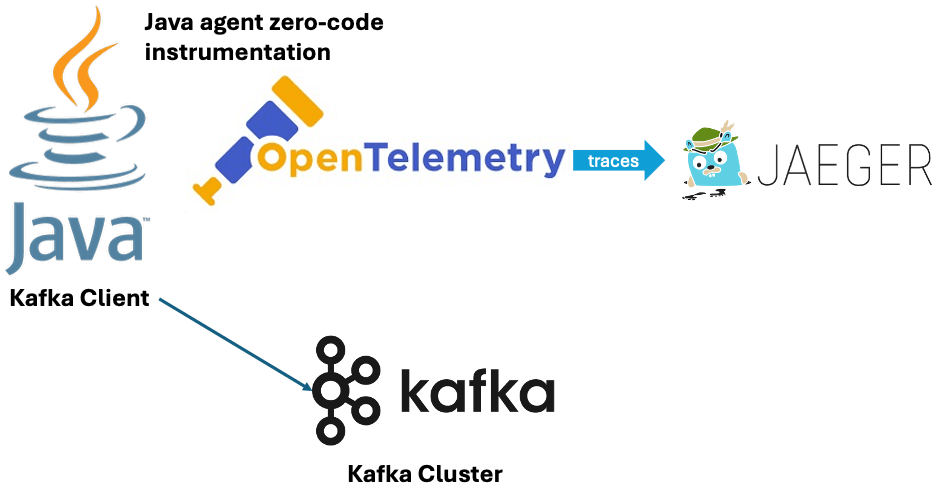
For a more interesting use case and topology, I ran a producer (service.name=lotsofboxes) writing to a topic, and two consumers in different groups (service.name=consumerg1, service.name=consumerg2) reading from the same topic.
Now we know that the OpenTelemetry instrumentation is working and generating traces locally with Jaeger, let’s look at options to get traces into OpenSearch Observability.
Option 1: Configuring Jaeger to use OpenSearch storage
Next, I configured Jaeger to use the Instaclustr managed OpenSearch as storage. This was trickier to get right and involved finding the OpenSearch IP, user and password from the Instaclustr console, and another step to follow these instructions to set the ES_TAGS_AS_FIELDS_ALL to true so that traces with errors are correctly processed. These additions are highlighted with bolded text below.
Here’s my configuration file (instaclustr_opensearch_config.yaml):
|
1 2 3 4 5 6 7 8 9 10 11 12 13 14 15 16 17 18 19 20 21 22 23 24 25 26 27 28 29 30 31 32 33 34 35 36 37 38 39 40 41 42 43 44 45 46 47 48 49 50 51 52 53 54 55 56 57 58 59 60 61 62 63 64 65 66 67 68 69 70 71 72 73 74 75 76 77 78 79 80 |
service: extensions: [jaeger_storage, jaeger_query, healthcheckv2] pipelines: traces: receivers: [otlp] processors: [batch] exporters: [jaeger_storage_exporter] telemetry: resource: service.name: jaeger metrics: level: detailed readers: - pull: exporter: prometheus: host: 0.0.0.0 port: 8888 logs: level: debug extensions: healthcheckv2: use_v2: true http: jaeger_query: storage: traces: some_storage metrics: some_storage jaeger_storage: backends: some_storage: &opensearch_config opensearch: server_urls: - https://ip:9200 auth: basic: username: "user" password: "password" tags_as_fields: all: true indices: index_prefix: "jaeger-main" spans: date_layout: "2006-01-02" rollover_frequency: "day" shards: 5 replicas: 1 services: date_layout: "2006-01-02" rollover_frequency: "day" shards: 5 replicas: 1 dependencies: date_layout: "2006-01-02" rollover_frequency: "day" shards: 5 replicas: 1 sampling: date_layout: "2006-01-02" rollover_frequency: "day" shards: 5 replicas: 1 # Optional, enable metrics backend to use Monitor tab metric_backends: some_storage: *opensearch_config receivers: otlp: protocols: grpc: http: endpoint: "0.0.0.0:4318" processors: batch: exporters: jaeger_storage_exporter: trace_storage: some_storage |
This configuration file is based on an example (with changes), with associated documentation here. Note that I left the default metrics service configured, even though I’m not using it.
I also found I had to delete this line from the example:
|
1 2 |
ui: config_file: ./cmd/jaeger/config-ui.json |
Also note that you can also provide the OpenSearch user and password in the server_urls like this:
|
1 2 |
server_urls: - https://user:password@ip:9200 |
Here’s what we have so far:
Kafka client + OpenTelemetry → Jaeger (running locally on port 4317) → using Instaclustr OpenSeach as the database for traces
But does it work? The first thing to check is if using OpenSearch as the Jaeger database works for Jaeger. The traces are still visible in Jaeger, but unfortunately, the more interesting trace visualization options are not working correctly.
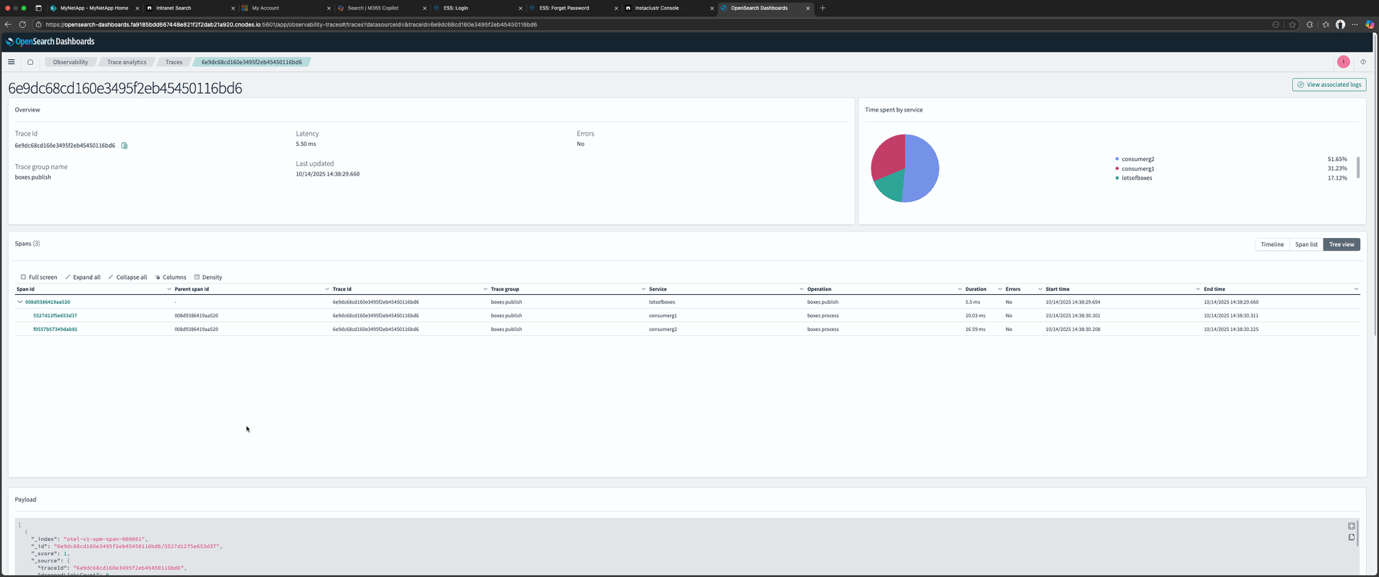
Next, I checked if OpenSearch Trace Analytics is working. Unfortunately, the functionality is very limited—you can see the traces and explore each trace, but, like Jaeger using OpenSearch as the backend, the more advanced visualizations are missing.
Here’s a screenshot from OpenSearch Dashboard showing what you can see—all the traces with the ability to drill down into a trace and see the related spans as in this example.
Was this surprising? Not really—I had expected that some functionality would be missing without the full pre-processing pipeline. Although, I was surprised that using OpenSearch as the Jaeger storage also impacted the Jaeger tracing architecture visualization functionality. This probably means that using OpenSearch as the Jaeger backed storage won’t really work in practice without extra steps.
I checked the Jaeger documentation, and it turns out that the default in-memory version of Jaeger which I had been using, provides the full trace visualization functionality—but isn’t much use in production as the traces are not persisted anywhere. For production deployment with a real database, Jaeger provides “big data” jobs (e.g. Spark, Flink, etc.) designed to scalably extract and build service graph data from traces stored in OpenSearch or other storage, as these can be resource-intensive to produce.
Here’s a diagram of the option 1 setup:
That’s it for our initial exploration of how to get OpenTelemetry traces into OpenSearch. Option 1, using OpenSearch as a Jaeger database, works for an experiment, but it has limited functionality. In part 2, we’ll use a Data Prepper pipeline and find out if we can get all of the tracing visualization functionality on offer.