Observability Plugin
Overview
The OpenSearch Observability plugin provides functionality that allows you to ingest application data like logs, metrics, and traces and use OpenSearch Dashboards to correlate, analyze, and visualize the information. This can help provide insights into the performance and runtime issues in your applications. The plugin adds lots of new functionality which is explained in more detail in the official OpenSearch plugin documentation.
Enabling the Plugin
When choosing the eligible OpenSearch version (OpenSearch 1.3.19 and 2.14.0 onwards), the options will be available on the Console, API and the Instaclustr Terraform Provider to provision clusters with the Observability plugin. Additionally, clusters must be provisioned with OpenSearch Dashboards and the SQL Plugin.
Existing clusters that satisfy these version requirements can have the Observability plugin enabled by making a request to support.
Console
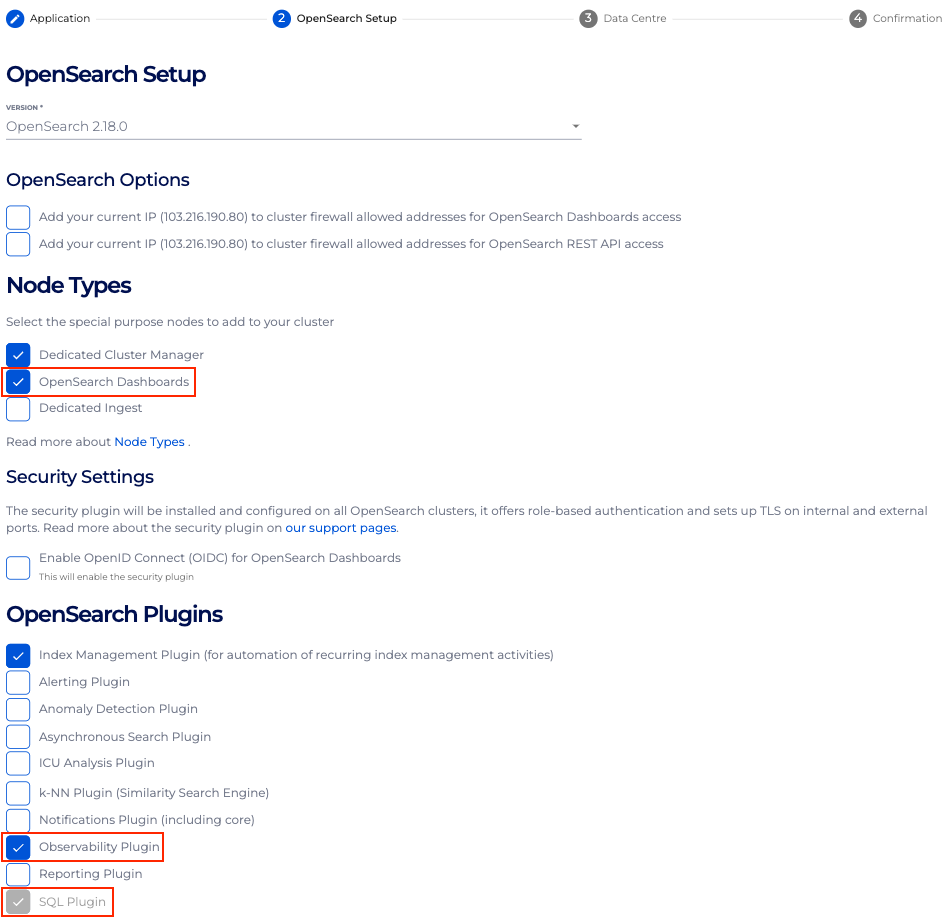
Via the Instaclustr Console, you can enable the Observability plugin within the OpenSearch Setup step when creating a new cluster. Make sure to also enable OpenSearch Dashboards, or you will be unable to select the Observability plugin.
API and Terraform
Observability plugin can also be provisioned using our API and Terraform provider. See our API and Terraform documentation for more information on how to provision clusters with the Observability plugin for the API and Terraform respectively.
Plugin Usage
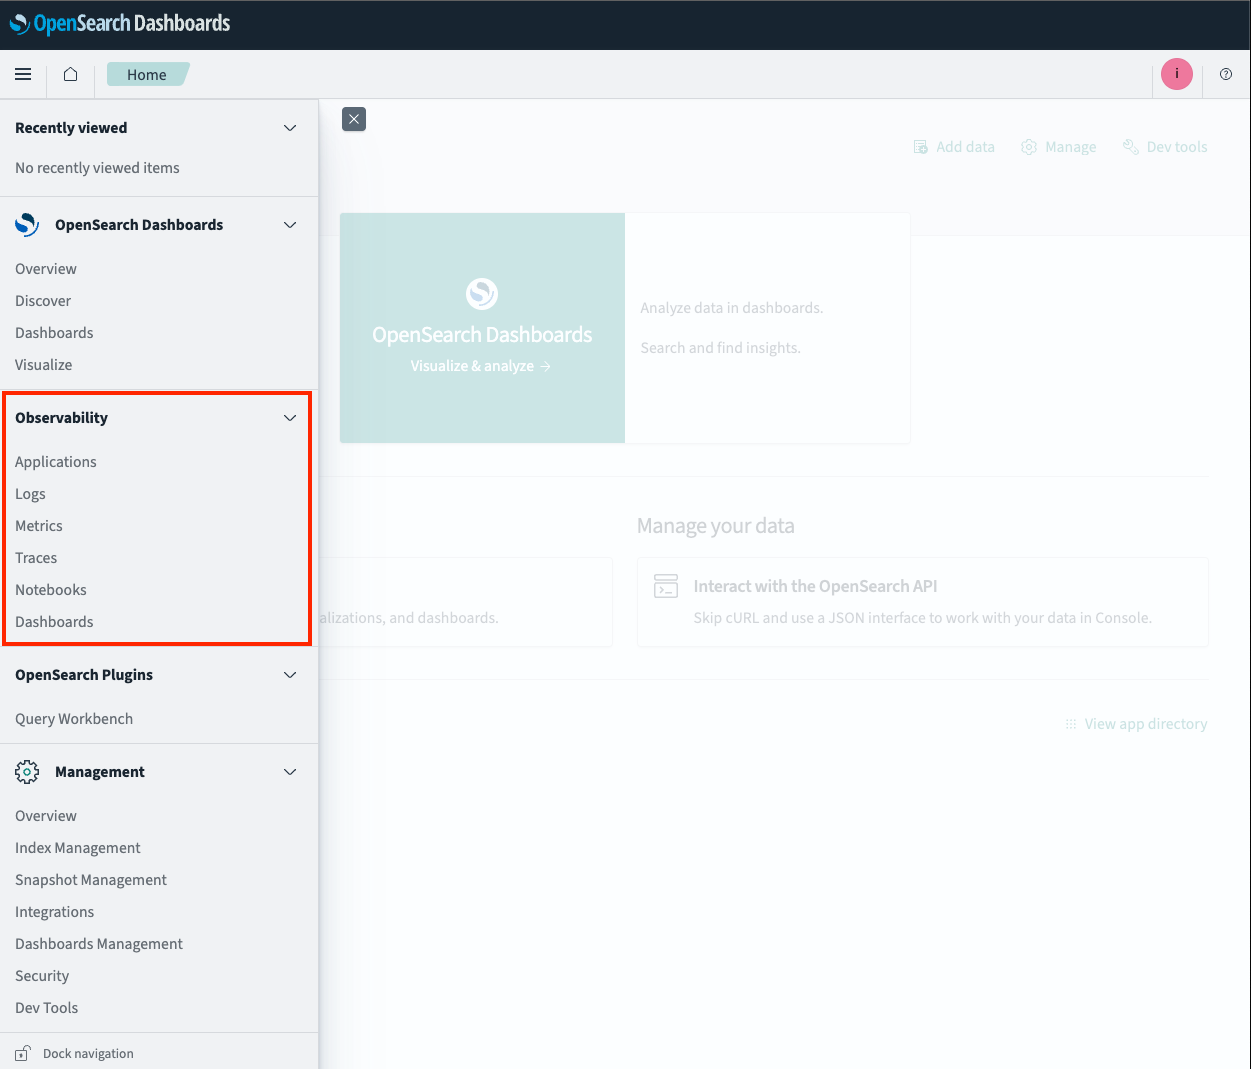
The Observability plugin features can be accessed through OpenSearch Dashboards via the “Observability” menu group in the left-hand sidebar. For more information on how to connect to OpenSearch Dashboards, see our documentation.