What Is ClickHouse Hosting With Built-in Monitoring?
TL;DR: ClickHouse hosting with built-in monitoring bundles observability into a managed ClickHouse service. Best for full managed operations: Instaclustr; official cloud experience: ClickHouse Cloud; open source control: Altinity; developer-built APIs: Tinybird.
ClickHouse hosting with built-in monitoring refers to managed ClickHouse database services that integrate real-time observability tools directly into the hosting environment. Instead of requiring users to set up external monitoring stacks, these solutions bundle dashboards, metrics collection, alerting, and analytics as part of the core offering. This integration allows administrators and developers to track database health, performance, and resource usage without additional software, reducing operational complexity and setup time.
By delivering monitoring as a native feature, ClickHouse hosting providers empower users to identify and respond to issues quickly. Comprehensive, always-on observability means teams can optimize query performance, monitor resource utilization, and detect anomalies without manual instrumentation. This approach not only ensures the database runs efficiently but also helps maintain data reliability and meet business SLAs by providing actionable insights from a centralized interface.
Why Monitoring Is Critical for ClickHouse Environments
Monitoring is critical for ClickHouse environments because it helps teams maintain performance, reliability, and scalability as workloads grow. By tracking query behavior, memory, storage, ingestion, and replication health, administrators can detect issues early, optimize resources, and prevent disruptions.
- Identifying slow or resource-intensive queries: Monitoring provides query profiling, latency metrics, and CPU or memory usage data to pinpoint inefficient queries and prioritize optimization.
- Preventing memory exhaustion and storage bottlenecks: Tracking memory, disk usage, I/O, and partition growth helps teams tune settings, scale infrastructure, and avoid node failures or slowdowns.
- Maintaining predictable ingestion and query performance: Monitoring ingestion rates, write latency, merge activity, and query response times helps ensure consistent performance and fast data availability.
- Detecting replication, availability, and data consistency issues: Visibility into replica health, replication lag, and errors helps teams identify synchronization problems before they affect availability or consistency.
ClickHouse Hosting Services at a Glance
The table below summarizes the key differences between the services covered in this article. We explore each of them in more detail in the sections that follow.
| Category | Solution | Best For | Key Strengths | Things to Consider |
|---|---|---|---|---|
| Fully managed | Instaclustr Managed ClickHouse | Teams needing fully managed ClickHouse with 24/7 operations | Built-in monitoring, automated health checks, 99.99% SLA | Managed model limits some low-level configuration |
| Fully managed | Altinity.Cloud | Enterprises wanting 100% open source ClickHouse with support | Any ClickHouse version, BYOC, 24/7 expert support | No self-serve signup; onboarding and review required |
| Self-serve / dev-focused | ClickHouse Cloud | Teams wanting the official, serverless managed ClickHouse | Built-in console monitoring, autoscaling, ClickPipes | Consumption pricing hard to predict; learning curve |
| Self-serve / dev-focused | Tinybird | Developers building real-time analytics APIs on ClickHouse | API-first, streaming ingestion, observability queries | API-first (bring your own UI); costs can spike at scale |
| Self-serve / dev-focused | Elestio Managed ClickHouse | Teams wanting low-cost, self-serve managed ClickHouse | Monitoring and alerts included, dedicated VMs, flat price | Fewer deep-config controls; costs vary with complexity |
Related content: Read our guide to ClickHouse alternatives
Key Features of ClickHouse Hosting With Built-in Monitoring
Modern ClickHouse hosting platforms provide monitoring capabilities tailored for analytical workloads. These features provide visibility and automated response mechanisms that simplify operational management. By integrating these tools, hosting providers help organizations optimize performance, maintain reliability, and reduce the burden of database administration.
Real-Time Performance Dashboards
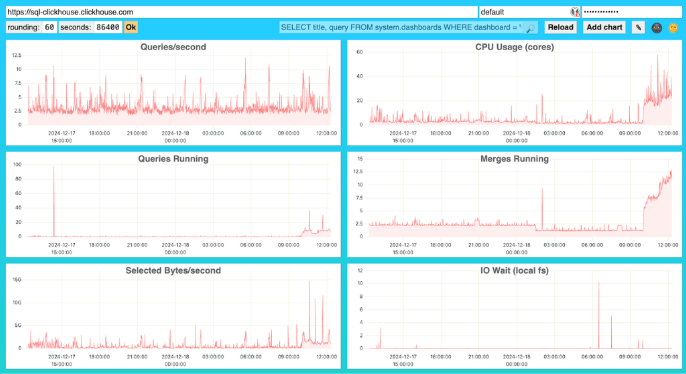
Real-time performance dashboards consolidate critical metrics into a single interface, providing visibility into the health and activity of ClickHouse clusters. These dashboards typically display resource usage, query throughput, error rates, and latency statistics. With live data, administrators can spot anomalies, such as unexpected spikes in CPU or memory usage, and investigate issues before they impact users.
Interactive dashboards support historical analysis, enabling trend identification and capacity planning. By visualizing long-term patterns, teams can anticipate scaling needs and optimize resource allocation. Built-in dashboards support daily operations and planning in ClickHouse environments.
Query Performance Monitoring
Query performance monitoring captures and analyzes details about executed queries, including their duration, resource consumption, and frequency. This visibility helps identify inefficient queries that consume excessive CPU or memory, cause contention, or return large result sets. Real-time query analytics allow teams to prioritize optimization efforts based on workload impact.
Historical query data supports ongoing performance tuning and regression detection. By comparing current metrics to baselines, teams can spot performance drift caused by schema changes, application updates, or shifting data patterns. Query monitoring helps keep the ClickHouse cluster responsive as usage grows or evolves.
Related content: Read our ClickHouse tutorial for large-scale data analysis
CPU, Memory, Disk, and Network Metrics
Monitoring core system metrics, CPU, memory, disk, and network, is fundamental for maintaining ClickHouse performance and stability. Built-in monitoring tracks these resources at both the node and cluster levels, providing insight into utilization patterns. Spikes or sustained high usage can indicate issues such as inefficient queries, hardware limitations, or misconfigured settings.
Detailed metrics support capacity planning and incident response. When performance degrades, administrators can use historical data to determine if bottlenecks are due to resource exhaustion or other factors. Continuous monitoring of system metrics allows teams to address potential issues before they impact service quality.
Data Ingestion and Merge Monitoring
ClickHouse ingestion and merge processes support its analytical capabilities. Monitoring tools track data ingestion rates, write latencies, and the status of background merge operations, which combine small data parts into larger files. These insights help teams ensure that data flows into the system smoothly and is available for analysis.
By monitoring merge performance, administrators can detect and resolve bottlenecks that might slow query response times or increase storage fragmentation. This visibility is important for environments with high-frequency data loading or complex retention policies.
Replication and Cluster Health Visibility
Replication and cluster health monitoring help ensure that ClickHouse remains available during hardware failures or network issues. Monitoring tools display the status of replicas, replication lag, and synchronization errors. This information helps maintain data consistency across distributed nodes.
Cluster health monitoring also tracks node availability, network latency, and overall system status. By presenting this data in real time, administrators can identify and respond to failures, reducing the risk of outages or data loss. Continuous cluster health visibility supports high availability and disaster recovery.
Configurable Alerts and Notifications
Configurable alerts and notifications enable teams to respond to emerging issues in ClickHouse environments. Users can define thresholds for key metrics, such as CPU usage, query latency, or replication lag, and receive automated alerts when those thresholds are breached. This approach reduces the risk of unnoticed problems escalating into service outages.
Advanced alerting systems support integration with email, messaging platforms, and incident management tools. Fine-tuning alert rules helps prevent noise and keeps teams focused on critical events.
Log Collection and Analysis
Log collection and analysis tools aggregate logs from ClickHouse nodes, enabling investigation of errors, warnings, and unusual events. Centralized logging simplifies troubleshooting by providing a view of system activity, query execution, and internal processes. This helps diagnose issues that may not be visible through metrics alone.
Log analysis features include filtering, search, and correlation with other monitoring data. By linking log events to specific queries or resource spikes, administrators can identify root causes and implement fixes. Continuous log monitoring also supports auditing, compliance, and security monitoring.
Automated Backups and Recovery Monitoring
Automated backups are critical for data protection, but their effectiveness depends on successful execution and timely recovery. Monitoring tools track the status of scheduled backups, reporting on completion, duration, and errors. This ensures that backup processes run as intended and that data is safeguarded against loss.
Recovery monitoring confirms that backup data can be restored when needed. By testing and reporting on restore operations, organizations can validate their disaster recovery plans and reduce downtime during incidents. Integrated backup and recovery monitoring reduces manual oversight and increases confidence in data resilience.
Related content: Read our guide to ClickHouse backup options
Notable ClickHouse Hosting Services With Built-in Monitoring
How we selected these services: We shortlisted managed ClickHouse hosting providers based on the depth of their built-in monitoring and alerting, operational automation, high-availability and backup features, deployment flexibility, and support for production real-time analytical workloads.
Fully Managed ClickHouse Services With Hands-On Operations
1. Instaclustr for ClickHouse

Best for: Teams needing fully managed ClickHouse with 24/7 expert operations
Strengths: Built-in monitoring, automated health checks, up to 99.99% SLA
Things to consider: Managed model sets some configuration and maintenance guardrails
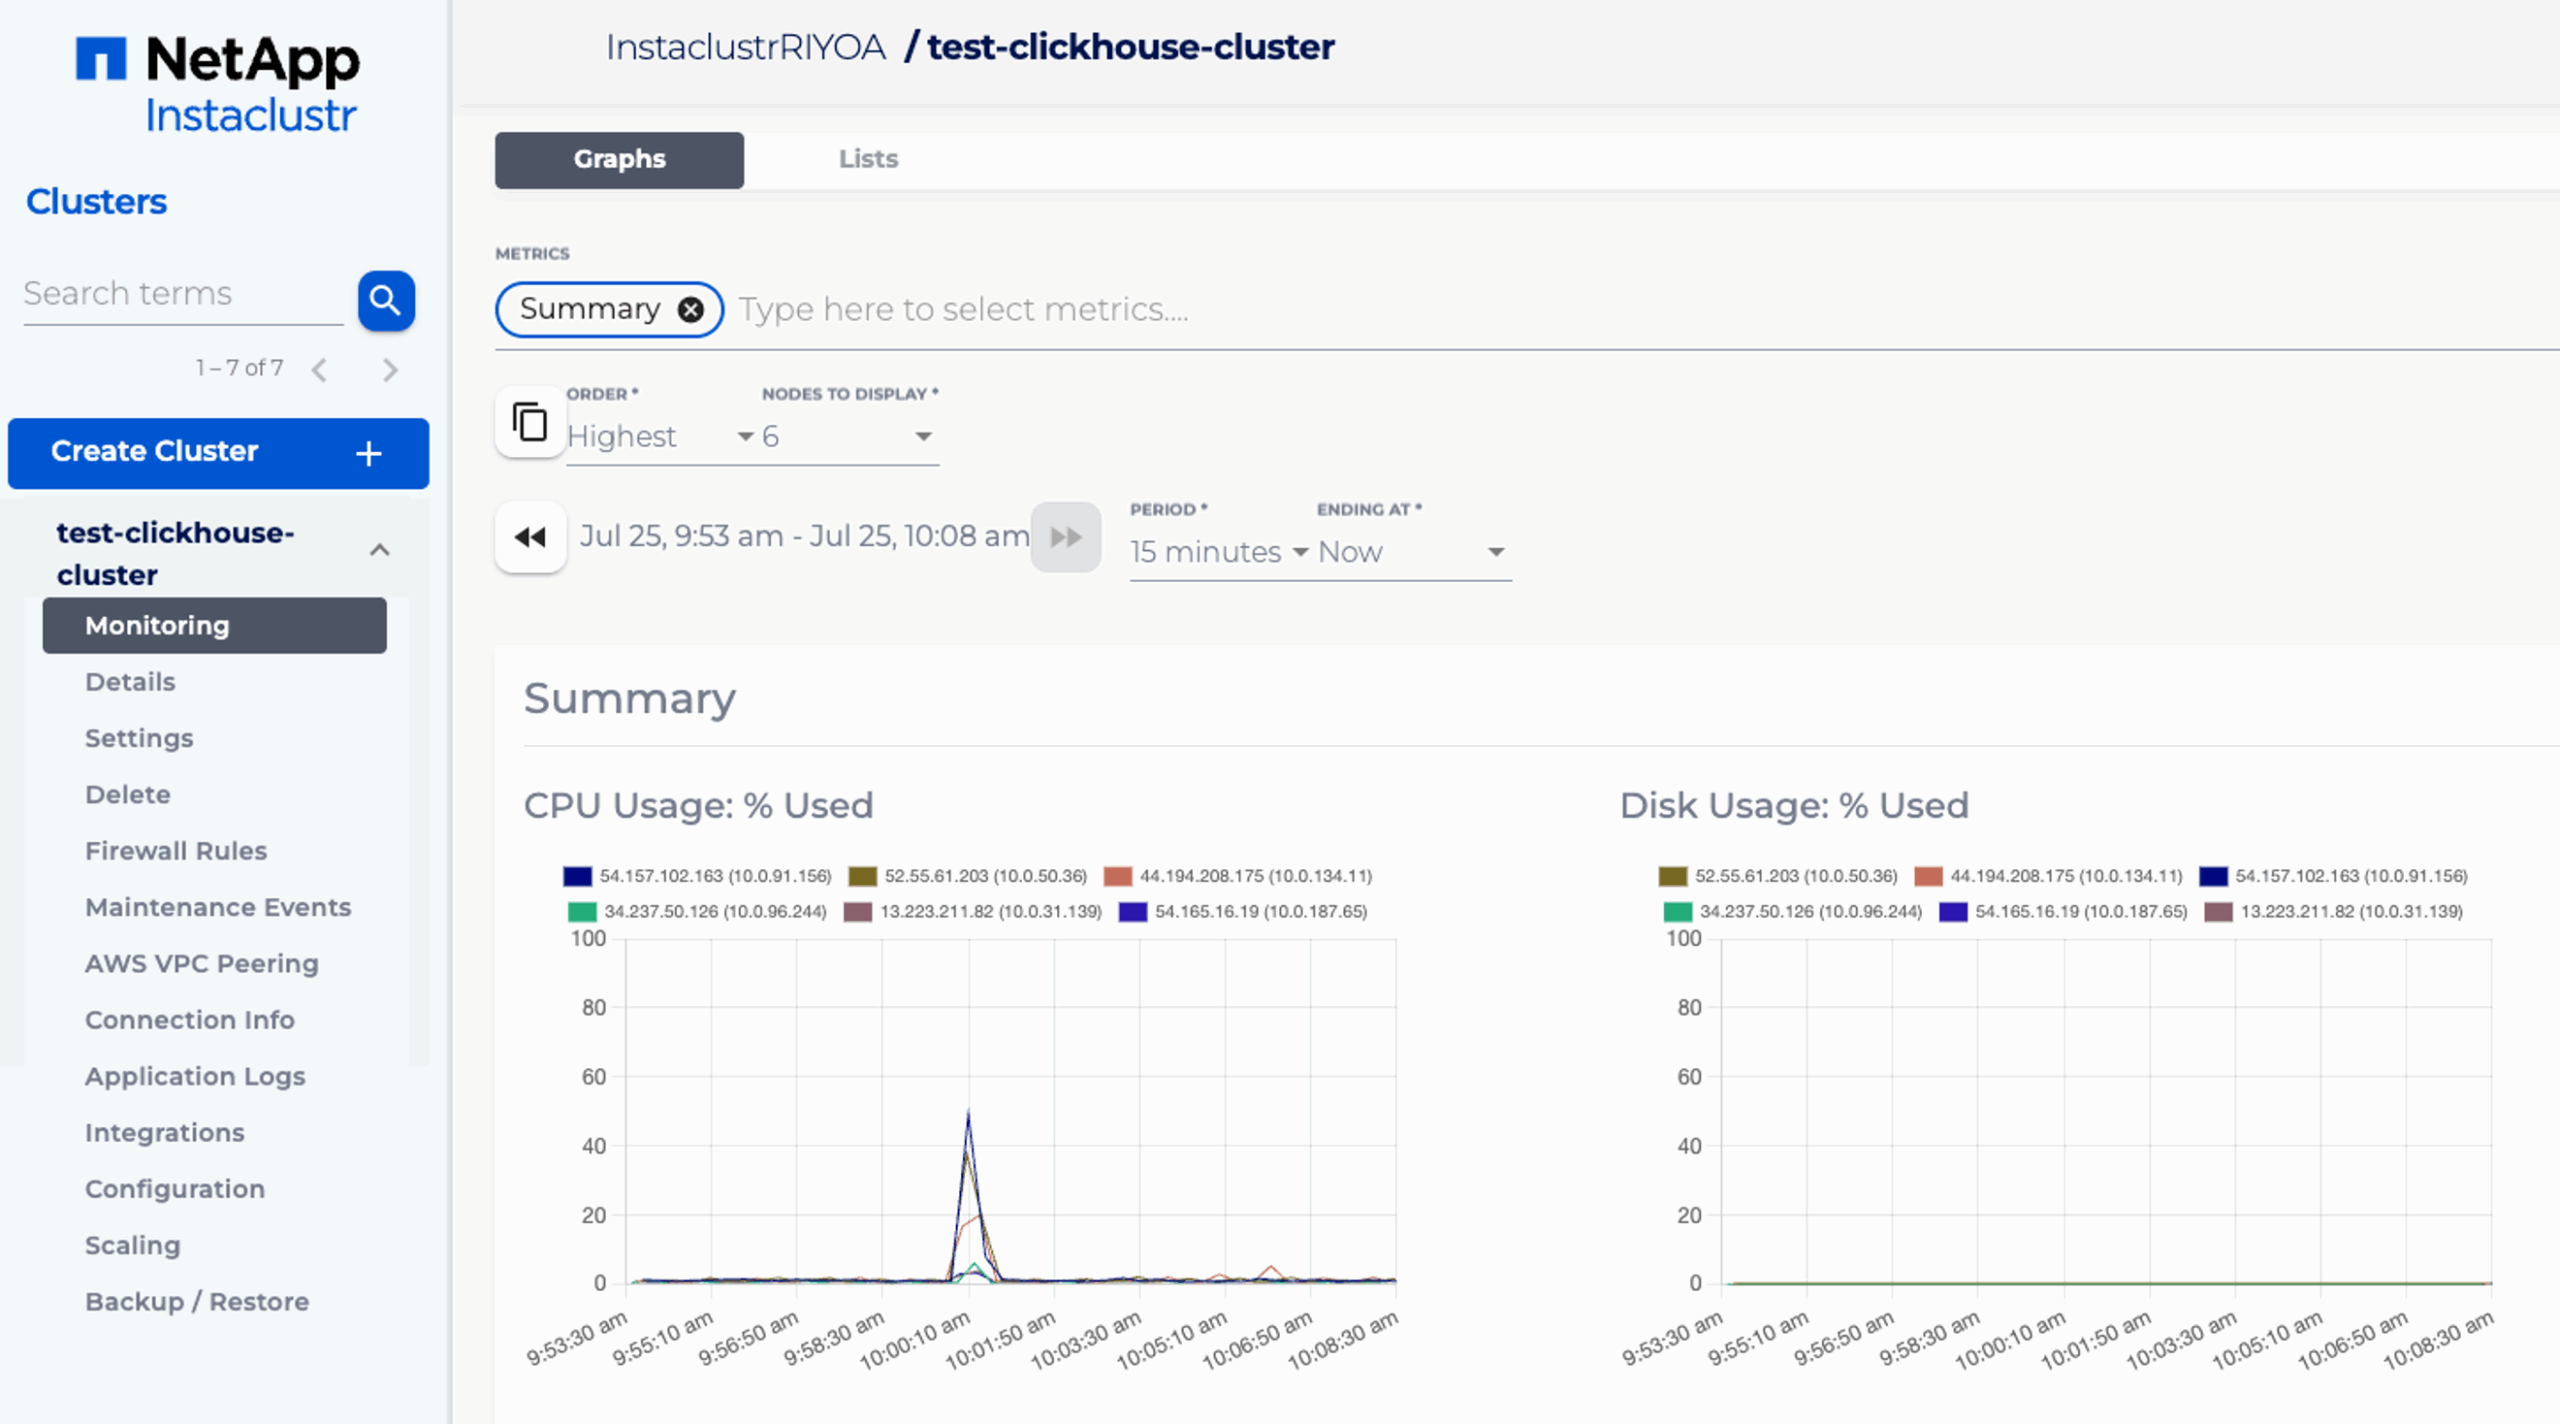
Instaclustr Managed ClickHouse is a fully managed, hosted service for running 100% open source ClickHouse, the column-oriented OLAP database used for real-time analytical reports and dashboards. You can run it in your own cloud provider account or in Instaclustr’s, across cloud, on-premise, or hybrid environments.
Clusters are provisioned through a console, API, or Terraform provider, and the configuration is tuned for OLAP workloads. Instaclustr’s operations team takes responsibility for the health and performance of each cluster, from initial setup through ongoing maintenance.
Key features include:
- Built-in monitoring and automated health checks: The system monitors cluster health, and a 24/7 team is alerted whenever action or investigation is needed.
- Proactive performance monitoring: Monitoring tools track the environment and flag efficiency issues.
- Zero downtime scaling: Clusters scale horizontally by adding or removing nodes without interrupting service.
- Flexible deployment: Provision via console, API, or Terraform provider, and run in your own cloud account or Instaclustr’s across cloud, on-premise, or hybrid setups.
- High availability and SLA: Built-in redundancy and failover back an availability SLA of up to 99.99%.
- Storage tiering with AWS FSx for NetApp ONTAP: Data is tiered between high-performance and lower-cost storage.
- Managed upgrades and maintenance: Upgrades, patches, and maintenance are handled by the provider.
- Security and compliance: SOC 2, ISO 27001, and ISO 27018 certified, with PCI-DSS and HIPAA compliance.
Limitations (based on publicly available sources):
- Configuration flexibility: Some low-level settings and maintenance windows follow provider guardrails rather than fully custom setups.
- Technology coverage: The platform supports a defined set of technologies and versions, so niche forks or uncommon extensions may need self-management.
- Cost estimation: Pricing depends on node size, cloud provider, and deployment choice.
2. Altinity.Cloud
Best for: Enterprises wanting 100% open source ClickHouse with expert support
Strengths: Any ClickHouse version, BYOC, 24/7 expert support, no lock-in
Things to consider: Signup is not self-serve; onboarding and review required
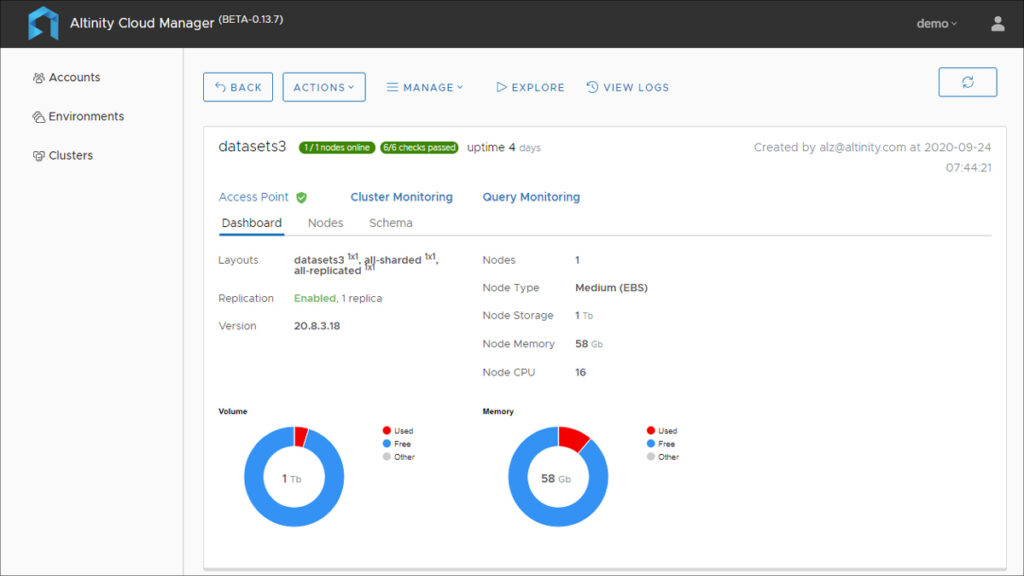
Altinity.Cloud is a fully managed ClickHouse service operated by ClickHouse specialists, available in Altinity’s cloud or in your own cloud account through a bring-your-own-cloud (BYOC) model. It runs 100% open source ClickHouse with no vendor lock-in and lets you run any version of the database.
You can deploy on AWS, GCP, Azure, or Hetzner in any region, using any VM or block storage type. Support is a central part of the offering, with a 24/7 engineering team that helps with schema and query optimization and resolves issues.
Key features include:
- Flexible deployment options: Run in Altinity’s cloud or your own cloud (BYOC) across AWS, GCP, Azure, or Hetzner, in any region, using any VM or block storage type.
- 100% open source with any version: Runs unmodified open source ClickHouse and lets you choose any ClickHouse version.
- Downtime-free scaling: Scale compute up or down and extend storage without downtime, and add shards and replicas to running clusters.
- Built-in availability and backups: High availability with redundancy and failover, plus automated backups.
- 24/7 engineering support: ClickHouse experts assist with schema and query tuning and provide bug and CVE fixes.
- Dedicated Kubernetes environment: Each account runs in its own dedicated Kubernetes environment.
- Data lake scaling: Project Antalya builds allow scaling ClickHouse queries using lower-cost data lakes.
- Security and compliance: SOC 2 Type 2 certified.
Limitations (based on publicly available sources):
- Onboarding process: Getting started involves guided onboarding and account review rather than instant self-serve provisioning.
- Built-in integrations: The platform offers a limited set of built-in integrations compared with some alternatives.
- Abstraction trade-offs: Some functionality available in a fully self-operated deployment may be constrained.
Self-Serve and Developer-Focused ClickHouse Hosting
3. ClickHouse Cloud

Best for: Teams wanting the official, serverless managed ClickHouse
Strengths: Built-in console monitoring, autoscaling, ClickPipes ingestion
Things to consider: Consumption pricing can be hard to predict; learning curve
ClickHouse Cloud is the official managed service from ClickHouse, Inc., the maintainers of the open source project. It is available on AWS, GCP, and Azure, with a bring-your-own-cloud option on AWS and GCP, and delivers a serverless experience with sub-second query performance.
Its cloud-native architecture separates storage and compute, so services autoscale with demand and can scale idle services to zero. The platform removes the operational work of managing shards, replicas, and infrastructure, letting teams focus on queries.
Key features include:
- Built-in monitoring in the console: Includes metrics and performance insights directly in the console, with Prometheus endpoints available.
- Serverless autoscaling: Compute scales up during load and down during idle periods, including scaling idle services to zero.
- Separation of storage and compute: An object-backed, shared-nothing architecture with compute-compute separation isolates read and write workloads.
- Managed ingestion with ClickPipes: A managed ingestion layer loads volumes from Apache Kafka, AWS S3, PostgreSQL, MongoDB, GCS, and MySQL.
- High availability and disaster recovery: Automatic replication across availability zones, scheduled automated backups, and guided restore workflows.
- Security and compliance: Encryption in transit and at rest, activity logging, query-time data masking, access controls, and SOC 2 Type II compliance.
- Interactive SQL console: Table explorer, query interface, data ingestion wizard, and visualization features.
- Automation: Terraform provider and infrastructure APIs for consistent configuration across deployments.
Limitations (as reported by users on G2):
- Query optimization expertise: Complex query tuning can require deeper ClickHouse knowledge.
- Custom functions: Some users want the ability to define their own custom functions and found this lacking.
- Materialized view constraints: Materialized views can be tedious to work with, including single-join limitations in some cases.
- Community support: Getting answers through community forums can be slow at times.
4. Tinybird

Best for: Developers building real-time analytics APIs over ClickHouse
Strengths: API-first, streaming ingestion, observability queries, git CI/CD
Things to consider: API-first, so you build your own UI; costs can rise at scale
Tinybird is a managed ClickHouse platform aimed at software developers and product teams who want to build real-time analytics features without operating the database themselves. It combines a hosted ClickHouse database with serverless scale and developer tooling that covers build, ingest, query, monitor, and iterate in one workflow.
Its core capability is publishing any SQL query as a scalable REST API endpoint, removing the need to build a separate backend. The platform runs from local development through to cloud scale, with data projects defined as code.
Key features include:
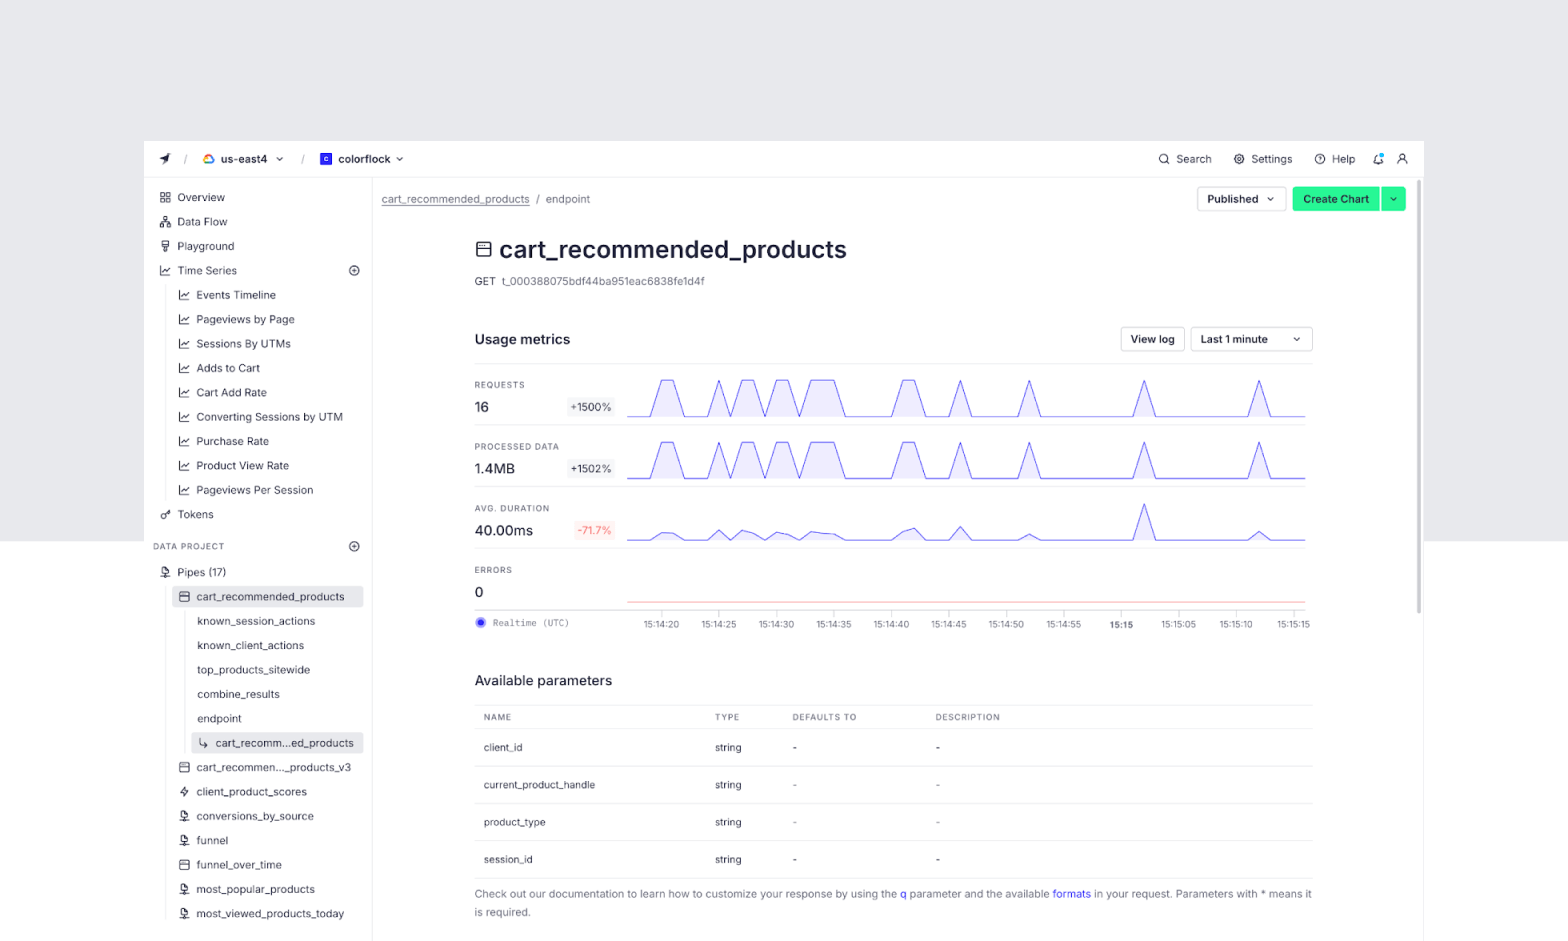
- Built-in monitoring and observability queries: A workspace to monitor and explore your data infrastructure, with observability logs you can query.
- Hosted API layer: Publish any SQL query as a scalable REST API endpoint without building a separate backend service.
- Managed streaming ingestion: Stream data over HTTP or through Kafka, S3, and GCS connectors using a hosted ingestion layer.
- Automatic schema migrations and managed upgrades: Schema changes and version upgrades are handled for you.
- Git integration and CI/CD: Define data projects as code and manage them through version control and CI/CD workflows.
- Developer and agent tooling: TypeScript and Python SDKs, a CLI, and an MCP server for building with coding agents.
- Enterprise infrastructure: Dedicated clusters, high availability with automatic failover, compute-compute separation, and zero-copy replication.
- Security and compliance: SOC 2 Type II, HIPAA, and GDPR compliant, with SSO and role-based access control.
Limitations (as reported by users on G2):
- Integrations breadth: Some users find the range of connectors and integrations limited for their data sources.
- Customization and scalability: Reviewers note limited customization and, for some needs, scaling constraints.
- Learning curve: The interface and ClickHouse SQL can be difficult for new or non-specialist users to navigate.
- Documentation and support: Documentation is described as incomplete, and support response times can vary.
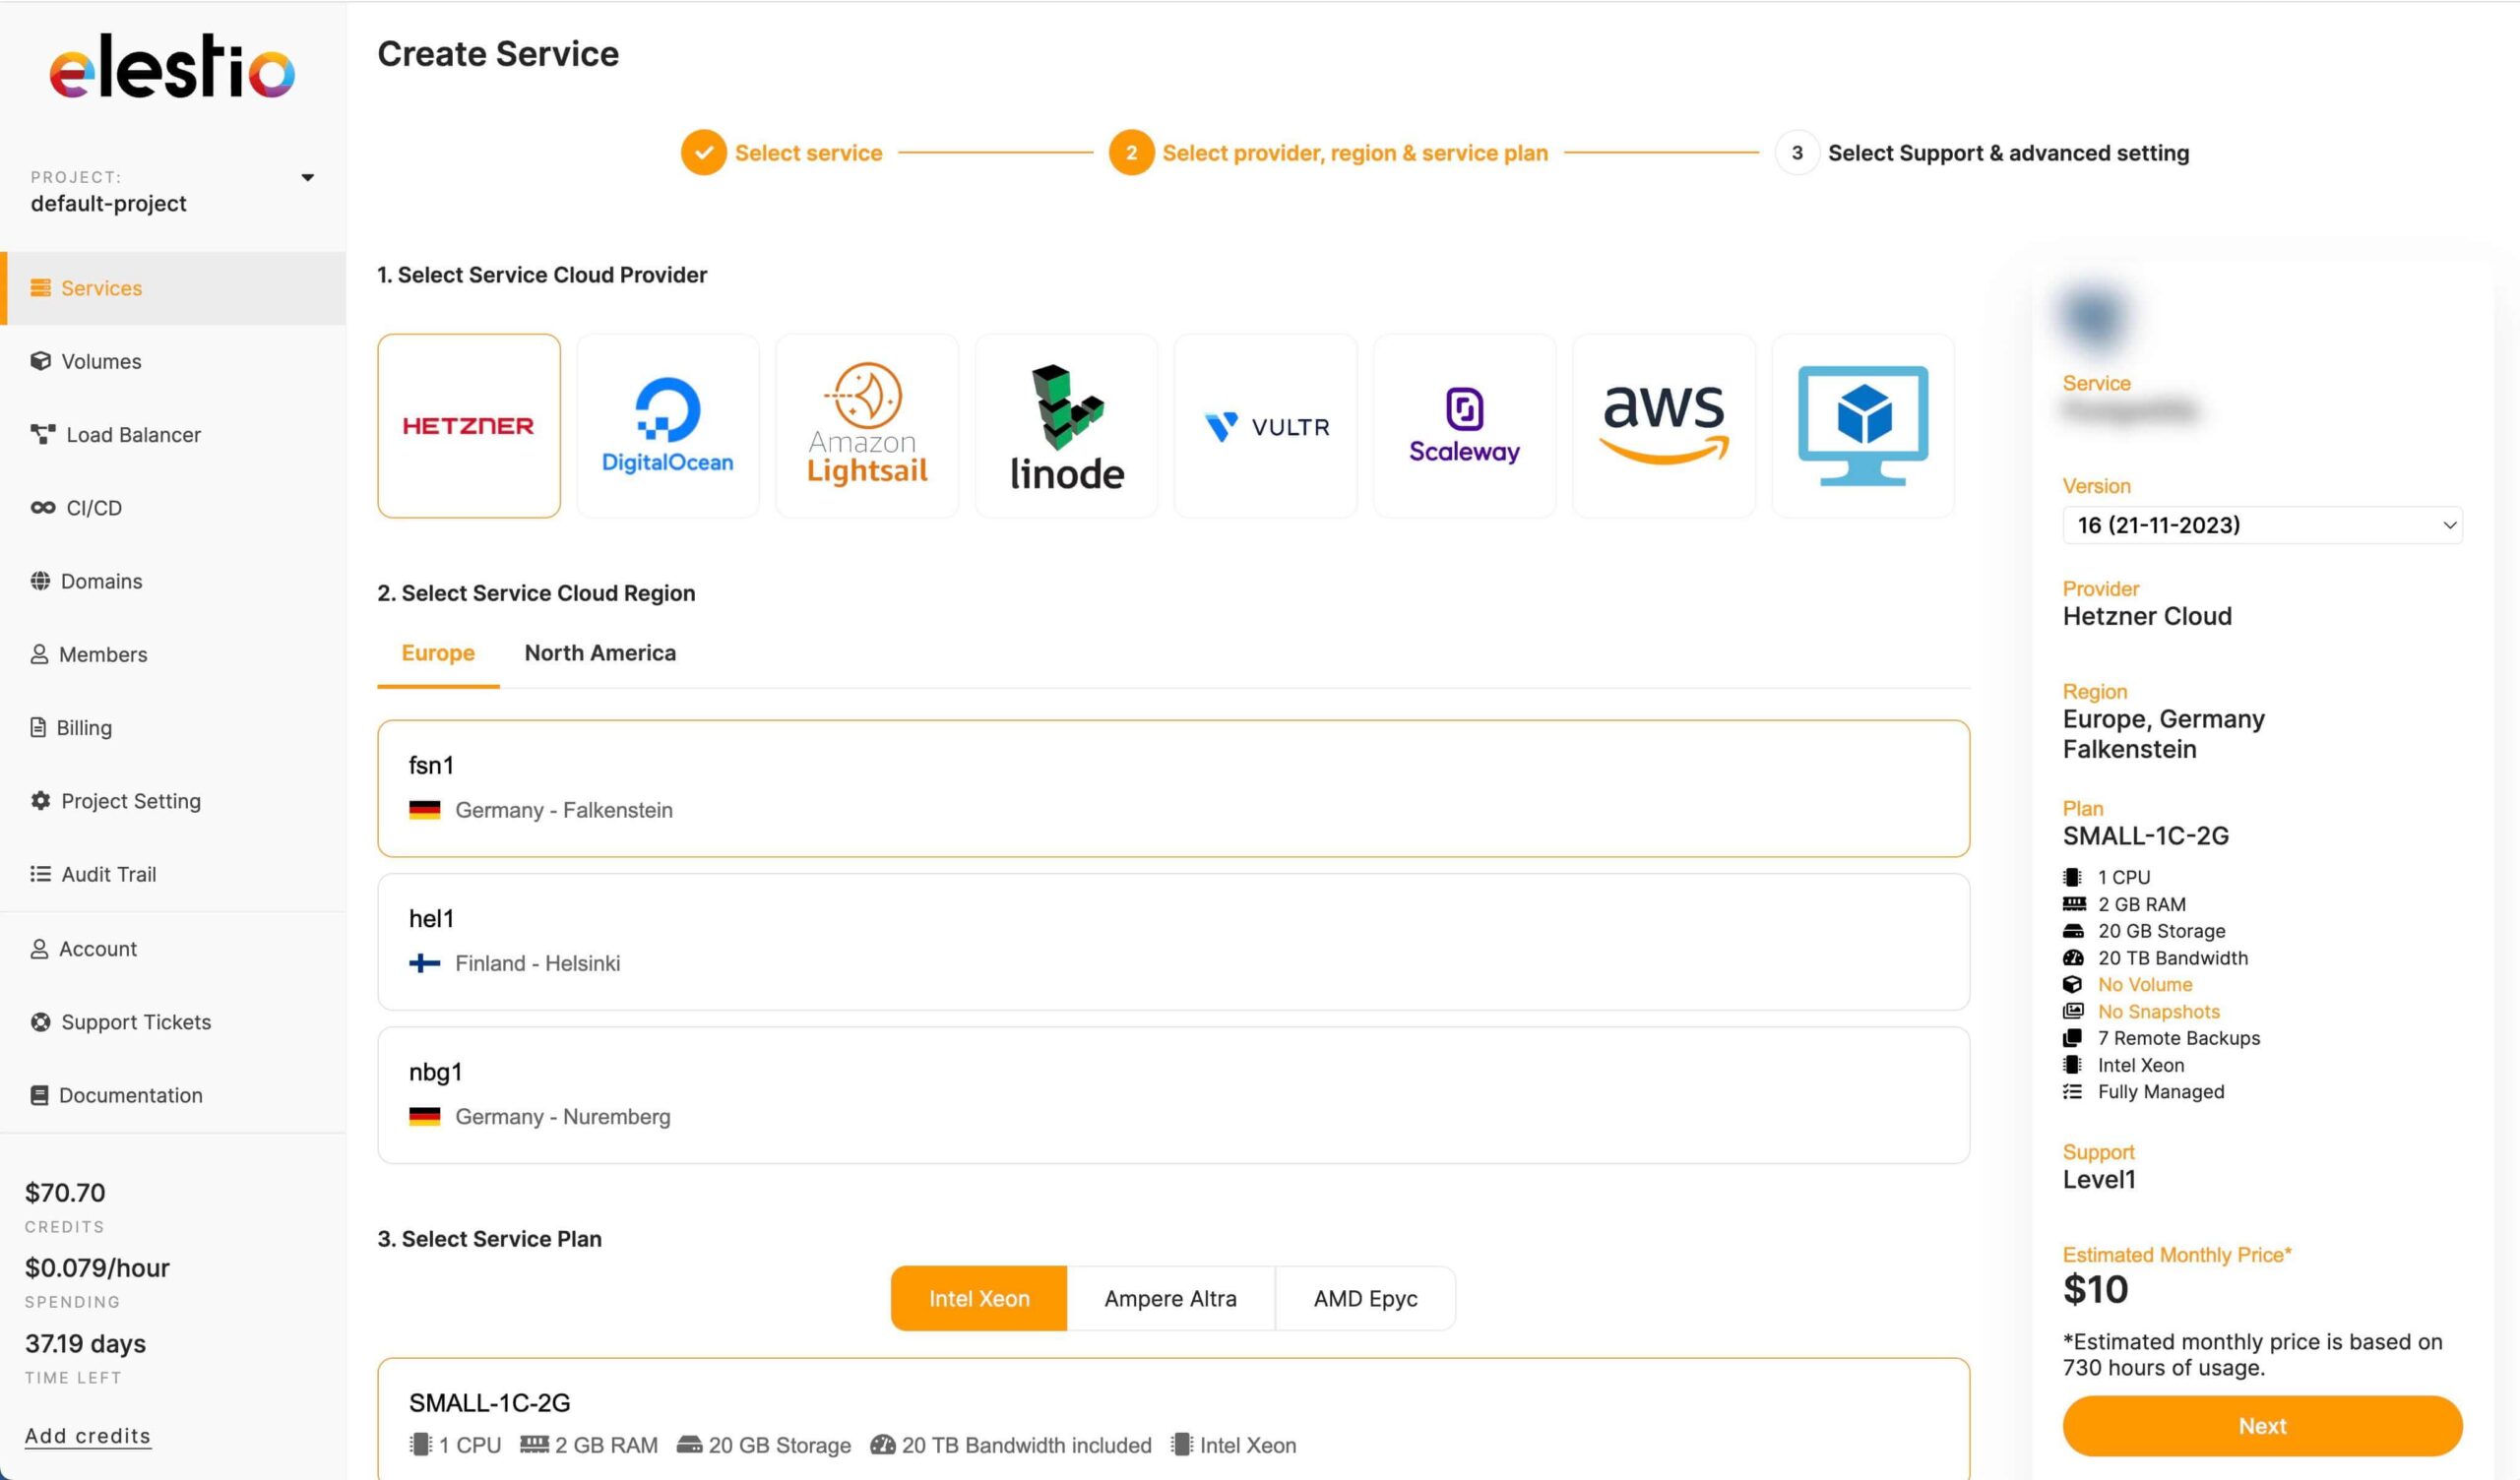
5. Elestio Managed ClickHouse

Best for: Teams wanting low-cost, self-serve managed ClickHouse on any cloud
Strengths: Monitoring and alerts included, dedicated VMs, flat pricing
Things to consider: Fewer deep-config controls; costs vary with complex setups
Elestio offers managed ClickHouse starting at a low monthly price, deployable in minutes on any supported cloud. It handles installation, configuration, encryption, security, backups, live monitoring, and software and OS updates, positioning itself as a lower-cost alternative to both heavy managed services and self-hosting.
Each service runs on a dedicated virtual machine, and pricing is all-inclusive and predictable. Elestio supports multiple cloud providers, on-premise deployment, and a bring-your-own-VM model, with no vendor lock-in.
Key features include:
- Built-in monitoring and alerts: Live monitoring and alerting are included with every deployment.
- Fully managed operations: Handles installation, configuration, encryption, security, backups, and software and OS updates.
- Dedicated virtual machines: Each service runs on its own dedicated VM with full resource access and kernel-level security.
- Automated backups and SSL: Automated backups and automatic SSL certificate management are included.
- Multi-cloud and BYOVM: Deploy across nine cloud providers and 100+ regions, on-premise, or bring your own VM.
- Predictable all-inclusive pricing: A flat monthly price covers compute, storage, bandwidth, updates, and maintenance.
- No vendor lock-in: Migrate or clone services to another cloud or region at any time.
- Built-in tools and DB migration: Browser-based VS Code and terminal access, plus a database migration service.
Limitations (as reported by users on G2):
Elestio is highly rated, so these points come from critical notes within positive reviews.
- Deep customization: Some users find it limiting when they want deeper control or customized infrastructure setups.
- Cost predictability: Resource usage costs can be hard to estimate upfront, especially for complex setups.
- BYOVM limits: Some users would like more generous limits on the number of instances and compute for bring-your-own-VM.