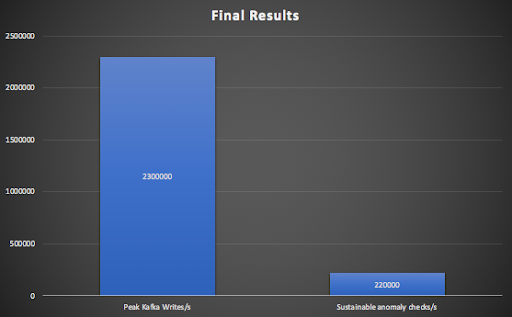
In this tenth and final blog of the Anomalia Machina series we tune the anomaly detection system and succeed in scaling the application out from 3 to 48 Cassandra nodes, resulting in some impressive numbers: 574 CPU cores (across Cassandra, Kafka, and Kubernetes clusters), 2.3 million writes/s into Kafka (peak), 220,000 anomaly checks per second (sustainable), which is a massive 19 billion anomaly checks a day.
1. The Scaling Journey
Odysseus’s final challenge was to regain his throne! Odysseus finally reached his homeland of Ithaca only to find his palace overrun with a crowd of 108 suitors who were drinking his wine, slaughtering his cattle, and courting his wife, Penelope. If he had rushed in without thinking, it would probably have ended badly. Instead, disguised as a beggar, he planned to recapture his throne. Penelope announced to the suitors that she would marry the man who could string the bow of Odysseus and shoot an arrow through 12 axes placed in a row. The suitors all tried and failed. When the “beggar” tried, he accomplished the feat! Throwing off his disguise, Odysseus fought and eliminated all the suitors.
Likewise, rather than attempting to jump straight to the end of the story and run the Anomalia Machina Application at a massive scale, we thought it prudent to scale it out on increasingly bigger clusters. The aim was to (a) discover how to scale it before committing a larger amount of resources, and (b) document how well it scales with increasing cluster sizes.
 Odysseus eliminates Penelope’s suitors (Source: Shutterstock)
1.1 Preparations
For the initial scalability testing, I simplified the approach to focus on Cassandra scalability and application tuning on my Kubernetes cluster. To do this I used a small production Kafka cluster (3 nodes with 4 cores each) to “replay” the same events that I had previously sent to it. Event reprocessing is a rich use case for Kafka that we explored in the blog Exploring the Apache Kafka “Castle” Part B: Event Reprocessing. Kafka consumers also place a very low load on Kafka clusters compared with producers, so this ensured that Kafka was not a bottleneck and the results were repeatable as I scaled the rest of the system.
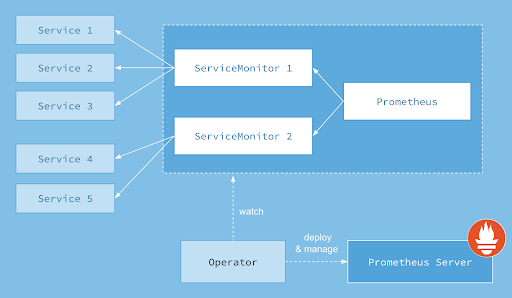
To get the Anomalia Machina application ready to scale there were a few things I improved from the previous blog. Given the likely increase in the number of Pods to monitor with Prometheus, the previous approach of running the Prometheus server on a laptop and manually adding each Pod IP address to the configuration file was no longer workable. To fix this I deployed Prometheus to the Kubernetes cluster and automated Pod monitoring using the Prometheus Operator.
Prometheus Kubernetes Operator
The first step is to install the Prometheus Operator and get it running. I did this by copying the yaml file:
https://github.com/coreos/prometheus-operator/blob/master/bundle.yaml
to my local machine, and running:
kubectl apply -f bundle.yaml
The Prometheus operator works by dynamically detecting and monitoring Pods with labels that match a selector. Some assembly is required.
- Service Objects monitor Pods (with labels that match the selector)
- ServiceMonitors discover Service Objects
- Prometheus objects specify which ServiceMonitors should be included
- To access the Prometheus instance it must be exposed to the outside world (e.g. by using a Service of type NodePort)
- When it doesn’t work the first time, you most likely need to create Role-based access control rules for both Prometheus and Prometheus Operator
See this documentation for all the steps and examples.
But now that Prometheus was running in the Kubernetes cluster it’s not easy for it to monitor the Kafka load generator (Kafka producer application) running on standalone AWS EC2 instances. I also wanted to ensure sufficient resources for the Kafka producer, so an obvious solution was to deploy it into the Kubernetes cluster. This turned out to be easy, just a simple copy/edit of the existing Kubernetes deployment artefacts to create a new Deployment type from the producer jar file. The Kafka producer load can now be easily increased by scaling the number of Pods. This also enables unified monitoring of both the producer application and the detector pipeline application by the Prometheus Operator. We’re now ready to continue with the scaling journey.
1.2 Pre-tuning

Pre-tuning: “La Jamais Contente”, first automobile to reach 100 km/h in 1899 (electric, 68hp) (Source: Wikipedia)
There are a few knobs to twiddle to tune the anomaly detector pipeline part of the application. Each Pod has 2 Kafka consumers (in a thread pool) reading events from the Kafka cluster and another thread pool which performs Cassandra writes and reads and runs the anomaly detection algorithm. A single Cassandra connection is initially started per Pod, but this can be increased automatically by the Cassandra Java driver, if the connection becomes overloaded (it didn’t).
There are therefore 2 parameters that are critical for tuning the application with increasing scale: (1) The number of Kafka consumers, and (2) the number of detector threads per Pod. The number of partitions for the Kafka topic must be greater than or equal to the number of Kafka consumers to ensure that every consumer receives data (any consumers in excess of the number of partitions will be idle). The number of detector threads per Pod is critical, as throughput peaks at a “magic” number, and drops off if there are more or less threads.
I initially assumed that I could scale-out by the relatively simple process of (1) tuning the detector thread pool at low load (1 Pod) for a 3 node cluster, and then (2) increasing the number of Pods for each bigger cluster until maximum throughput was obtained. I used this approach for increasing cluster sizes, doubling the number of nodes from 3 to 6, 12, and 24 nodes. Surprisingly this gave sub-linear scalability as shown by this graph.
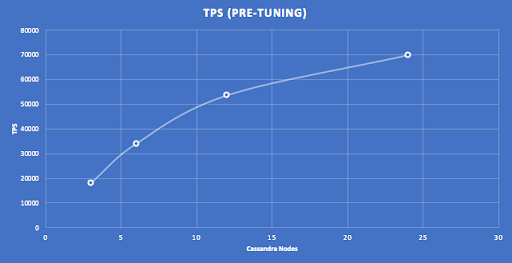
Given the theoretical perfect linear scalability of Cassandra with more nodes, something was obviously wrong with this application tuning approach.
1.3 Post-Tuning
To gain more visibility into what was actually going on, I made more metrics visible in Prometheus including the throughput for the Kafka consumers, the detector thread pool, and different detector events including detector run or not run (>= 50 rows returned from Cassandra or < 50 rows), and the number of rows of data read from Cassandra. This enabled confirmation that the business metric was correct (only reporting when >= 50 rows for every ID), and checking/tuning the thread pool so that the consumer/detector rates are steady-state (one is not getting ahead/behind the other), as this can be suboptimal.
I then reran the benchmark and using the increased visibility the extra metrics gave, improved the tuning approach for smaller iterations of cluster sizes (adding only 3 nodes at a time rather than doubling the number as above). Adding extra nodes to an existing Cassandra cluster is easy with an Instaclustr managed Cassandra cluster, as there is a button on the console to automatically add extra nodes. This also sped up the benchmarking process as I didn’t have to reload the data into Cassandra at the start of each run (as I did for a new cluster each time), as it was already in place.
Note that I kept the Kafka cluster the same size for these experiments (as load from the Kafka consumers was minimal, < 10% CPU), but I did increase the size of the Kubernetes cluster by increasing the number of Kubernetes worker nodes each time CPU utilization went over 50% to ensure the application resources weren’t a bottleneck.
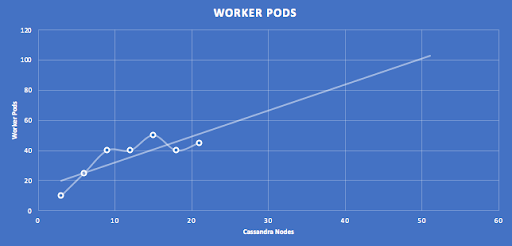
The following graphs show the post-tuning results for clusters from 3 to 21 nodes, with linear extrapolation to 50 nodes. The number of expected Pods for 50 nodes is approximately 100.
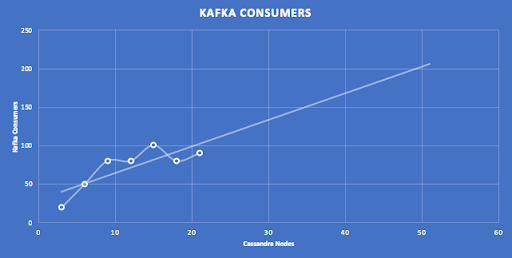
A similar graph but this time showing the predicted number of Kafka consumers (2 x Pods) for a 50 node cluster to be around 200.
This graph shows the results of tuning the number of detector threads per pod with increasing Cassandra nodes, and linear extrapolation predicts more than 250 threads per Pod for a 50 node Cassandra cluster.
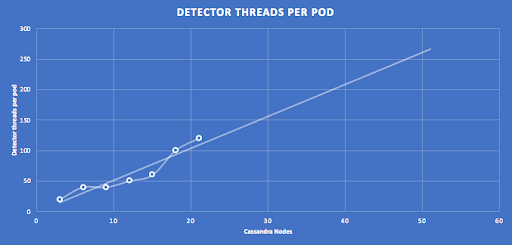
Note that there was up to +/-10% variation in results across runs with identical configurations, and that the tuning may not be 100% optimal for some of the middle-sized clusters (i.e. slightly too many pods and insufficient threads per pod). However, it is likely that extrapolation over 7 data points gives reasonable predictions for bigger clusters.
Did all the tuning help? Yes, from 3 to 21 node Cassandra clusters we now have significantly better scalability compared with the first attempt, now close to perfect linear scalability (within the +/-10% error variation) as shown in this graph.
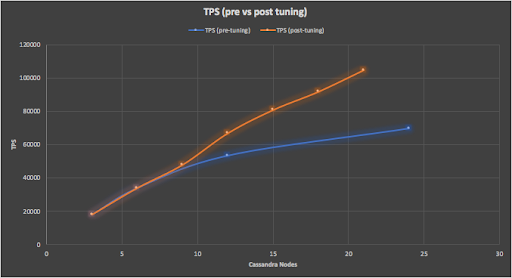
Observation: Apache Cassandra is perfectly linear scalable (as it’s a shared nothing architecture there are no shared resources that can become bottlenecks with increased nodes), but you need to put some effort into application optimization. Cassandra will handle large numbers of connections, but for good scalability try to minimize the total number of Cassandra connections by optimizing the use of each connection.
 Post-tuning: Fast-forward 120 years… “Pininfarina Battista” the fastest car in the world, 0-100 kph in 2 seconds, top speed 350 kph (electric, 1,900hp). (Source: Wikimedia Commons – Photographer Alexander Migl)
2. Results at Massive Scale—2.3 Million Writes/s Into Kafka
- 220,000 anomaly checks per second (sustainable)
- 400 million events checked for anomalies in 30 minutes
- 19 billion anomaly checks a day
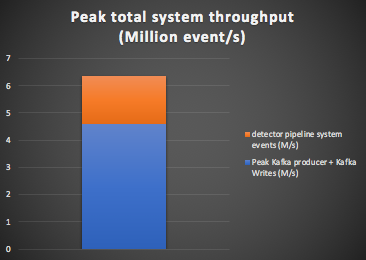
- 6.4 million events/s total “system” throughput (peak)
- 574 CPU cores across Cassandra, Kafka, Kubernetes
For the final run, we revisited the original “Kafka as a buffer” use case (to decouple event producers from consumers). We want a Kafka cluster that will process at least 2 million write/s for a few minutes to cope with load spikes while enabling the rest of the anomaly detection pipeline to scale and run at maximum capacity to process the backlog of events as fast as possible.
Based on the experience of tuning the application up to a 21 node Cassandra cluster we hopefully have sufficient experience to tackle the final challenge and scale up to something even bigger—a 48 node cluster.
2.1 Kafka Cluster Sizing
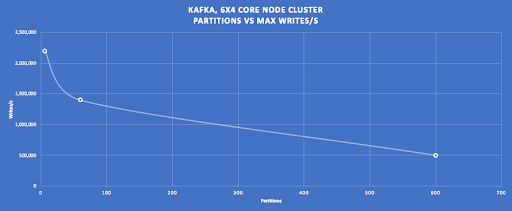
Based on the predictions above it looked like we needed 200 partitions on the Kafka side. I, therefore, spun up some different sized Kafka clusters and experimented with increasing producer throughputs and number of partitions.
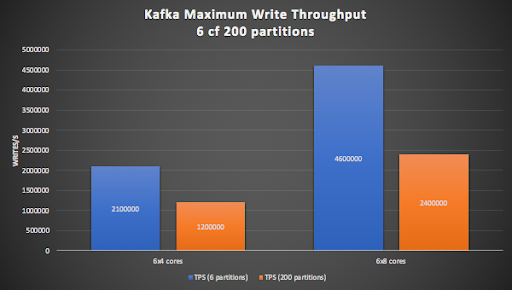
Using a 6 node (4 CPU cores per node) Kafka cluster as a starting point, it’s apparent that the write throughput drops significantly with increasing partitions (This turns out to be due to the number of partitions being written to, rather than just in existence, as writing to only 6 out of 600 partitions results in the same throughput as if there were only 6 partitions).
Using bigger Kafka node sizes (8 cores per node) gets us into the target (>= 2M write/s) range for 200 partitions (right-hand orange bar), but the cluster is close to maxed out, so we decided to use a 9 node (8 CPU cores per node) Kafka cluster, as we don’t want the Kafka cluster to be a bottleneck.
Initial testing revealed that 9 Kafka Producer Pods was sufficient to exceed the write/s target of 2M/s for the 9×8 Kafka cluster with 200 partitions.
2.2 48 Node Cassandra Cluster
To get the final results we spun up a 48 node Cassandra cluster on AWS using the Instaclustr console. We then tuned the application thread pool (thread pool 2 in the diagram in section 2.4) and increased the number of Pods while monitoring the application metrics in Prometheus, and the Kafka and Cassandra cluster metrics using the Instaclustr console. We reached the maximum anomaly checks/s with 100 Pods, with 300 detector threads per Pod (slightly more than predicted, giving a total of 30,000 detector pipeline application threads), and with the Cassandra cluster running close to flat out at 97% CPU (higher than recommended for a production cluster), and Kafka with some headroom at 66% CPU.
To test the Kafka as a buffer use case we switched from replaying existing Kafka events to reading new events, ramped up the Kafka producer load over 2 minutes, and held the load at maximum for a further 2 minutes before terminating.
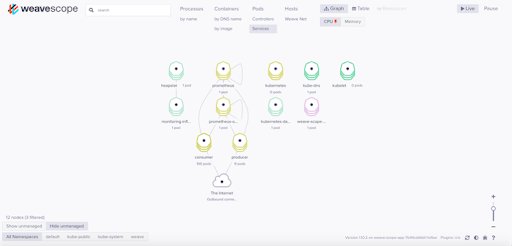
After a few false starts, I found it useful to use an open source Kubernetes tool, Weaveworks Scope, to see that everything was working as expected. It is easy to connect to the Kubernetes cluster and supports different views and filtering of nodes. This view shows the main Services (some of which I’d had problems with configuring previously) and shows that Prometheus is correctly deployed and monitoring 100 Consumer Pods and 9 Producer Pods via the Prometheus operator.
Here are the specifications of the final system.
Cluster Details (all running in AWS, US East North Virginia)
Instaclustr managed Kafka – EBS: high throughput 1500 9 x r4.2xlarge-1500 (1,500 GB Disk, 61 GB RAM, 8 cores), Apache Kafka 2.1.0, Replication Factor=3
Instaclustr managed Cassandra – Extra Large, 48 x i3.2xlarge (1769 GB (SSD), 61 GB RAM, 8 cores), Apache Cassandra 3.11.3, Replication Factor=3
AWS EKS Kubernetes Worker Nodes – 2 x c5.18xlarge (72 cores, 144 GB RAM, 25 Gbps network), Kubernetes Version 1.10, Platform Version eks.3
2.3 Raw Results in Prometheus and Grafana
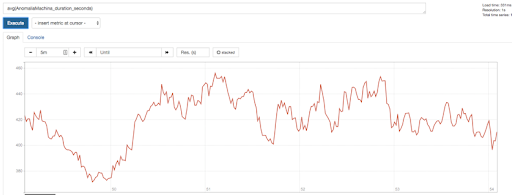
Here are the raw results. The average latency of the detector pipeline (from reading an event from Kafka, to deciding if it is an anomaly or not) was under 460ms for this test as shown in this Prometheus graph.
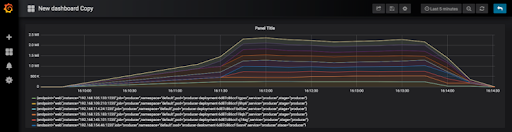
The next graph shows the Kafka producer ramping up (from 1 to 9 Kubernetes Pods), with 2 minutes load time, peaking at 2.3M events/s (this time in Grafana). Note that because each metric was being retrieved from multiple Pods I had to view them as stacked graphs to get the total metric value for all the Pods.
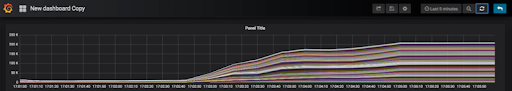
This graph shows the anomaly check rate reaching 220,000 events/s and continuing (until all the events are processed). Prometheus is gathering this metric from 100 Kubernetes Pods.
2.4 Is this a good result?
Ten years ago it was considered “impractical to present an entire series of transactions” to an anomaly detection system. Instead, they recommended using aggregated historical data. However, we’ve demonstrated that current technology is more than up to the task of detecting anomalies from the raw transactions, rather than having to rely on aggregated data.
How do our results compare with more recent results? Results published in 2018, for a similar system, achieved 200 anomaly check/s using 240 cores. They used supervised anomaly detection which required training of the classifiers (once a day), so they used Apache Spark (for ML, feature engineering, and classification), as well as Kafka and Cassandra. Taking into account resource differences, our result is around 500 times higher throughput, and with faster real-time latency. They had more overhead due to the “feature engineering” phase, and their use of Spark to run the classifier introduced up to 200s latency, making it unsuitable for real-time use. With a detection latency under 1s (average 500ms), our solution is fast enough to provide real-time anomaly detection and blocking. If the incoming load exceeds the capacity of the pipeline for brief periods of time the processing time increases, and potentially anomalous transactions detected then may need to be handled differently.
2.5 Analysis
To summarise, the maximum Kafka writes/s reached 2.3M/s, while the rest of the pipeline managed a sustainable 220,000 anomaly checks/s.
The numbers are actually bigger than this if we take into account all the events in the complete system (i.e. all the events flowing between the distributed systems). In the previous blog we showed that for every anomaly check decision, there are many other events contributing to it. For the load spike scenario, we need to take into account the bigger Kafka load spike (Y, blue line, 2.3M/s) and the smaller detector pipeline rate (Z, orange line, 220,000/s):
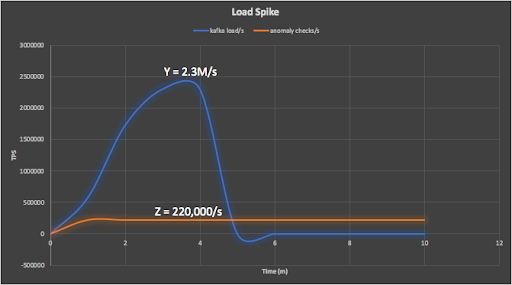
The peak total system throughput calculation is slightly different from the previous steady-state calculation as the load spike (Y) is produced by the Kafka load generator (step 1) and written to the Kafka cluster (step 2) until the rest of the pipeline catches up and processes them (steps 3-10, at maximum rate Z).
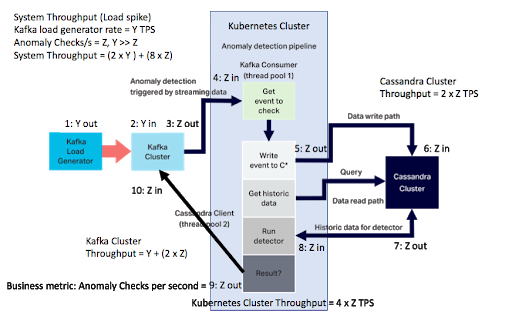
The peak system throughput is therefore (2 x Peak Kafka load) + (8 x anomaly checks/s) = (2 x 2.3M) + (8 x 0.22) = 6.4 million events/s as shown in this graph:
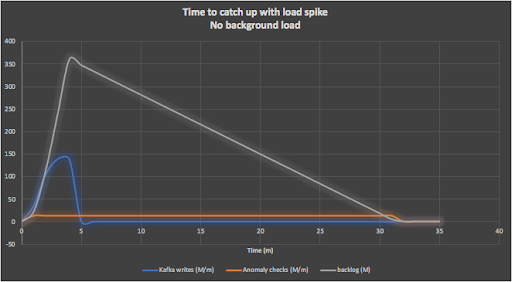
Here are some more big numbers. The 4 minutes of events (ramp up and load) into Kafka produces 400 million events to be checked, and it takes the anomaly detection pipeline 30 minutes to process all the events. The following graph shows this scenario (note that rates are in millions per minute):
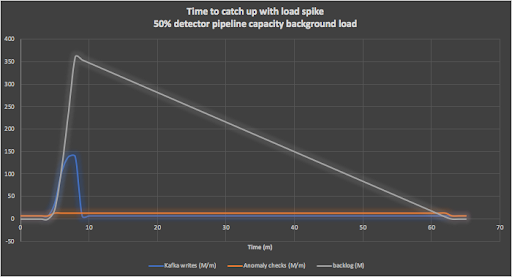
A more realistic scenario is to assume that on top of the load spike, there is an average background load of say 50% of the pipeline capacity running continuously (110,000 events/s). It then takes 60 minutes to clear all the events due to the load spike as shown in this graph:
Under what circumstances would this be useful? Imagine we have an SLA in place to process say 99% of events per week in under 1s, with an upper bound of 1-hour latency. Assuming load spike events like this are relatively infrequent (e.g. once a week) then these scenarios can satisfy a 99.4% SLA (1 hour is 0.6% of a week).
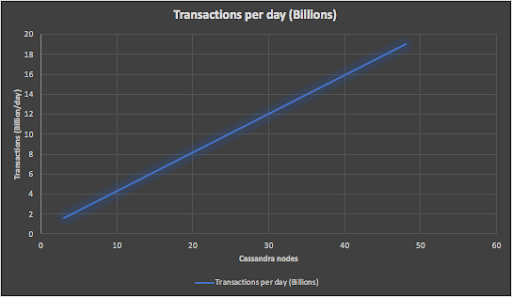
And for our final and Biggest Number, the following graph shows that our largest Anomalia Machine system with 48 Cassandra nodes has more than sufficient capability to process 19 billion anomaly checks a day.
2.6 How Big is Anomalia Machina?
How big is our final Anomalia Machina “machine”? Here’s a graph showing the business metric vs the number of cores used for the Cassandra, Kafka, and Kubernetes clusters and the total system.
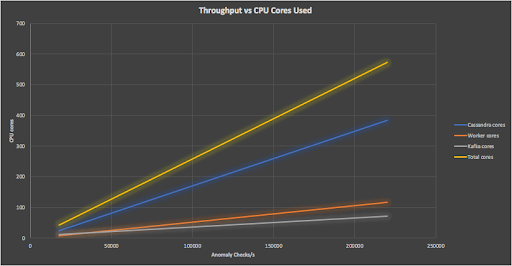
The complete machine for the biggest result (48 Cassandra nodes) has 574 cores in total. This is a lot of cores! Managing the provisioning and monitoring of this sized system by hand would be an enormous effort. With the combination of the Instaclustr managed Cassandra and Kafka clusters (automated provisioning and monitoring), and the Kubernetes (AWS EKS) managed cluster for the application deployment it was straightforward to spin up clusters on demand, run the application for a few hours, and delete the resources when finished for significant cost savings. Monitoring over 100 Pods running the application using the Prometheus Kubernetes operator worked smoothly and gave enhanced visibility into the application and the necessary access to the benchmark metrics for tuning and reporting of results.
The system (irrespective of size) was delivering an approximately constant 400 anomaly checks per second per core.
It is worth noting that the Cassandra cluster is more than 5 times bigger than the Kafka cluster, even though the Kafka cluster is processing an order of magnitude larger load spike (2.3M/s) than the Cassandra cluster (220,000/s). It is obviously more efficient (easier, cheaper, more elastic) to use “Kafka as a buffer” to cope with load spikes rather than to increase the size of the Cassandra cluster by an order of magnitude (i.e. from 48 to 480 nodes!) in a hurry. However, it is possible to dynamically resize a Cassandra cluster given sufficient warning. Instaclustr’s dynamic resizing for Apache Cassandra enables vertical scaling up or down in minutes (20-30 minutes for a complete cluster, but the capacity starts to increase almost immediately). The biggest increase in capacity is from r4.large (2 cores) to r.4xlarge (16 cores) giving a capacity increase of 8 times. This would be sufficient for this scenario if used and in conjunction with Kafka as a buffer, and would result in significantly faster processing of the event backlog. I tried this on a smaller cluster with resizing one node at a time (concurrent resizing is also an option), and it worked flawlessly. For this to work you need to have (1) created a resizable Instaclustr Cassandra cluster, (2) with sufficient nodes to enable vertical scaling to satisfy the target load, and (3) enable elastic scaling of the application on Kubernetes (this is another challenge).
2.7 Affordability at Scale
We have proven that our system can scale well to process 19 billion events a day, more than adequate for even a large business. So, what is the operational cost to run an anomaly detection system of this size? This graph shows that it only costs around $1,000 a day for the basic infrastructure using on-demand AWS instances.
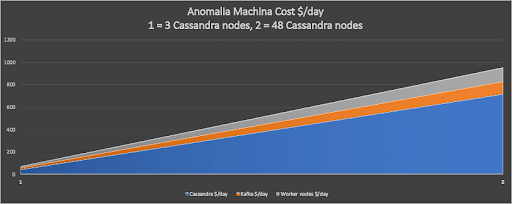
This graph also shows that the system can easily be scaled up or down to match different business requirements, and the infrastructure costs will scale proportionally. For example, the smallest system we ran still checked 1.5 billion events per day, for a cost of only $100/day for the AWS infrastructure.
Admittedly, the total cost of ownership would be higher (including R&D of the anomaly detection application, ongoing maintenance of the application, Managed service costs, etc). Assuming a more realistic $10,000 a day total cost (x10 the infrastructure cost), the system can run anomaly checks on 1.9 million events per dollar spent.
___________________________________________________________________
Code
The sample Open Source Anomalia Machina application code is now available from the Instaclustr GitHub.
Epilogue
 (Source: Shutterstock)
Just as Homer’s epic was an exercise in unbounded imagination (e.g. Heroes, gods, monsters such as Polyphemus the one-eyed cannibal Cyclops, the alluring Sirens, Scylla the six-headed sea snake, Calypso the Nymph), the size and use cases of a scalable Anomaly Detector system are only limited by your imagination! In this series we have demonstrated that a combination of open source technologies (Kafka, Cassandra, Kubernetes, Prometheus) and Instaclustr managed Kafka and Cassandra clusters can scale to detect anomalies hidden in Billions of events a day, provides a significant return/cost ratio and actual dollar savings, and is applicable across many application areas. Do you have a Homeric scale imagination?
To find out more about our Managed Platform for Open Source Technologies, contact us or sign up for a free trial.