After going through the process of setting up your clusters with Instaclustr and connecting with your applications, you’re likely going to want to monitor your cluster. Instaclustr offers a number of ways to do this, including viewing metrics through our Console. For situations when you want to view your Instaclustr metrics in a single view with other metrics from your application stack, Instaclustr also offers a Prometheus endpoint which allows for the ingestion of your cluster metrics into Prometheus.
If you are unfamiliar with Prometheus, it is an open source monitoring system and time-series database, which is used to monitor metrics from a source and then aggregate them so they can be queried by other tools, such as Grafana.
If you’re interested in setting up Prometheus to monitor your cluster, there are a number of ways in which you could do so, and each user’s architecture will have an impact on how best to proceed. However, one way which may be adaptable to a lot of environments is deploying Prometheus in a container using Docker. Amazon Web Services (AWS) offers a scalable solution in its Elastic Container Service (ECS), which deploys containers and manages the underlying infrastructure, making it a good choice for deploying Prometheus in a container. Below I’ll detail how to set up Prometheus on ECS (along with Grafana) to scrape metrics from your Instaclustr cluster.
Prerequisites
Before starting, you’ll need to have a few things configured:
- An AWS account and the AWS CLI Tool set up and running with credentials that have sufficient permissions to access ECS, as well as the region and keys.
- Docker (or Podman) set up and running locally on your machine, and familiarity with how Docker works.
- A running Instaclustr cluster.
Hosting Prometheus Locally
To get started, we need to create both Prometheus and Docker configurations which match our Instaclustr cluster. It is best to get this working locally before moving to the stage of hosting on AWS. We’ll also include the open source version of Grafana dashboard so that we can view our metrics in an easier way.
First, let’s create a configuration file for Prometheus so it can connect to the Instaclustr cluster. Store this file in a new folder and call it prometheus.yml. The content of this file will be similar to the example below, however the Instaclustr Console will include an exact configuration you can use. To find your configuration, go to the Instaclustr Console > Your Cluster > Connection Info and find ‘Scrape Config’. You’ll also need to generate a Prometheus key from the Instaclustr Console. Do this by going to the Settings Cog > Account Settings > API Keys. You can also read more about these configurations on our Prometheus Support page.
|
1 2 3 4 5 6 7 8 9 10 11 12 13 14 15 16 17 18 19 |
global: scrape_interval: 20s evaluation_interval: 20s scrape_configs: - job_name: instaclustr_prometheus scheme: https http_sd_configs: - url: https://<YOUR_ACCOUNT_ID>.prometheus.monitoring.instaclustr.com/discovery/v1/ #Note, both basic authorizations below are required. basic_auth: #get from account settings page username: <YOUR_IC_USERNAME> password: <YOUR_PROMETHEUS_API_KEY> metrics_path: 'metrics/v2/query' basic_auth: #get from account settings page username: <YOUR_IC_USERNAME> password: <YOUR_PROMETHEUS_API_KEY> |
Next create a Docker compose file called docker-compose.yml that we can use to specify our Docker configuration. Here we’ll specify to use the Prometheus and Grafana Open Source (OSS) Images, and the configuration file we just created.
|
1 2 3 4 5 6 7 8 9 10 11 12 13 |
version: '3.3' services: prometheus: ports: - '9090:9090' volumes: - './prometheus.yml:/etc/prometheus/prometheus.yml' image: prom/prometheus grafana: image: grafana/grafana-oss:latest ports: - '3000:3000' |
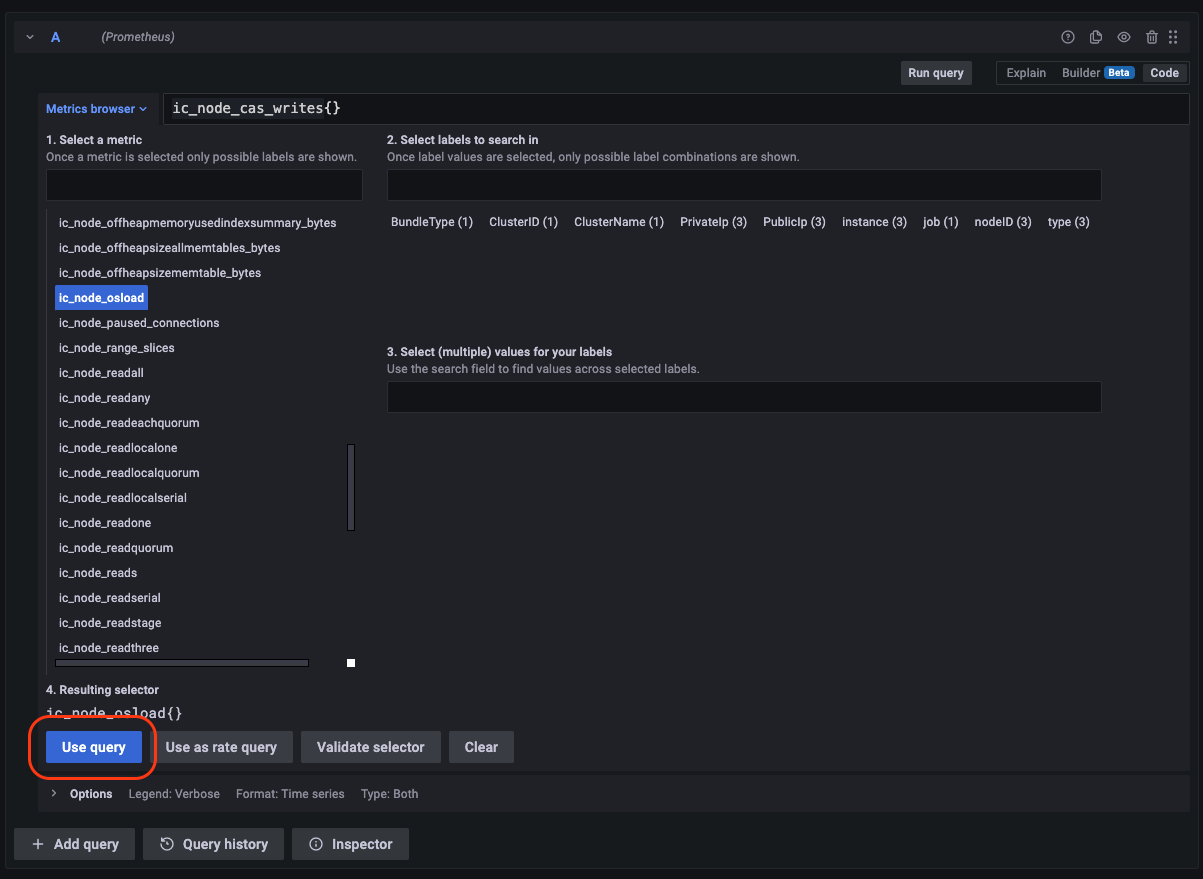
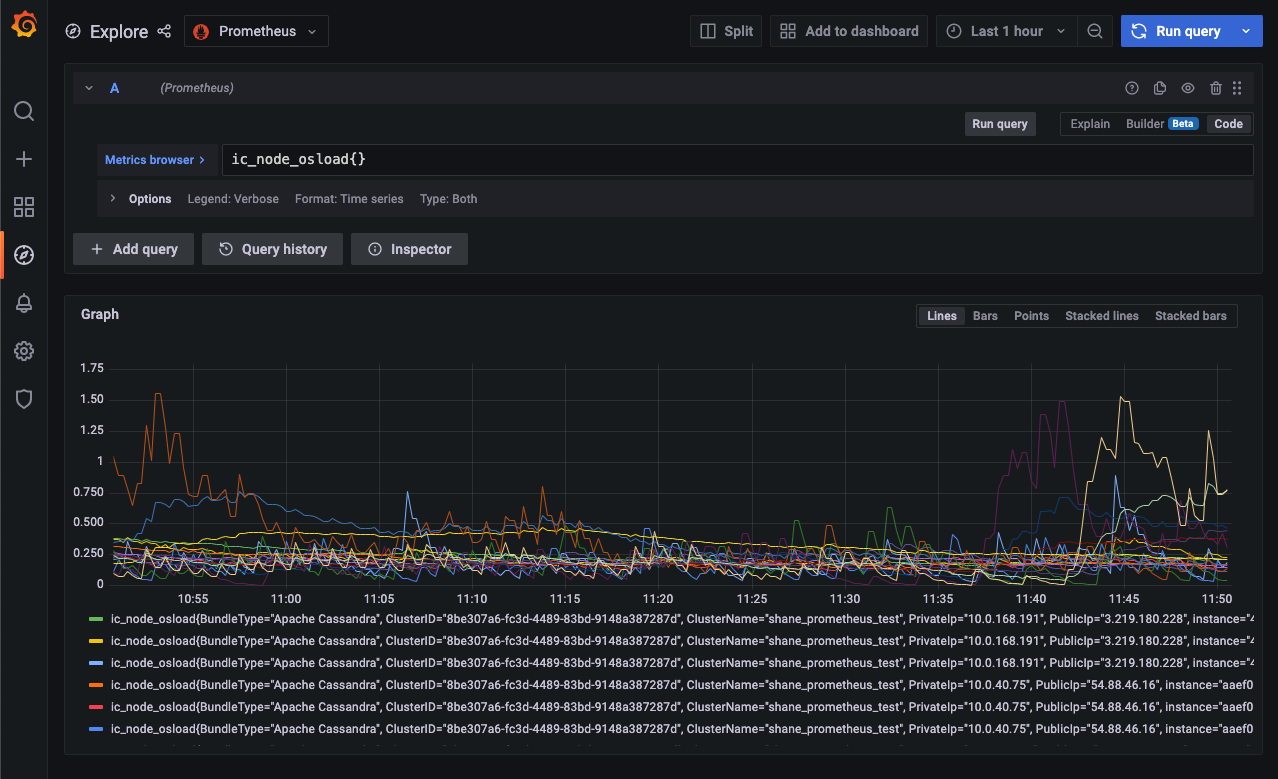
Start the container with the command docker-compose up -d . The Grafana dashboard should now be available at https://localhost:3000. Log in with the default admin:admin credentials, then connect to the Prometheus instance by selecting Add Data Source, and then pointing to the Prometheus server at https://prometheus:9090. We can now test out the connection. Head to the Explore Tab of Grafana. Open the Metrics browser and select any of the ic_node_* metrics. A good one to test is ic_node_os_load. Select it and press Use Query button. You should be presented with a nice-looking graph with some metrics starting to appear.
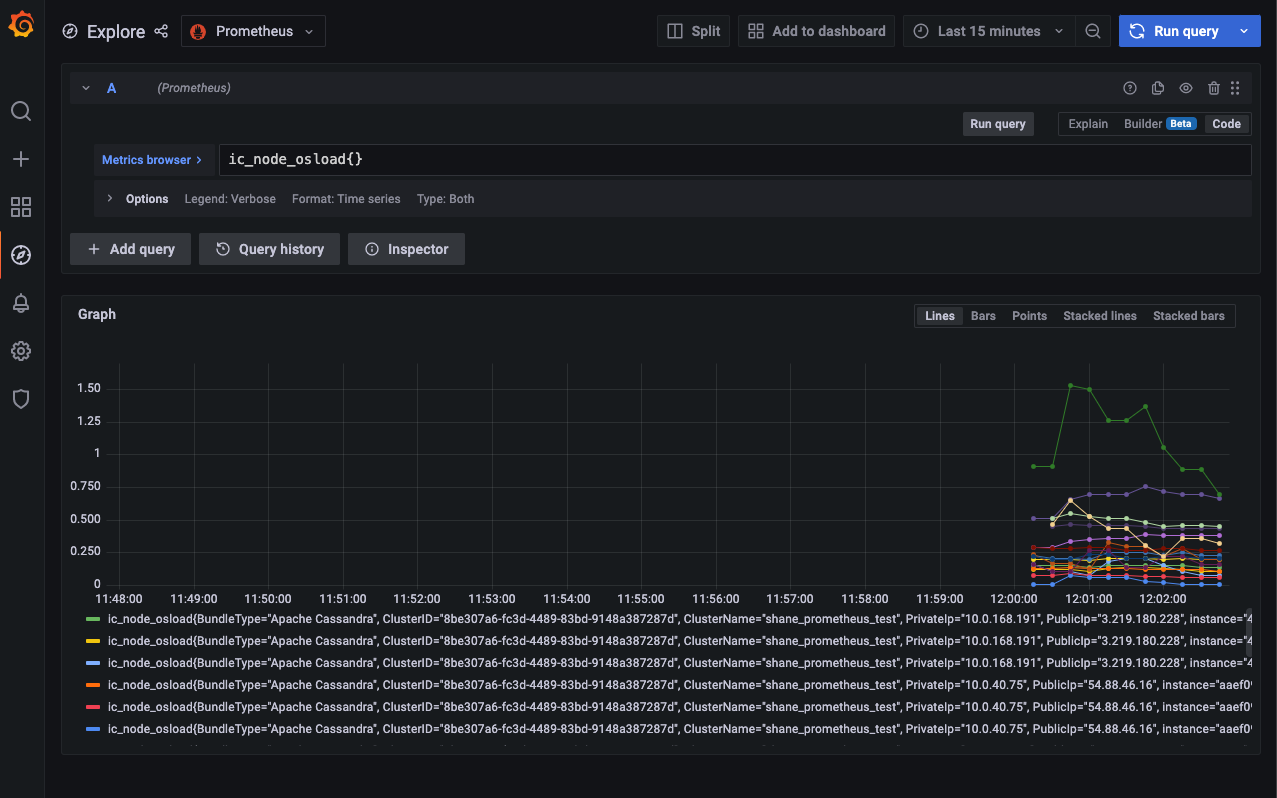
If you’re seeing metrics then the first hurdle has passed, and your configuration is correct. Stop your Prometheus container by using the command docker-compose downand we can move onto hosting our container in AWS.
Creating the Image
The next step is to create a container image that includes both the current version of Prometheus, and the configuration file that was just created, which can then be hosted on ECS. This is because for this example we won’t be setting up any storage on ECS to hold the configuration file, so we need to include this as part of the container
Before creating our custom Prometheus Docker container, we’ll need to create somewhere to push our Docker container to. For this demo, we’ll do this using AWS Elastic Container Repository (ECR), (but if you have an existing registry, you can use that instead). To create a custom registry to hold our container:
- Go to the Elastic Container Registry dashboard by searching the AWS Console
- Select Create Repository
- Set the visibility to private
- Set an identifiable name
- Keep all of the other settings the same and select Create Repository.
Now, to create the custom image. ECS includes a handy set of commands to do this, but first we’ll need something called a Dockerfile that specifies what the image should do. Here is the example code, save it into the same directory as your other files as a file called Dockerfile (no extension required).
|
1 2 3 |
FROM prom/prometheus:latest COPY './prometheus.yml' '/etc/prometheus/prometheus.yml' EXPOSE 9090 |
The Dockerfile uses the Prometheus image as a base and copies in our custom configuration. Next, to build and push the image: Go to the ECR console, select the repository you created and then select View Push Commands. Follow each of the steps to build and push your image. At the end of this stage, you should be able to view your newly pushed image in the ECR console.
Running Prometheus on ECS
Now that our image has made it to AWS, we can go through the steps of configuring ECS to host our containers and start collecting metrics into Prometheus.
Create New ECS Cluster
First we will create an ECS cluster. What ECS will do in the background is set up an EC2 instance attached to our cluster, with all of the software installed ready to accept our Docker container.
To create a new ECS cluster:
- Go to the ECS console and select Create Cluster.
- Select EC2 Linux + Networking
- Enter an identifiable cluster name, for example prometheus-demo-cluster
- Under instance configuration, set the provisioning model to on demand, and the instance type to an appropriate size for your budget. I will choose a t3.small, however you may need more or less capacity depending on your Instaclustr cluster size. Take note of the instance memory size also (find this at Amazon’s EC2 Instance Types page), as we’ll use it in a future step.
- Under networking select the default AWS VPC, rather than creating a new VPC. If you wish to use a custom VPC, ensure that you have permission to update the ingress rules, as we need to update them in a future step.
- Select a valid subnet, and set Auto Assign Public IP to Enabled.
- Select the existing default security group, we will modify this later.
- Select Create. This may take a few minutes while AWS provisions all of the required infrastructure in the background.
Create New Task Definition
Next, we need to tell ECS what containers we want to run, and how to run them. In ECS, this is called a task. We’ll need to do a few things in this section—add our custom Prometheus container to the task, add a Grafana container to the task, and expose Grafana to the Internet.
To create a new task to run our container:
- In the left-hand navigation menu, select Task Definitions and then Create New Task Definition
- Select EC2, as we will be running our task on an EC2 based cluster
- Enter a task name
- Set the Network Mode to Bridge
- Select Add container
- Enter a container name, keep it to something identifiable
- For the image, select the ECR image which you pushed in the previous section. You can get the link for this from the ECR Page in the AWS console. Map the container and host ports to 9090. Don’t worry, we won’t expose the unauthenticated Prometheus instance
- Enter a memory limit. This needs to be less than the memory available to the EC2 instance which we selected in step 4 of the previous section
- Select Add
- Add a second container, this time pulling the Grafana image grafana/grafana-oss:latest. Map the host and container ports to 3000. We’ll let this port through the firewall to the internet in another step
- Scroll down and select Create.
Start the Task
Now we’re onto the final steps of setting up a Prometheus cluster to collect metrics from our Instaclustr cluster. All we have to do is start the containers and allow the Grafana endpoint through the firewall.
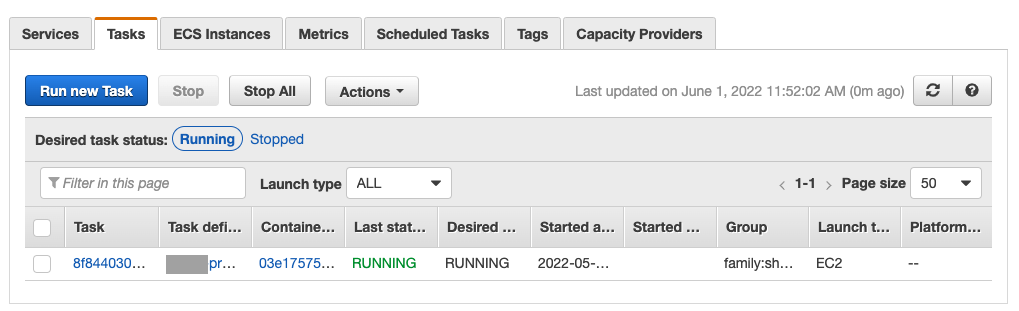
First, select your ECS cluster from the Clusters tab on the ECS page. Then select Tasks > Run new Task. Then, select the launch type as EC2, and under family select your task.
Select Run Task and you’ll be redirected back to the EC2 Cluster page. Under Tasks you’ll be able to see if the container reaches running. If it doesn’t refresh the page after a few seconds.
After it reaches running, there’s one final step to take—allowing the exposed Grafana port through the firewall.
Exposing the Port
To expose the port:
- Select EC2 Instances in the ECS Console then click on the ECS Instance. This will redirect you to the EC2 console
- Click on the Instance and then select Security. Select the Security Group
- Under Inbound Rules, select Edit Inbound Rules
- Add a new Rule and Select Custom TCP. Set the Port to 3000, and the Source to 0.0.0.0/0.
- Save the rules.
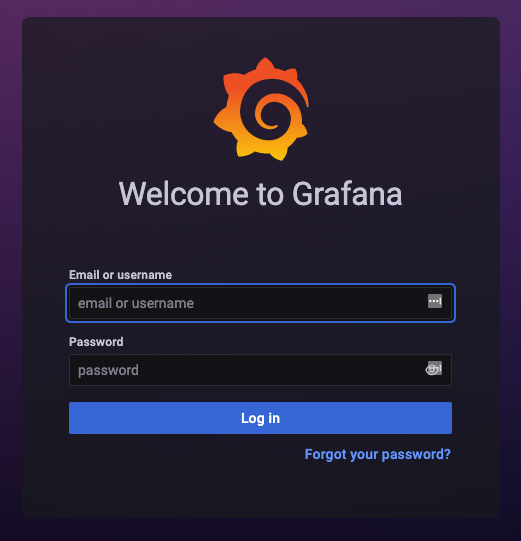
This should have allowed connections to the Grafana dashboard. Go back to the ECS Console, select your task and then containers. Click on Grafana and you should see a link to the IP and port number of your Grafana instance. Click, and if everything went okay, you should be greeted with Grafana’s login screen. At this point, login using the default username and password admin : admin.
Finally, we just need to set up the connection to the Prometheus Server. Select Add a Data Source then add a Prometheus server. We didn’t expose our Prometheus server to the internet, because it has little security by default. So, we need to contact the server using the EC2 instance’s internal IP. We can find this in the ECS console by selecting our instance connected to the ECS cluster, and finding the Private IPv4 address. Add this to Grafana as https://<IP>:9090, and leave all other settings the same. Press Save and Test, and with any luck you will get a connection confirmation.
We can now test out the Prometheus server and ensure it is collecting metrics as expected. Head to the Explore Tab of Grafana. Open the Metrics browser and select any of the ic_node_* metrics. You should be able to see metrics appearing from our cluster.
That’s it! Setting up specialized graphs is beyond the scope of this post, but you can now use Grafana to view metrics scraped from your Instaclustr clusters using Prometheus. Note that the container is ephemeral at the moment, so if you restart the containers or they crash, you will lose any collected metrics or custom Grafana dashboards. It may be worth setting up Docker volumes if you wish to store your data.
Final Words
This project is a great way to get started with Instaclustr’s Prometheus endpoint and monitoring metrics with Prometheus. There are a number of things you could do to make this setup better, including setting up a volume on S3 to hold configurations for Grafana, adding storage for Prometheus, or tuning it to scrape more or less. This example is not designed to be a fully deployable solution, rather a base for your team to build on. Considerations should be made for your specific network and security architecture.
For more information on Instaclustr Monitoring with Prometheus