Introduction to Cassandra Monitoring
Apache Cassandra is a NoSQL database designed to provide scalability, reliability, and availability with linear performance scaling. Cassandra database is designed as a distributed system and aims to handle big data efficiently. Refer to what-is-apache-Cassandra and Cassandra-architecture for more information. Note that knowledge of Cassandra architecture and basic terminology is a prerequisite to understanding Cassandra monitoring.
Cassandra monitoring is an essential area of database operations to ensure the good health of a cluster and optimal performance. Alerting is another crucial area for production systems, and it is complementary to monitoring. Good alerting in Cassandra can be achieved by utilization of the monitoring infrastructure and relevant toolset. Alerting and monitoring help create a robust environment for any Cassandra deployment.
This blog post aims to touch all important aspects of Cassandra monitoring. We hope it provides the reader with crucial information about monitoring tools, components, and metrics.
Monitoring Terminologies
JVM Based Monitoring
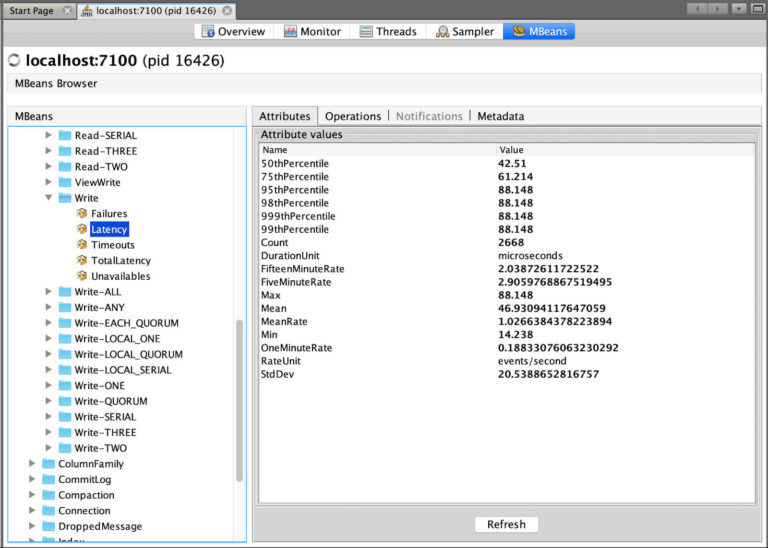
Cassandra is developed in Java and is a JVM based system. Each Cassandra node runs a single Cassandra process. JVM based systems are enabled with JMX (Java Management Extensions) for monitoring and management. Cassandra exposes various metrics using MBeans which can be accessed through JMX. Cassandra monitoring tools are configured to scrape the metrics through JMX and then filter, aggregate, and render the metrics in the desired format. There are a few performance limitations in the JMX monitoring method, which are referred to later.
The metrics management in Cassandra is performed using Dropwizard library. The metrics are collected per node in Cassandra. However, those can be aggregated by the monitoring system.
Metrics
There are a large number of metrics exposed by Cassandra to cover all possible areas including performance, resources, communication, node, and cluster state etc. The metrics are defined with distinct types, and those can be categorized as well for operational ease.
Metrics Types
Cassandra metrics are defined with specific data types. These types are designed to accommodate metrics representations to represent the metrics like latency, counts, and others correctly.
The metrics types are not intuitive and you might need some time to get familiar.
- Gauge: A single value representing a metric at a specific point in time, e.g. value of memory allocated or a number of active tasks.
- Counter: Counters are the same as a gauge but are used for value comparisons. Generally, a counter is only incremented, and it is reset when the functionality gets disrupted like a node restart. An example is cache_hit count.
- Histogram: Histogram is a count of data elements from a data stream grouped in fixed intervals. A histogram gives a statistical distribution of values. The data elements are provided over min, max, mean, median, 75th, 90th, 95th, 98th, 99th, 99.9th percentile value intervals.
- Timer: Timer keeps the rate of execution and histogram of duration for a metric.
- Latency: This is a special type to measure latency. It includes Timer and the latency is in microseconds. There is also a TotalLatency with each latency metric. The total latency is the count of latency since the beginning. The beginning means the start of a node.
- Meter: Meter is a unit to measure throughput. It also includes a weighted moving average for first, fifth, and fifteenth minute.
Metrics Categories
The metrics are categorised based on Cassandra domains, e.g. table, keyspace, storage, communication, JVM etc. Not all metrics should be monitored all the time, but those should be available in case required, i.e. during troubleshooting or application performance testing.
The metrics are further subdivided in terms of broader areas like resources, network, internals, crucial data elements etc. Metrics can be represented as per topology levels like cluster level, node level, table level etc. to organize all the information.
The categorization becomes clear as we go through specific metrics and correlate those with specific Cassandra areas.
Metrics Format
The Cassandra dropwizard metrics are specified in format below:
Dropwizard Metric Name: org.apache.cassandra.metrics.<Metric scope>.<Metric type>.<MetricName>
Mbean: org.apache.cassandra.metrics:type=<Metric type> scope=<Metric scope> name=<MetricName>
Metric Type: This is the category of metrics e.g. table, keyspace, threadpool. Do not confuse this with the data type of metrics.
Metric scope: This is the metric sub type for more granularity wherever required. The scope is hence optional. E.g. the table name or keyspace name.
Metric name: The final metric name like LiveSSTableCount.
Essential Metrics
Cassandra Metrics
Node Status
The status of nodes must be monitored and alerted immediately if a node is down. Cassandra cluster’s availability directly depends on the uptime of all the nodes in the cluster. Although the anti-entropy mechanism in Cassandra helps protect data from inconsistency, there is no replacement for lost performance during a node downtime. A down node puts pressure on other nodes in the data center to handle requests and store hints. Hence, downtime for a node should be minimum.
Cassandra operational activity requires node restart or downtime but those can be scheduled at least busy times for the cluster. This alert helps keep track of any service disruption and the need to run repair a node. A node should be repaired if it is out of the cluster for more than the hinted handoff window which is three hours by default.
Client Request Metrics
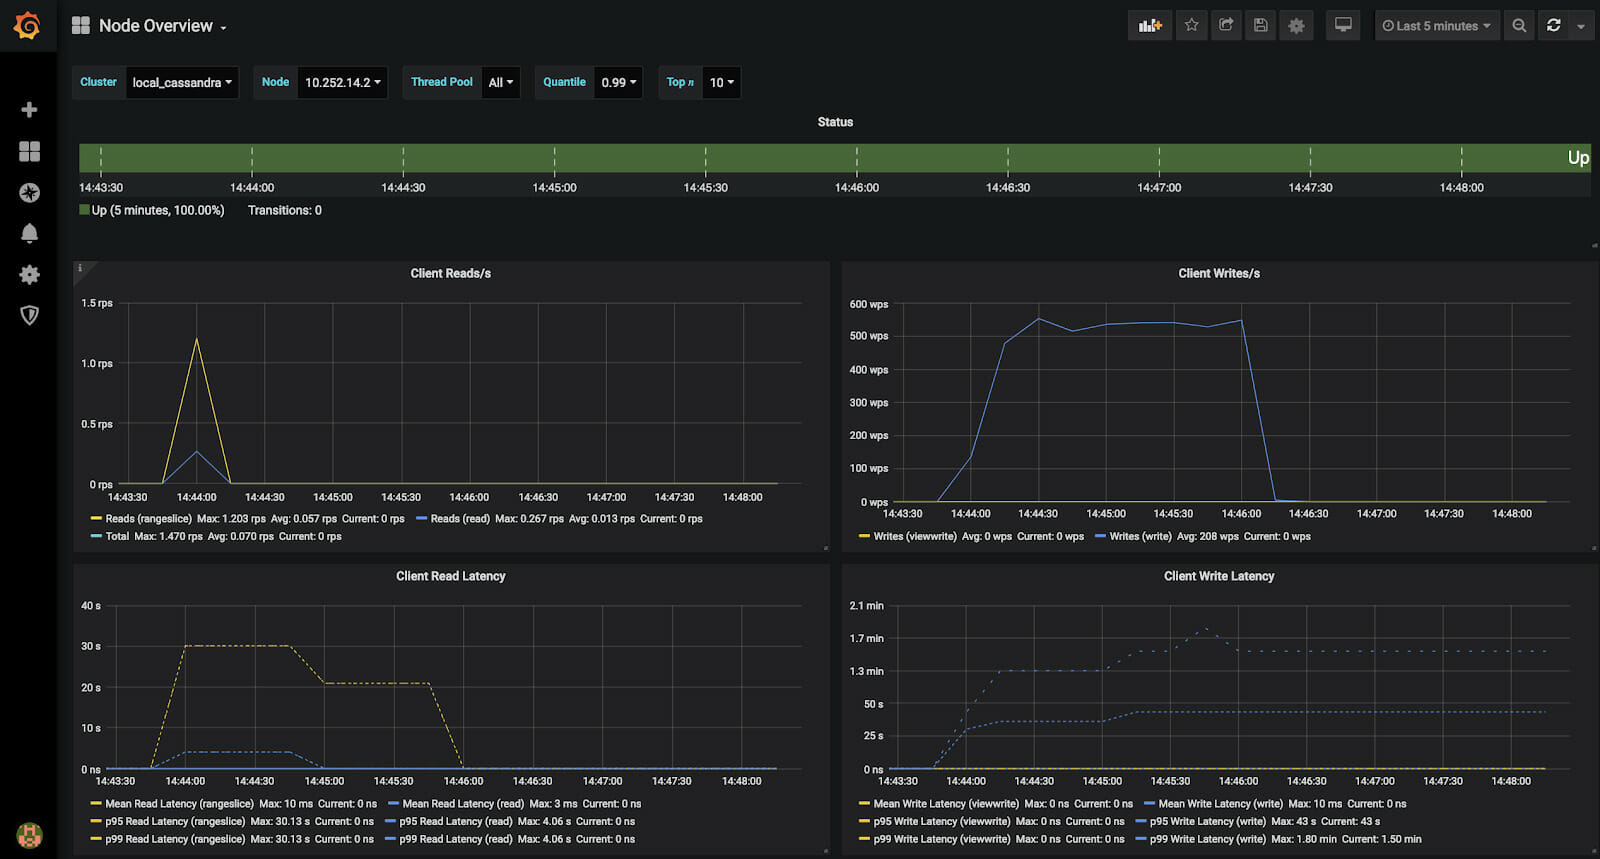
The client requests metrics provide information about client communication in form of read and write requests per second between the client and a coordinator node. Other than normal read and write requests, there are special types of read and write operations CAS, View, and RangeSlice which have their own set of metrics. These metrics help to track the request count, latency, failures, and a few other statistics. The basic statistic to monitor is the number of requests per seconds, i.e. throughput and request latency.
Requests Per Second
The number of requests should be aggregated per data center and per node. There could be some nodes receiving more requests as compared to other nodes. This behaviour creates extra pressure for the nodes receiving more requests. The specific requests like CAS and RangeSlice should be tracked separately for clarity. These operations are resource-intensive and have a unique effect on the nodes. The ratio of read requests to write requests is crucial to understand the type of workload. There are specific configurations to optimize a read-heavy or a write-heavy workload.
Each cluster can handle a certain amount of client requests per second efficiently. If the number of requests exceeds the cluster capacity, it can result in undesirable results like dropped messages, inconsistency, increased latency etc. The CAS and RangeSlice request can cause increased latency.
Uneven load on a few nodes can be handled with optimal load balancing at the driver side. The read and write latency or throughput issues caused by constant overloading should be addressed by adding more nodes to the data center and revisiting the data model if required.
Alerting: Set alerts on the number of requests threshold served per node and data center.
Client Request Latency
Latency tracked by these metrics is the read and write latency experienced by client applications. There are various percentiles of latency, as mentioned in the latency metric type. These metric types should be tracked separately as well as overall values so that there is a clear view of system performance metrics. Production systems generally have latency SLAs. The SLA on a specific or overall latency should be tracked and alerted upon the client latency.
There are various factors which affect latency including, the amount of load served by a node or cluster, system resources and tuning, GC settings and behaviour, type of requests. Troubleshooting latency issues mainly depends on the accurate investigation of the root cause. Correlating latency metrics with other metrics helps to track down root causes. Using a graph solution like Grafana for visualization is the most efficient way to sight and track issues.
Alerting: Set alerts for latency SLA thresholds if any or expected latency range.
Request Timeout and Failure
These metrics are the number of client requests timed out or failed. Failed requests are a clear indication of errors, and those should be addressed immediately. The common causes for request failure are unavailability of data, failure to get a response from the required number of replicas, data inconsistency, and network error. Troubleshooting for error is performed using the error messages and other metrics correlation.
Alerting: Set alerts for more than a few failure requests on production systems.
Compaction Statistics
This group of metrics include the amount of data compacted, the number of active/completed compactions, and other relevant details. Compactions consume node resources and could consume the disk space quickly. Monitoring compactions provides a good insight into the compaction strategy used as each strategy has a unique operational footprint. Specific Cassandra operations like repairs, high volume data writes, add/remove/replace nodes etc. increase the compaction activity. It is important to monitor the compactions while performing such operations.
A common troubleshooting method for high compaction activities and high resource consumption is to throttle the compaction rate. In some scenarios, compactions can be temporarily stopped, but it requires a lot of caution and must be re-enabled at some point to keep the SSTable count low, and read latency optimal.
Alerting: Alerting is not essential for these metrics. However, alerts can be set if there are a higher number of pending compactions sustained for longer than expected time interval.
Garbage Collector Metrics
The Garbage Collector (GC) is yet another crucial area for monitoring. The efficiency of Cassandra’s throughput and performance depends on the effective use of JVM resources and streamlined GC. The GC behavior mainly depends on these factors—the garbage collector used, the workload served by Cassandra nodes, GC parameter settings, the heap size for JVM, etc. A common issue with garbage collection is a long GC pause or the time taken to perform garbage collection.
The GC works well with the default settings by Cassandra, but those can be tuned if required to suit a specific workload and the number of resources. GC parameter tuning is a non-trivial task and requires knowledge of GC internals. However, sometimes the GC can be resolved by fixing the data model, changing the workload, or JVM resources. It is essential to correlate bad GC behaviour with the exact root cause before performing a remedy. Also, any change in parameters impacting GC should be monitored carefully to ensure improvements.
Alerting: Set alert on GC pauses for more than acceptable thresholds on production systems.
Memory Metrics
The memory metrics provide JVM heap, non-heap, and total memory used by Cassandra. The JVM heap storage is used heavily for a variety of purposes by Cassandra. The non-heap memory is also used a lot by later versions of Cassandra. Monitoring the heap and overall memory gives insight into memory usage. It can be used to correlate with any issues and determine memory requirements.
Please note, Cassandra cannot scale with an indefinite amount of memory. This boils down to the fact that JVM and GC cannot perform optimally for large heap size. The most common range of heap size for Cassandra is 8GB-32GB where the smaller size is configured with CMS GC and the larger size with G1GC.
Alerting: Set alerts to test specific memory thresholds and tuning.
Threadpool Metrics
Cassandra works with numerous thread pools internally. This design is aimed to achieve asynchronous tasks, and it also helps to handle back pressure. Monitoring for the thread pools makes it easy to understand the internal system behavior. It also helps to understand specific pools under pressure with active, pending, and blocked tasks.
The solution for constantly saturated pools generally is to provide more processing capacity to the node or the cluster. Other core issues like poor data model and query pattern also impact the thread pools.
Alerting: Set alerts for more than a few blocked tasks on the production system. This helps take preventive action to help avoid performance impact.
Table Metrics
Table metrics are useful in tracking each table independently. These can be used to monitor a specific set of tables which are performance-critical or host a large volume of data. There are various metrics for each table but some of the most important are discussed here:
Partition Size
The partition size is a crucial factor in ensuring optimal performance. Cassandra uses partitions of data as a unit of data storage, retrieval, and replication. Hence, if the partition size is larger it impacts overall performance. The ideal range of partition size is less than 10MB with an upper limit of 100MB. These values are derived from operational experience from the Cassandra community.
The data model and table definition control the partition size. The partition key for a table determines the data to create partitions. A partition key should be designed to accumulate data only up to acceptable size limits. Unfortunately, it is not easy to replace current partitions for a table. But, if the data model is in the design phase, it is crucial to test all the table definitions for potential large partitions sizes. In the existing tables, if large partitions are a major issue, they can be addressed by complete data rewrite. This operation could be long-running, but it can solve many performance issues, and if configured correctly, it can be performed without minimal or no downtime for the table.
Alerting: Configure alerts on large partitions for tables with unbounded partitions. An unbounded partition is where the partition grows in size with new data insertion and does not have an upper bound.
Tombstone Scanned
Tombstones are the deletion markers in Cassandra. Tombstones are produced by data deletion, and it could be performed using various means like delete queries, TTL expiry, null inserts etc. The immutable design of SSTables and compaction operations makes tombstone eviction difficult in some scenarios. Tombstone presence directly impacts read performance; its effect increases with the number of tombstones scanned per operation. This metric provides a histogram of tombstones read for a table’s queries in recent time.
The troubleshooting for tombstone eviction can be performed using various options like revisiting the compaction strategy, major compaction, nodetool garbagecollect etc. Note that all the mentioned remedies for tombstone eviction could operate on a large set of SSTables and are non-trivial operations. The operations must be well tested before executing on production.
Alerting: Set alerts for tombstones-scanned per read metrics for performance-sensitive tables.
SSTable Per Read
These metrics are related to the immutable design of SSTables and read operation. The SSTables are created per table, and the data is arranged sequentially in the order it is written. This results in multiple SSTable reads to complete a single read operation. The number of SSTables read contributes to the time consumed to complete the read operation. Hence, the number of SSTables per read should be minimized.
A good number of SSTables per read is a relative value and depends on the data volume and compaction strategy. However, as a general rule, those should be less than 10. The compaction strategy used for a table plays a crucial role in this metric. A table should be configured with optimum compaction strategy as per the table usage. Repair operation plays a role in keeping the SSTables consistent and hence also indirectly impacts this metric. All the data in Cassandra should ideally be repaired once per gc_grace_seconds cycle.
Alerting: Set alerts for all the read performance-sensitive and high data volume tables for SSTables per read.
Additional Metrics
It is difficult to cover all the metrics present in Cassandra in this blog post, and it is also difficult to predict the most useful ones in general. I have tried to cover the most used metrics individually. But there are still some crucial metrics which are useful for getting insight in specific Cassandra areas. Let’s look at those briefly:
Dropped Messages
Cassandra handles many forms of messages corresponding to various functions. These messages can get dropped mostly due to load or communication error etc. The dropping of messages causes data inconsistency between nodes, and if those are frequent, it can cause performance issues. It is necessary to identify the cause of dropped messages. If those occur frequently or if those are in large numbers, the system resources and data model should be revisited. Alerts should be set for an unexpected occurrence or number of dropped messages.
Caches For Tables
Cassandra uses quite some cache, and those are configurable. The cache metrics are useful to track the effective use of a particular cache. A good example is the use of row cache for frequently accessed rows in a table. If caching hot data in a row cache improves the cache hits, it is a successful use of the row cache.
Data Streaming
Streaming is used while booting up new nodes, repair operations, and during some other cluster operations. Streaming operations can move many data across a cluster and hence consume network bandwidth. The streaming metrics are useful for monitoring node activities and repairs when planned. The streaming rate can be controlled if required to spare the bandwidth for operations.
Hinted Handoff
Hints are a part of the anti-entropy mechanism, and those try to protect nodes from data loss when those are offline. Hints are stored and transferred, so metrics related to these attributes and delivery success, failure, delays, and timeouts are exposed.
The hints metrics are useful to monitor all hints activities. A lot of hints stored and used indicate nodes being offline where hint delays, failures indicate a network or other communication issues.
CQL and Batch
CQL metrics include the number of statements executed of each type. The batch metrics include the number of batch statements executed. These metrics help to monitor the application activity and query semantics used. The use of logged and unlogged batches has its caveats in Cassandra, and they can cause performance penalties if not used correctly.
System Metrics
These metrics are not exported by Cassandra but those are obtained from the OS. These metrics are equally important as the Cassandra metrics to obtain system insights.
Disk Usage
The disk usage is subject to monitoring as Cassandra is optimized to write a lot of data in quick time. The real risk for disk fillup is from compactions. The default compaction strategy used for Cassandra is SizeTieredCompactionStrategy STCS. This strategy merges many SSTables and outputs a single SSTable. The resulting SSTable can have a size equal to the combined size of all the SSTables merged in it. Also, until a compaction operation ends, both old and new SSTables exist on the disk.
The disk space guidelines for a cluster with most tables using STCS is to utilise the disk space up to 50% and to leave the rest as a room for compactions. Generally, disk space is cheaper in cost as compared to other resources and there is no harm to keep vacant space on nodes. However, if there is limited disk space available, disk monitoring becomes even more crucial as free disk left for compactions can be reduced further than general guidelines.
Remedy for high disk usage includes snapshot deletion as those can consume a considerable amount of space. Another method is to stop specific compaction operation; this frees space consumed by the new SSTables. The time until the compaction starts again can be utilized to add more space.
Alerting: Set alerts for various stages of disk usage. The alerts can be categorized for severity based on the amount of free disk space on a node.
CPU Usage
CPU capacity in a Cassandra cluster contributes as the main processing capacity. The number of requests served by a node and the amount of data stored are the factors directly proportional to the CPU utilization. CPU utilization should be monitored to ensure the nodes are not overloaded.
A Cassandra cluster or a single data center should have all the nodes of similar size. Those should have an equal number of CPU cores, and the CPU utilization should also be equivalent. A single node or a few nodes with high CPU is an indication of uneven load or request processing across the nodes. It is observed that Cassandra is not CPU bound in most cases. However, a cluster or data center with high CPU utilization at most times should be considered for node size upgrade.
Alerting: Set alerts for specific levels of CPU utilization on nodes or just for a single threshold. The levels can be defined as per expected CPU load, e.g. 80%, 90%, >95% etc.
Monitoring tools
There are various tools available to set up Cassandra monitoring. I am describing here a few popular open-source tools used widely across the Cassandra community.
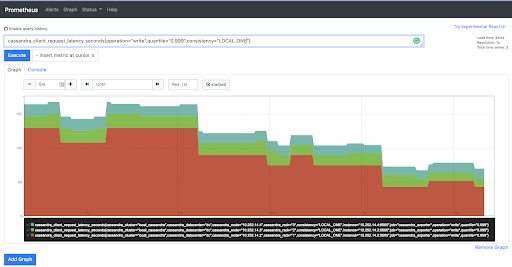
Prometheus
Prometheus is a metrics tool used for handling time-series based monitoring. It has alerting capability as well, which works on the time-series metrics. Prometheus can be configured to collect Cassandra metrics from nodes as well as the system metrics of the nodes. Prometheus uses exporters which are installed on the nodes and export data to Prometheus.
Prometheus runs with a time-series database to store metrics. The metrics are stored in the database and can be queried using promQL, a query language for Prometheus. Prometheus also runs a web UI which can be used to visualise the actual metrics, graphs, alert rules, etc.
Alertmanager is the extension used for configuring alerts. Alertmanager has various integrations available for alerting including email, slack, hipchat, pagerduty etc. Prometheus has evolved over time, and it integrates well with the dropwizard metrics library.
Grafana
Grafana is a visualization tool which can be used to visualize any time-series metrics. Grafana has various panels to showcase the data. The most commonly used panel is a graph. A graph is used to plot incoming data against a time-series in two dimensions.
Grafana integrates with various data sources. These sources are queried in real-time by Grafana to obtain metrics. Each Grafana panel has one or more queries configured to query a data source; the result of the query is rendered on the panel. Grafana uses Prometheus as a well-integrated data source.
Cassandra Exporter
Cassandra exporter is Instaclustr’s open-source solution for collecting Cassandra metrics efficiently. It is designed to integrate with Cassandra JVM and collect and publish metrics. Hence, Cassandra’s exporter is a replacement for the JMX metrics.
JMX metrics in Cassandra have performance limitations and hence can cause some issues if used on systems with a large number of nodes. The Cassandra exporter has been well tested for optimal performance monitoring. The metrics produced by Cassandra exporter are also time-series and can be readily consumed by Prometheus. Please refer to the github page for information regarding configuration and usage.
Conclusion
Cassandra monitoring is essential to get insight into the database internals. Monitoring is a must for production systems to ensure optimal performance, alerting, troubleshooting, and debugging. There are a large number of Cassandra metrics out of which important and relevant metrics can provide a good picture of the system.
Finally, Instaclustr has the Cassandra monitoring expertise and capability with various options.
- Cassandra exporter is an excellent open source tool for optimal monitoring performance on large Cassandra clusters.
- Instaclustr Cassandra managed service uses a comprehensive monitoring-alerting service with 24×7 support and it is a good option to outsource all Cassandra operations and it comes with a free trial.
Instaclustr Cassandra Consulting services can help you with any monitoring or other Cassandra operations.
Related Guides:
- Apache Kafka: Architecture, deployment and ecosystem [2025 guide]
- Understanding Apache Cassandra: Complete 2025 Guide
- Complete guide to PostgreSQL: Features, use cases, and tutorial
Related Products:
Discover how to maximize the availability of Apache Cassandra®