What is Kafka monitoring?
Kafka monitoring involves continuously observing and analyzing the performance and behavior of a Kafka cluster to ensure smooth and optimal operation, especially in production environments. Key metrics include throughput, latency, consumer lag, and broker resource utilization. Monitoring is crucial for identifying and resolving issues promptly, preventing downtime, and maintaining data integrity and security.
Organizations monitor Kafka to:
- Identify performance bottlenecks: Monitoring helps pinpoint slow consumers, overloaded brokers, or other issues impacting performance.
- Ensure data integrity: Tracking consumer lag and other metrics helps ensure data is processed correctly and in a timely manner.
- Prevent downtime: Proactive monitoring allows for the detection and resolution of potential problems before they lead to service disruptions.
- Optimize resource utilization: Monitoring helps identify areas where resources can be better allocated for improved efficiency.
This is part of a series of articles about Apache Kafka
Why is monitoring Kafka important?
Monitoring Kafka is essential for maintaining system stability, performance, and security. It enables teams to detect issues before they escalate and ensures the platform runs efficiently under varying loads.
- Capacity planning: Tracking metrics like storage usage, message throughput, and consumer lag helps forecast future resource needs. With these insights, teams can plan infrastructure growth, scale Kafka clusters appropriately, and avoid disruptions due to resource exhaustion.
- Performance optimization: Monitoring provides visibility into system-level metrics such as CPU load, disk I/O, and network traffic. This data is key to identifying bottlenecks and tuning configurations. For example, analyzing consumer lag allows teams to spot slow consumers and adjust consumer group settings to maintain real-time processing.
- Efficient troubleshooting: Kafka’s distributed nature makes debugging difficult without continuous monitoring. By correlating logs and metrics, teams can pinpoint issues quickly. For instance, simultaneous drops in response rate and increased timeouts in logs may indicate a broker problem, enabling targeted investigation and faster resolution.
- Security and compliance: Monitoring also aids in detecting abnormal activity, such as unauthorized access or unusual data flows. It helps enforce compliance by tracking data access, retention policies, and audit logs, ensuring the Kafka environment meets security and regulatory requirements.
Related content: Read our guide to Kafka management
Key Kafka metrics explained
JMX Monitoring
JMX (Java Management Extensions) is the primary interface Kafka uses to expose metrics from brokers and clients. Kafka brokers use Yammer Metrics for internal metrics, while Java clients use Kafka Metrics, both of which support JMX. These metrics can be visualized with tools like jconsole or exported to external monitoring platforms.
Key metrics:
MessagesInPerSec: Incoming message rate per topic or cluster-wideBytesInPerSec: Bytes received from clients per topic or overallBytesOutPerSec: Bytes sent to clients per topic or overallRequestMetrics.RequestsPerSec: Request rate per request type and versionRequestMetrics.ErrorsPerSec: Error rate per request type and error codeBrokerTopicMetrics.FailedProduceRequestsPerSec: Failed produce request rateBrokerTopicMetrics.FailedFetchRequestsPerSec: Failed fetch request rateRequestQueueSize: Size of the request queueLogFlushRateAndTimeMs: Log flush rate and timeUnderReplicatedPartitions: Number of under-replicated partitionsIsrShrinksPerSec/IsrExpandsPerSec: ISR shrink and expansion ratesrecords-lag-max: Max consumer lag (from client JMX)
Tiered storage monitoring
Tiered storage allows Kafka to offload older log segments to external storage, reducing local disk usage. Monitoring this feature ensures timely data movement and highlights any issues with fetch or copy operations between local and remote tiers.
Key metrics:
RemoteFetchBytesPerSec: Bytes fetched from remote storage per topicRemoteCopyBytesPerSec: Bytes written to remote storage per topicRemoteFetchRequestsPerSec: Read request rate to remote storageRemoteCopyRequestsPerSec: Write request rate to remote storageRemoteCopyLagBytes: Bytes not yet tiered to remote storageRemoteDeleteLagBytes: Tiered bytes pending deletionRemoteLogSizeBytes: Total size of remote logRemoteLogMetadataCount: Count of metadata entries for remote storageRemoteLogReaderTaskQueueSize: Queue size of remote read tasksRemoteLogManagerTasksAvgIdlePercent: Idle time of tiering thread pool
KRaft monitoring
KRaft (Kafka Raft Metadata Mode) replaces ZooKeeper in newer Kafka versions. Monitoring KRaft helps track metadata replication, controller state, quorum health, and election behavior.
Key metrics:
raft-metrics.CurrentState: Role of the node (e.g., leader, follower)raft-metrics.CurrentLeader: ID of the current quorum leaderraft-metrics.HighWatermark: Quorum high watermark offsetraft-metrics.AppendRecordsRate: Record append rateMetadataLoader.CurrentMetadataVersion: Active metadata versionSnapshotEmitter.LatestSnapshotGeneratedBytes: Size of latest metadata snapshotKafkaController.ActiveControllerCount: Number of active controllersKafkaController.FencedBrokerCount: Number of fenced brokersKafkaController.MetadataErrorCount: Count of metadata processing errors
Selector monitoring
Selector metrics help monitor I/O activity in Kafka clients and workers. These include network readiness checks and time spent in I/O operations.
Key metrics:
select-rate: Number of I/O select calls per secondselect-total: Total I/O select callsio-wait-time-ns-avg: Average time waiting for I/O readinessio-wait-ratio: Fraction of time spent waiting for I/Oio-time-ns-avg: Average I/O time per select callio-ratio: Fraction of time spent on actual I/O workconnection-count: Current number of active connections
Common node monitoring
Node-level metrics track client interactions with specific Kafka broker nodes. These metrics offer insight into per-node request volume, data transfer, and latency.
Key metrics:
outgoing-byte-rate: Average outgoing bytes per second for a nodeincoming-byte-rate: Average incoming bytes per second for a noderequest-rate: Request rate per noderequest-size-avg: Average request size per noderequest-latency-avg: Average latency of requests per noderesponse-rate: Response rate per nodeconnection-close-rate: Rate of connection closures
Producer monitoring
Producer monitoring tracks how clients produce data, including buffering behavior, error rates, retries, and request latencies. These metrics help identify issues like buffer exhaustion or high retry volumes.
Key metrics:
record-send-rate: Records sent per secondrecord-error-rate: Error rate of record sendsrecord-retry-rate: Retry rate of record sendsrequests-in-flight: In-flight produce requestsbuffer-available-bytes: Available buffer memorybatch-size-avg: Average batch size in bytesproduce-throttle-time-avg: Average broker throttle time for producersrecord-queue-time-avg: Time records wait in the send buffer
Consumer monitoring
Consumer metrics track how data is fetched and committed by clients. They include polling behavior, fetch rates, consumer lag, and group coordination performance.
Key metrics:
records-consumed-rate: Number of records consumed per secondrecords-lag-max: Maximum lag in recordsfetch-latency-avg: Average latency for fetch requestsfetch-size-avg: Average fetch sizecommit-rate: Rate of offset commitsrebalance-latency-avg: Time taken to rebalanceassigned-partitions: Number of partitions currently assignedheartbeat-rate:Heartbeats per second sent to the group coordinator
Connect monitoring
Kafka Connect exposes metrics for worker-level operations, connectors, and individual tasks. These help monitor task lifecycle, rebalance events, and error handling.
Key metrics:
connector-count: Number of active connectorstask-count: Number of active tasksrebalance-avg-time-ms: Average rebalance timeoffset-commit-avg-time-ms: Average time to commit offsetssink-record-lag-max: Max lag between consumer position and sink processingsink-record-read-rate: Rate of records read from Kafkasource-record-write-rate: Rate of records written to Kafka by source connectorsdeadletterqueue-produce-failures: Failed writes to dead-letter queuetotal-record-errors: Number of record-level processing errors
Learn more in our detailed guide to apache kafka cluster
Tips from the expert

Andrew Mills
Senior Solution Architect
Andrew Mills is an industry leader with extensive experience in open source data solutions and a proven track record in integrating and managing Apache Kafka and other event-driven architectures
In my experience, here are tips that can help you better monitor Apache Kafka:
- Monitor key broker metrics for cluster health: Keep a close eye on broker-level metrics such as CPU usage, disk I/O, and network throughput. Pay special attention to under-replicated partitions and offline partitions, as they indicate potential issues with data replication and availability.
- Track consumer lag for performance insights: Consumer lag is a critical metric that hows the delay between message production and consumption. High lag can indicate slow consumers or bottlenecks in processing. Use Kafaka’s built in tools or a managed service like Instaclustr for monitoring solutions to track consumer group offsets and ensure they are keeping up with the producers.
- Track network-level congestion and TCP retransmissions: Kafka is sensitive to network performance. Monitoring packet drops, retransmissions, and interface queue lengths helps identify issues like overloaded NICs or faulty firewalls that impair broker communication.
- Leverage end-to-end monitoring for data flow visibility: Monitor the entire data pipeline, from producers to brokers to consumers, to identify bottlenecks or failures at any stage. Use tools like Kafka Connect to track the performance of connectors.
Notable Kafka monitoring tools
1. NetApp Instaclustr
![]()
Instaclustr for Apache Kafka includes top-tier monitoring capabilities that simplify managing Kafka clusters, ensuring streaming data pipelines perform at their best with minimal effort.
Instaclustr for Kafka monitoring provides real-time visibility into the health and performance of clusters and proactively identifies potential issues before they escalate. Key metrics, such as throughput, partition distribution, consumer lag, and broker health, are tracked using advanced monitoring tools, providing insights needed to make data-driven decisions with confidence. Instaclustr’s monitoring capabilities make navigating Kafka’s intricate architecture straightforward, reducing downtime and keeping applications running smoothly.
Instaclustr includes automated platform alerts to detailed reporting, every feature is crafted to simplify workflows while maximizing Kafka’s potential. This empowers teams to focus on innovation rather than troubleshooting.
License: Apache-2.0
Repo: https://github.com/instaclustr
GitHub stars: 68
Contributors:
- User friendly dashboard: Provides a ready to use dashboard that displays Kafka metrics from all major components – brokers, producers, consumers, KRaft, Kafka connect and displays general node metrics for cluster health like CPU usage, disk usage, and memory usage on nodes.
- Automated monitoring and alerts: Stay ahead of potential problems with real-time monitoring and automated alerts that help ensure the reliability of your deployments.
- Customized scaling: Easily scale your Kafka clusters to match your business needs, handling increasing workloads effortlessly.
- Comprehensive reporting: Access detailed performance reports to analyze and optimize your Kafka workloads effectively.
- Flexible integrations: Instaclustr’s Monitoring API is designed to allow you to integrate the monitoring information from your Instaclustr managed cluster with the monitoring tool used for the entire application – Prometheus, Data Dog, and more.
- Fully managed service: Instaclustr takes care of the entire Kafka operation, from provisioning to maintenance, ensuring a seamless experience with minimal downtime.

2. Prometheus
![]()
Prometheus is an open source monitoring tool that supports time-series data collection, querying, and alerting. It is well-suited for Kafka monitoring due to its pull-based metrics collection, query language (PromQL), and dimensional data model, which enables granular tracking of Kafka components. Prometheus can collect Kafka metrics using either the JMX exporter or Kafka exporter.
License: Apache-2.0
Repo: https://github.com/prometheus/prometheus
GitHub stars: ~60K
Contributors: ~1K
Key features include:
- Dimensional data model: Time series data is labeled with key-value pairs, allowing flexible metric segmentation (e.g., by topic, broker, or partition).
- PromQL query language: Enables querying and metric transformations for dashboards, anomaly detection, and alerting.
- Kafka exporter and JMX exporter support: Prometheus collects Kafka metrics using exporters that expose data over HTTP for scraping.
- Custom alerting rules: Supports RED (Rate, Errors, Duration) metrics with customizable thresholds and automated alerts.
- Built-in dashboards: Dashboards display key Kafka metrics such as under-replicated partitions, consumer lag, throughput, and partition status.

Source: Prometheus
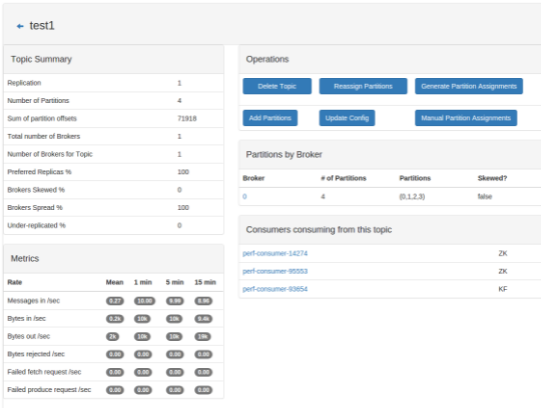
3. CMAK (Cluster Manager for Apache Kafka)
![]()
CMAK (Cluster Manager for Apache Kafka), formerly known as Kafka Manager, is a web-based tool to simplify the administration of Apache Kafka clusters. It enables users to monitor cluster state, manage topics and partitions, run administrative operations like preferred replica election and partition reassignment, and optionally collect metrics via JMX.
License: Apache-2.0
Repo: https://github.com/yahoo/CMAK
GitHub stars: ~12K
Contributors: 50+
Key features include:
- Multi-cluster support: Manage and monitor multiple Kafka clusters from a single interface.
- Topic and partition management: Create, update, and delete topics; add partitions; view replica and partition distribution; and generate partition reassignments.
- Preferred replica election: Trigger preferred replica election to rebalance leadership across brokers.
- Consumer monitoring: View consumer groups, consumed topics, and offset information. Filter out inactive consumers from the UI.
- Partition reassignment: Generate and apply custom partition assignments, including batch operations across multiple topics.

Source: CMAK
4. Burrow
![]()
Burrow is a Kafka monitoring tool developed by LinkedIn that focuses on tracking consumer lag across Kafka clusters. Unlike traditional monitoring tools that rely on static alert thresholds, Burrow evaluates consumer lag dynamically over a sliding window. This enables it to assess the health of consumer groups without generating unnecessary false positives.
License: Apache-2.0
Repo: https://github.com/linkedin/Burrow
GitHub stars: ~4K
Contributors: ~100
Key features include:
- Threshold-free lag evaluation: Uses a sliding time window to assess consumer lag, eliminating the need for manually defined thresholds.
- Multi-cluster support: Monitors consumer activity across multiple Kafka clusters within a single deployment.
- Offset source flexibility: Supports Kafka-committed offsets natively and can be configured to track offsets stored in ZooKeeper or Storm.
- Automatic consumer tracking: Continuously monitors all consumers using committed offsets without requiring manual configuration.
- HTTP API access: Exposes endpoints for querying consumer group status, broker metadata, and lag metrics on demand.
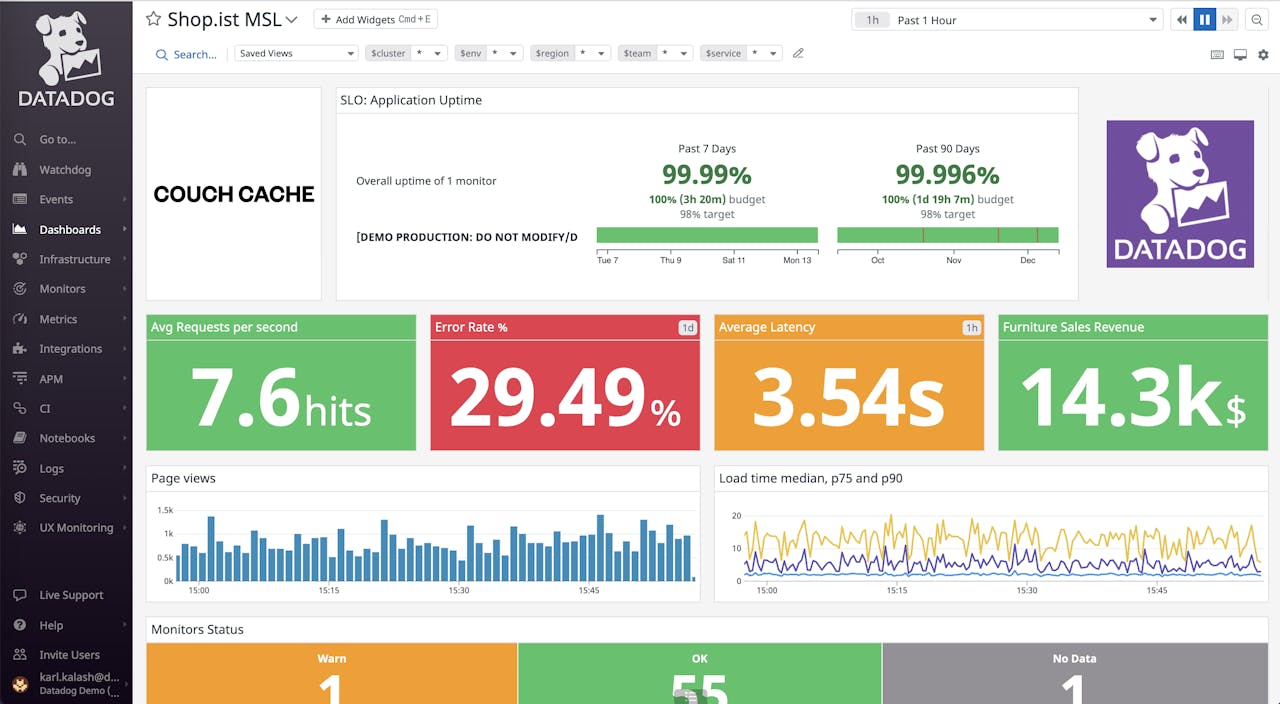
5. Datadog
![]()
Datadog is a cloud-based observability platform that offers monitoring for Kafka deployments through an out-of-the-box Kafka dashboard. It enables tracking of performance metrics across brokers, producers, consumers, ZooKeeper, and JVM components.
License: Commercial
Key features include:
- Prebuilt Kafka dashboard: Provides a ready-to-use Kafka dashboard that displays metrics from all major components—brokers, producers, consumers, ZooKeeper, and JVM—on a single screen.
- Broker metrics tracking: Monitors leader elections, network throughput, request latencies, ISR changes, and offline partitions to ensure cluster stability and responsiveness.
- Producer monitoring: Tracks request/response rates, outgoing bytes, I/O wait times, and average request latency to help identify bottlenecks in data publishing.
- Consumer lag insights: Measures lag by group, messages and bytes consumed, and fetch rate to assess consumption performance and detect slow or stalled consumers.
- JVM-level metrics: Monitors garbage collection events, including ParNew and CMS times, to observe memory management efficiency and diagnose performance degradation.
Source: Datadog
Best practices for effective Kafka monitoring
Here are some monitoring best practices to consider when using Apache Kafka.
1. Define an essential metrics set aligned with SLOs/SLAs
Kafka emits hundreds of metrics, but not all are critical. Begin by identifying a core set that directly maps to business goals and operational commitments. For example, if the SLO guarantees delivery within five seconds, then consumer lag, end-to-end latency, and throughput metrics are essential.
Include indicators of health for key components—such as under-replicated partitions (brokers), error rate (producers), and commit rate (consumers). Use dimensioned metrics (tagged by topic, partition, or client ID) to allow granular filtering. Custom metrics, like event processing latency from consumer applications, can also be added to align monitoring with application-level objectives.
This targeted approach prevents data overload and ensures monitoring efforts remain focused on what matters most to system reliability and customer impact.
2. Set meaningful alert thresholds
Alerts must be both timely and actionable. Set thresholds based on the service behavior under normal and degraded conditions. For instance, trigger an alert only if consumer lag exceeds a predefined threshold for more than 5 minutes, rather than on every spike.
Use dynamic thresholds where possible, such as those based on statistical baselines (e.g., 95th percentile latency) or moving averages. Prioritize alert severity based on business impact: use warnings for early detection and critical alerts when SLAs are at risk.
Group alerts by component to reduce noise. For example, if multiple brokers report errors, consolidate them into a single incident. Regularly review and tune thresholds to prevent alert fatigue and ensure incidents are meaningful.
3. Use historical baselines for anomaly detection and capacity planning
Establish historical baselines by collecting time-series data over weeks or months. This allows admins to define what “normal” looks like for metrics such as throughput, lag, and broker CPU usage. Use this baseline to detect anomalies—like a sudden drop in consumer fetch rate—which might not breach static thresholds but still indicate issues.
For capacity planning, track trends in disk usage, topic growth, and message rates. Analyze peak loads and growth curves to predict when infrastructure will need to scale. This approach supports proactive planning and helps avoid last-minute outages due to resource exhaustion.
Baselines are also useful in evaluating the impact of application deployments or configuration changes, enabling safer rollouts and performance tuning.
4. Implement real-time alerting
Kafka systems often require quick responses to prevent data loss or processing delays. Implement real-time alerting using stream-based metric collectors (e.g., Prometheus scraping JMX exporters). Configure alerts to trigger within seconds of detecting anomalies.
Integrate these alerts with on-call systems like PagerDuty or Slack, ensuring that critical information—such as broker ID, topic name, and exact metric value—is included. Real-time dashboards should support drill-down from high-level alerts to detailed metrics and logs for fast diagnosis.
Run synthetic checks (e.g., produce-consume tests) at regular intervals and alert on failures to detect issues not captured by native Kafka metrics.
5. Automate periodic health checks
In addition to reactive alerting, automate regular health checks that validate Kafka’s operational integrity. These can include:
- Verifying that all partitions have leaders and replicas are in sync
- Checking that consumer groups are committing offsets regularly
- Ensuring no broker is overwhelmed or isolated
- Running produce-consume tests to validate end-to-end message flow
Schedule these checks using cron jobs, monitoring frameworks, or CI/CD tools. Surface the results in dashboards and integrate failures with ticketing systems to enable tracking and resolution.
Automated health checks provide an added layer of defense, catching slow-developing problems before they impact production workflows.
Conclusion
Effective Kafka monitoring is critical for maintaining the performance, reliability, and security of streaming data pipelines. A well-designed monitoring strategy ensures early detection of issues, supports capacity planning, and helps maintain service-level objectives by providing real-time visibility into system behavior. By focusing on key metrics, implementing meaningful alerts, leveraging historical baselines, and automating health checks, organizations can proactively manage Kafka infrastructure and deliver robust, scalable data processing systems.