Monitoring at Scale Series
In this series of blogs, explore the various ways we pushed our metrics pipeline—mainly our Apache Cassandra® cluster named Instametrics—to the limit, and how we went about reducing the load it was experiencing on a daily basis over the course of several years. Beginning in 2015 and up until now, discover how Instaclustr has continued to build and expand its metrics pipeline over the years:
Vol. 1: Monitoring Apache Cassandra® and IT Infrastructure (December 2015)
Vol. 2: Upgrading Instametrics to Apache Cassandra® 3 (November 2016)
Vol. 3: The Introduction of Kafka® (January 2022)
Vol. 4: Using Redis™ as a Cassandra® Cache (March 2022)
Vol. 5: Upgrading our Instametrics Cassandra® Cluster from 3.11.6 to 4.0 (June 2022)
Introduction:
It’s been a while since we released a technical blog series explaining how we do things on our Monitoring Platform at Instaclustr. In fact, the last time we checked in, we were talking about a technical plan to support a platform that was running more than 500 nodes. Now we are quickly approaching over 7000 instances under management.
There have been a number of architectural changes to our internal infrastructure to help us scale to support this use case, many of which involved us “dogfooding” more and more of our own internal services. This is the first blog in a series that will outline how we in the Instaclustr Development team leverage our own Instaclustr Managed Service Platform to help us achieve optimal Big Data outcomes.
Existing Infrastructure
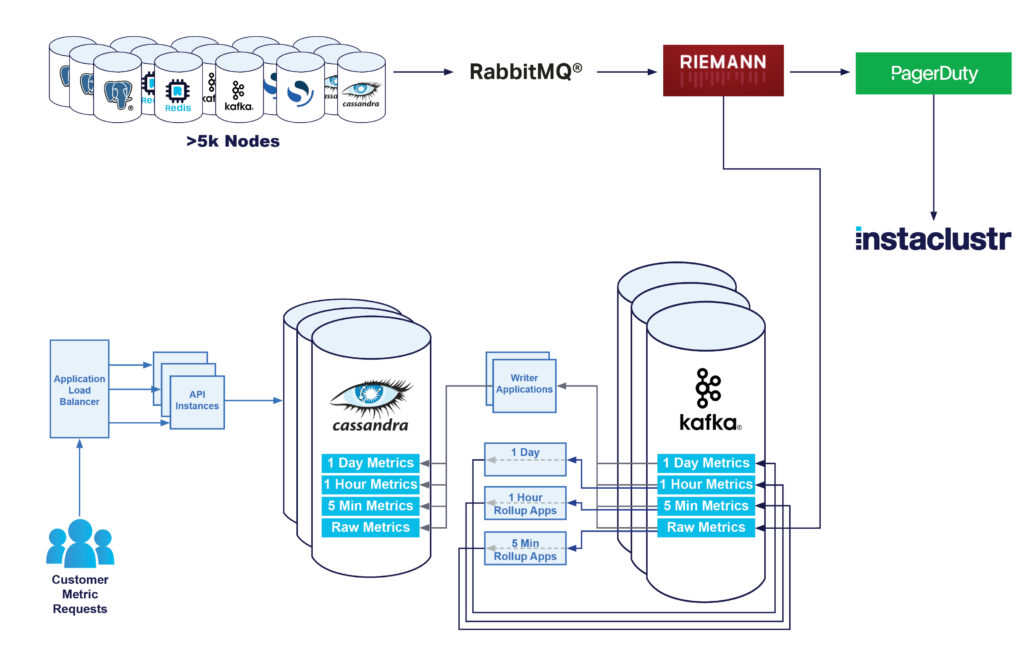
Originally, our monitoring infrastructure had the following architecture:
- Nodes sent all metrics to a RabbitMQ® Exchange
- We used a number of Riemann applications to perform analysis of metrics, and alert our Technical support staff of any issues
- These raw metrics were also written to our Instametrics Cassandra cluster
- We then “rolled up” these raw metrics into a 5 minute, hourly, and daily minimum, average, and maximum value
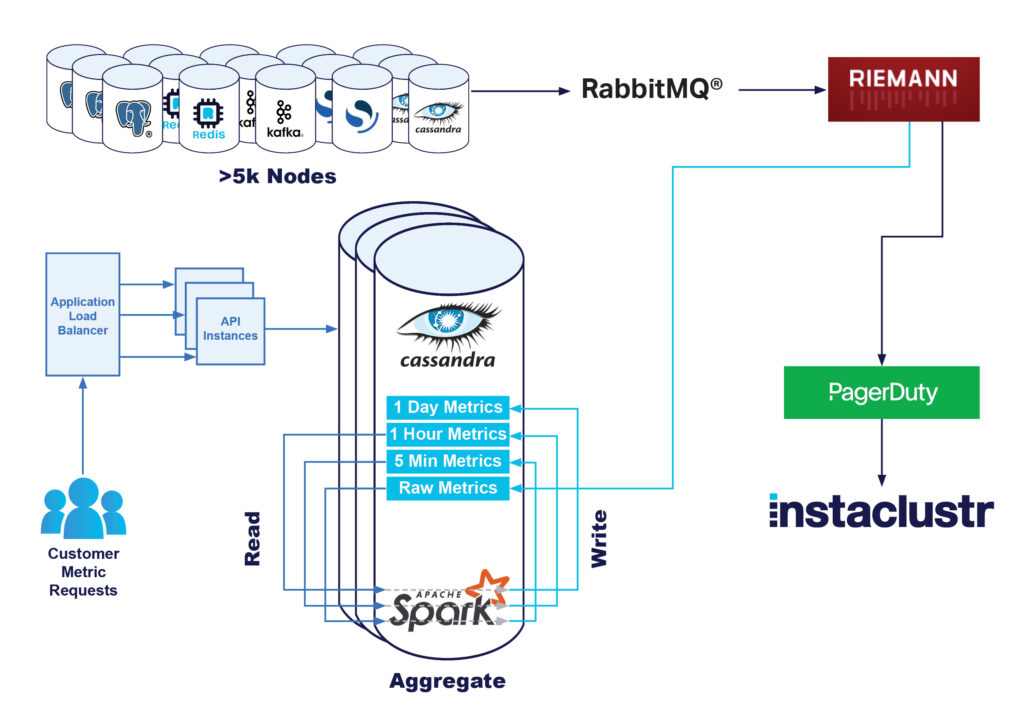
When customers requested metrics from either the console or the API, these metrics would be retrieved from our Apache Cassandra® cluster and returned to the customer. Overall, this solution worked, and scaled, extremely well with minimal technical effort.
More and more instances meant that we did have to increase the size of our Cassandra cluster quite significantly—at one stage increasing to a 90 node i3.2xlarge Cassandra cluster, and 15 Riemann instances, to support around 7000 instances—which serviced roughly a million metric write operations a second.
However, we were aware of a number of inefficiencies in this existing technical implementation, and over the past 3 years have made an effort to try and improve our metrics pipeline, with the aim to improve customer experience when viewing metrics and reduce our infrastructure costs.
The first issue was the large amount of strain that our Apache Spark™ rollup jobs were placing on our Cassandra Cluster. Cassandra is extremely efficient at performing a large number of writes, so a million writes per second were not placing a large strain on the cluster. However, what was placing an unnecessary load, was the Spark aggregation jobs. These jobs would read every raw metric written to the cluster every 5 minutes, and perform a basic aggregation on it. Then every hour we would read all the 5-minute aggregations, performing aggregations to keep hourly values. Finally every day we would read all the hourly aggregations, and keep a daily aggregation.
A little bit confused? I’ll summarize by saying we basically effectively read each raw metric 3 times. On a write-optimized system like Cassandra, this was becoming a large performance bottleneck. It also means that customers that were using our dashboard or metrics API at times when we were performing these aggregation operations would see an increase in their request latency, and sometimes even 429 errors due to request timeouts, as Cassandra was being overloaded with read requests.
In the short term, our easiest solution was to continue to add capacity to the cluster, and we did experience quite linear performance increases as the number of nodes under management and raw metrics being written increased. But we knew that long term, we would likely need to make some larger architectural changes.
Besides the read inefficiency, we also wanted to make some longer-term improvements to the platform. We wanted to focus on the flexibility and extensibility of our monitoring platform —ideally, something which would enable us to add additional tools, reprocess metrics in case of any failures, perform blue/green testing on live data, and maintain a buffer of metrics should any application fail.
Dogfooding Apache Kafka
As you can probably guess, we turned to Kafka to provide all of the benefits we were looking for, introducing Kafka as a message queue in between our Riemann Servers, and our Cassandra cluster. Our Kafka cluster would now be storing all raw metrics from all nodes in the fleet. This would allow us all the benefits of a highly distributed, fault tolerant messaging platform, and also gives us the ability to attach multiple consumers to the same metrics. One of those consumers would be a Kafka application to replace the Spark jobs in performing the rollups on the metrics and reducing the read load on the Cassandra cluster.
In terms of provisioning the cluster, we use Terraform internally in order to provision our management infrastructure, so we utilized the Instaclustr Terraform provider to provision the cluster, and configure it in order to be set up correctly ready for use by our applications. In fact, all of the tooling, and expertise offered to our Development team are available to any of our Managed Service Kafka customers.
The first step in our journey was having our Riemann applications perform writes to both the Cassandra cluster, and a Kafka cluster. We saw this as a very good way to evaluate any issues in the Kafka writing system, while minimizing any impact to customers. By having it configurable per application, we were also able to configure a portion of our Riemann applications to send metrics to Kafka, effectively being able to slowly increase the load on our Kafka cluster, to make sure it was able to cope with the performance requirements.
Writing raw metrics was fairly straightforward, however, it did require tuning the producer config a little, mainly increasing batching settings like linger and batch size. Once we were able to make these changes, we were observing that our single Riemann application was handling production load quite happily, with no increased latency.
Now that we could send raw metrics to our Kafka cluster we looked into sizing the cluster to handle the production load. As we started directing more and more traffic to the cluster we reached out to our Kafka Support team, who evaluated core performance metrics like CPU utilization, iowait, and disk usage. With their help we ended up shortening our retention period, enabling compression, and modifying replication strategy in accordance with our data importance.
For the node sizing, we ended up picking i3en.xl as those provide plenty of high-performance storage, and enable us to take advantage of reserved instance pricing. We have 12 Kafka nodes, and 3 dedicated Apache ZooKeeper™ instances for our production environment. Experimenting with different node sizes was made easy by customer-initiated resize features and our responsive support team.
Once we were satisfied that the Kafka cluster and producers were configured appropriately, and not slowing down our alerting pipeline, we turned on the writing on all of our Riemann servers.
As you will read about in a subsequent blog, by using Kafka and its multiple consumer group topology, it was at this stage our RedisTM team was able to begin work on metrics caching to our monitoring API.
Addition of a Cassandra Writer
The next step was to write a small application that reads from the raw metrics Kafka Topic and writes these straight to Cassandra.
Moving this to its own application gives us slightly increased complexity, but additional benefits, as now metrics writing is asynchronous to the metrics processing and means any failures can be re-worked separately to our much more time-sensitive alerting system. If required, we can throttle our writing workload to not overload our systems, and it also means that using Kafka consumer groups, we can have scalability and high availability on our writer applications.
Our initial hope was to use an off-the-shelf Kafka connect connector for writing to Cassandra, but we couldn’t find anything that supported batch writes, or write optimizations in the same way our existing writer did. One of our founders had presented a Cassandra Summit talk in 2016 around these optimizations. So, instead, we created a very basic java implementation to read from Kafka and write to Cassandra using our existing database model-specific optimizations.
Once we were satisfied with the performance of our writer application, we disabled writing directly from Riemann to Cassandra, relying on our Kafka based Cassandra writer.
At this stage, our architecture was as follows:
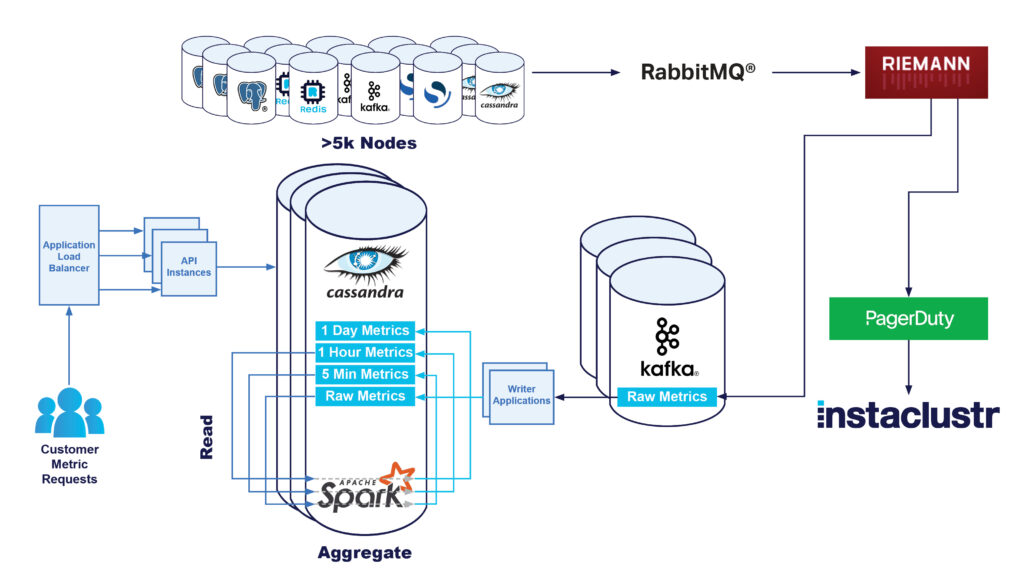
Kafka Based Rollups
The next step was to use Kafka to re-architect our metric rollup system. By having the metrics partitioned in Kafka correctly, we were able to build more small Kafka streams applications which perform all the aggregations, without performing any reads on Cassandra.
These applications would be aggregating metrics, keeping the averages, minimums, and maximums of every 5 min, 1 hr, and 1 day. We initially picked the Kafka streams framework as it seemed designed for this kind of workload. Getting an application up and running in our test environment was easy enough, the real challenge turned out to be to scale the application to handle production load.
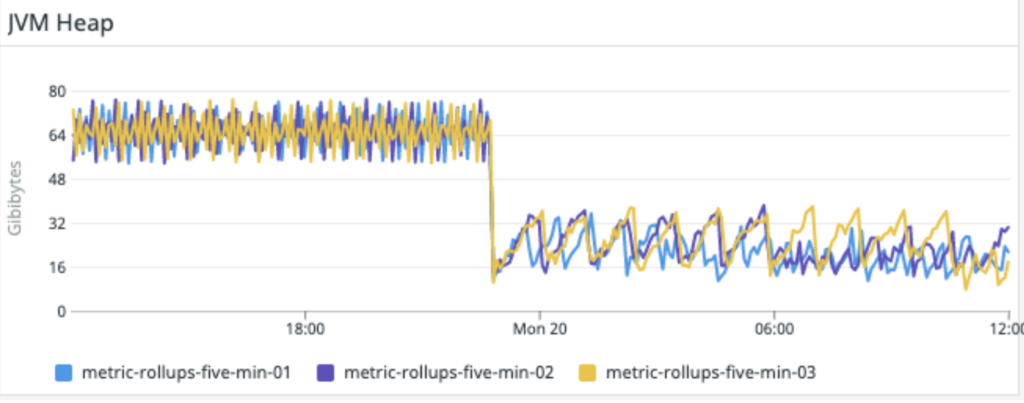
As we directed more and more load to the streams application it started disconnecting from the broker and got into a reconnect-restore-disconnect loop. No amount of tweaking of consumer parameters seemed to make any difference. After a bit of profiling and experimentation, it turned out that the application was running out of memory, and as GC pressure got higher the consumers would miss the heartbeat, get dropped from the broker, dump its state, thus freeing the memory, reconnect, and repeat the cycle.
We had initially hoped that these would be extremely light on resource requirements, however, we had to use several R5.4xl with 128GB RAM each for the aggregation application to run at all under our production load. We were able to perform some more tweaking of rocks db parameters in order to prevent unbound off-heap memory usage, and finally, the application was running stable.
As we wanted to switch Spark jobs off to reduce the load on the Cassandra cluster sooner rather than later, we deployed this version of the application to production, with the plan to revisit and optimize it later, in order to be able to run on smaller instances.
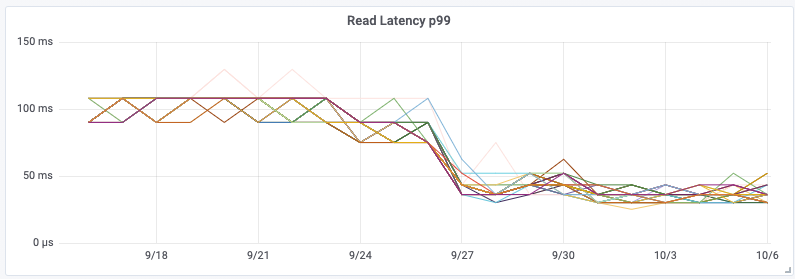
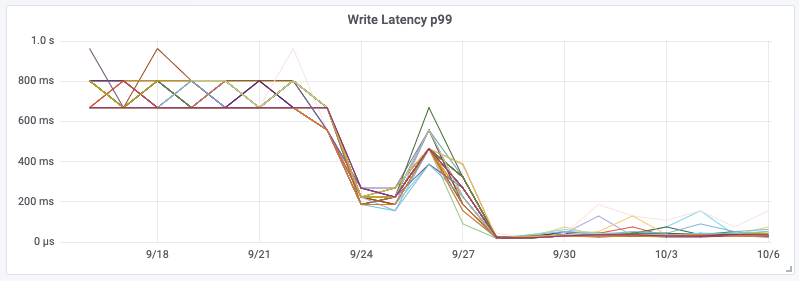
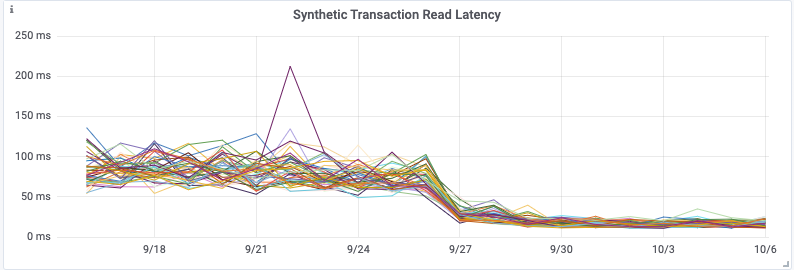
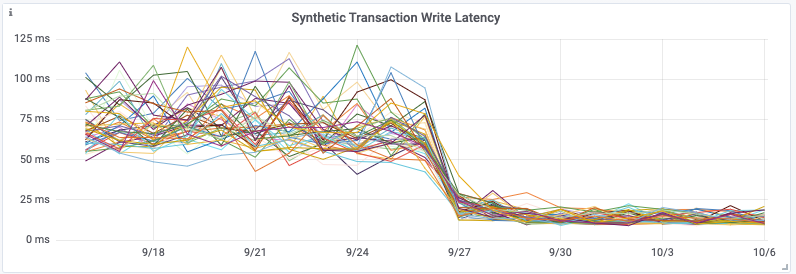
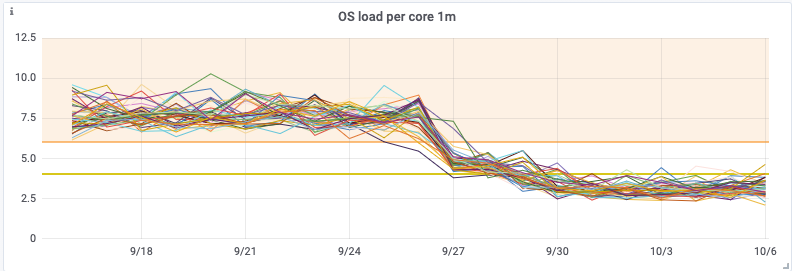
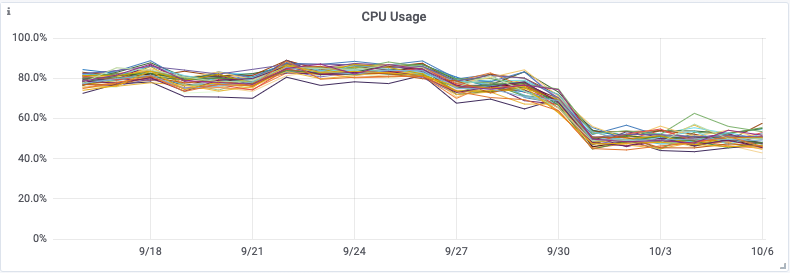
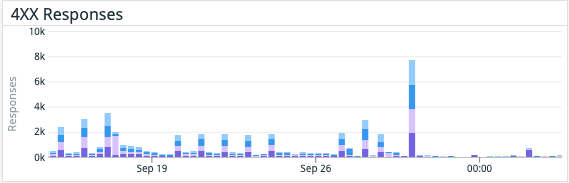
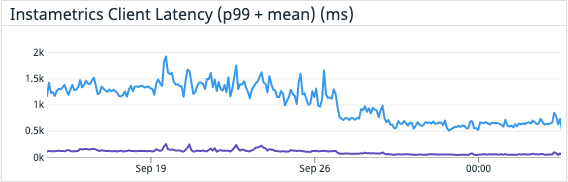
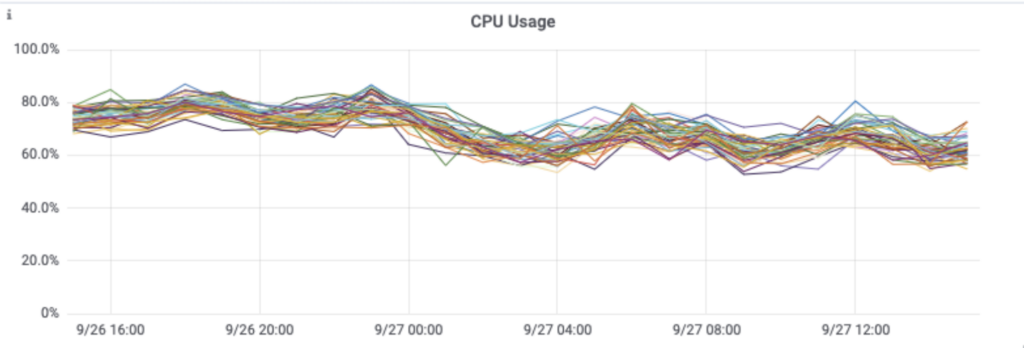
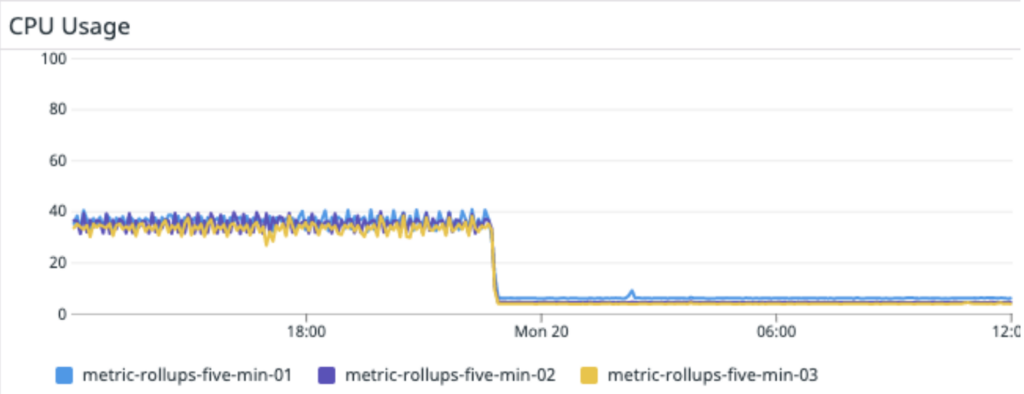
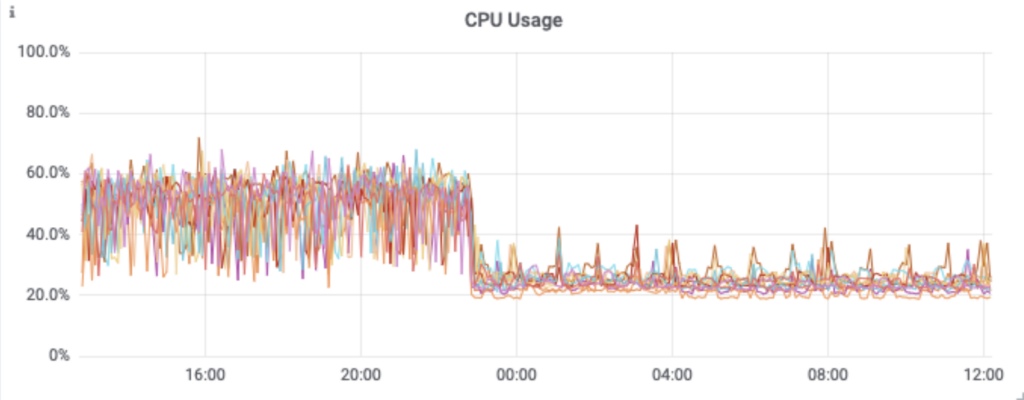
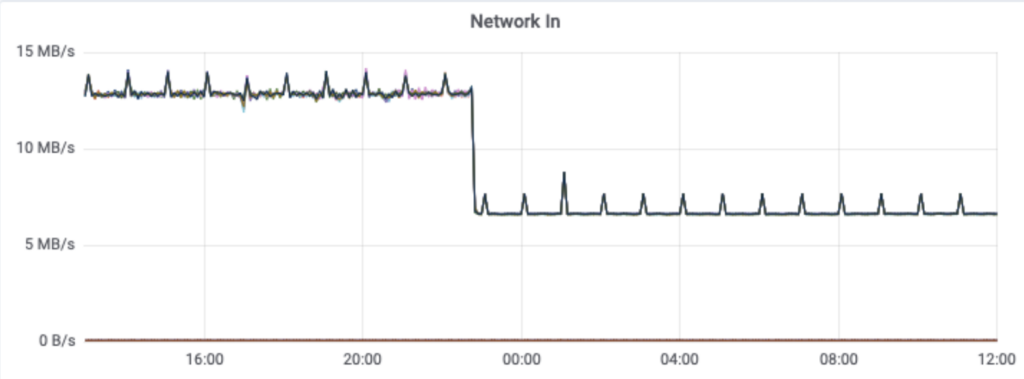
Although having the addition of dedicated aggregation instances, and the Kafka cluster itself does add complexity, it meant that we were able to remove a large computational load on the Cassandra cluster. By performing this change, we saw a 30% drop in Cassandra CPU usage, and our Cassandra Synthetic transaction latency dropped to ⅓rd of its original value—a halving of our Cassandra p99 latency. But much more importantly we saw a reduction in customer API latencies and a significant reduction in the number of 429’s being returned to customers. The change was deployed on 28 September.
By utilizing Kafka consumer groups, we maintain the ability to scale up our aggregation application, or our writer application, independently to all other services. It also means any delays in the writing pipeline will not slow down our issue notification and resolution pipeline!
Cassandra Writers Revisited
Having the rollup application running revealed an issue with our Cassandra writer implementation. It could not handle the bursty nature of the rollup application output and we started seeing Cassandra write timeouts. We decided to add output rate limiting to the writer application in order to achieve a more constant write load.
As we were implementing this change within the writer app we also decided to experiment with batch writes. Our original implementation was using tokenaware batches. Normally multi-partition batches are very costly in Cassandra—if you mix partitions belonging to every node then ALL nodes need to coordinate to process that batch. This gets worse as the cluster gets bigger.
We got around this by batching partitions that belong to a single set of replicas (vnode) so that the whole batch can be handled by just the coordinator and its replica. While most general case Cassandra advice will state that this isn’t necessary, for our use case it continues to be extremely beneficial on both client and cluster CPU usage.
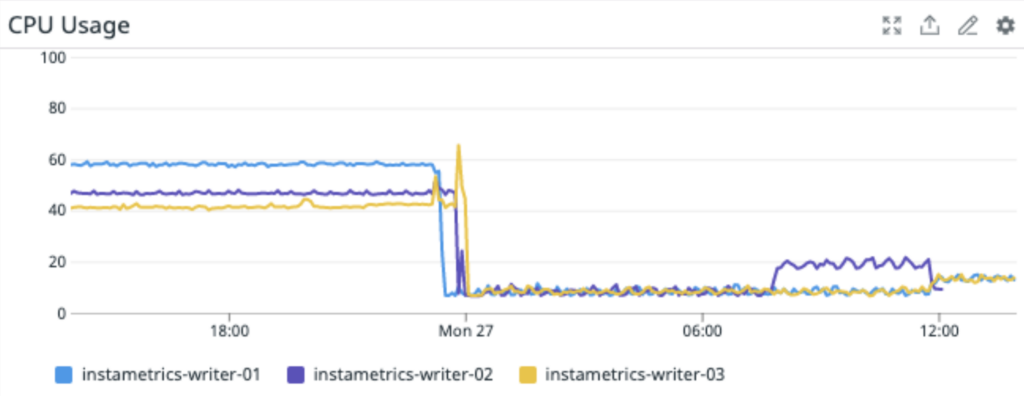
Batching also made an appreciable impact on the Cassandra cluster load,
In the end, we were able to run our production infrastructure off 3 m5.2xlarge Cassandra writer instances.
Here is a bare bones micro-batching code example using Cassandra Java driver 4, if you’re interested in trying it out yourself:
|
1 2 3 4 5 6 7 8 9 10 11 12 13 14 15 |
public void accept(final BoundStatement bound) { final TokenMap tokenMap = session.getMetadata().getTokenMap().get(); final Set<Node> replicas = tokenMap.getReplicas(bound.getRoutingKeyspace(), bound.getRoutingKey()); final List<BatchableStatement<?>> statements = batches.computeIfAbsent(replicas, t -> new ArrayList<>()); statements.add(bound); if (statements.size() >= batchSize) { final BatchStatement batch = BatchStatement.builder(BatchType.UNLOGGED) .addStatements(statements) .build(); session.executeAsync(batch); batch.clear(); } } |
Rollups Revisited
With everything up and running it was time to revisit the rollup application to see if anything could be done about the scalability, instance size requirements, and a few other concerns.
After a bit of experimenting, we ended up implementing the functionality as a pure Kafka consumer, without using the Kafka streams framework. Combining several streams stages into one gave us the opportunity to reduce the memory footprint significantly. Additionally, rather than committing the intermediate state to a Kafka topic as the streams framework does automatically, we decided to replay the data from the source topic in case of application restart.
This decision was a trade-off, but one we were happy to make in these circumstances. We only expected that restarts would happen rarely, and this allows us to reduce the required work of saving the intermediate state during normal operation. However, it does mean that in the case of application failure, we will need to replay more events in order to get back up to speed.
This reduced the load not only on the application instances,
but also on the Kafka cluster itself.
Next Steps and Wrapping Up
Originally, we had set out to reduce the load on our internal Cassandra Cluster. Our main goal was to improve workflow efficiency, whilst also improving our flexibility, and extensibility.
As you have seen, we were able to reduce a significant amount of load on our internal Cassandra cluster. This also had flow-on effects of reduced latency and error rates for customers who were querying their metrics through our API.
Under most use cases, this would put us in the position to immediately begin downsizing our cluster in order to make significant cost savings. However, we made the decision to not immediately downsize the cluster, as we had additional metrics application work planned for release very shortly, and wanted to maintain significant overhead in case of any issues.
These additional works, which you will hear about in upcoming blogs, will also outline exactly how useful Kafka has already been in the flexibility and extensibility of our entire metrics pipeline. You can already see how it has enabled us to remove the Spark workload from our metrics pipeline.
Stay tuned for updates on how we utilized Redis in order to achieve significant improvements in our monitoring API for customer request latency, as well as significant further performance improvements to our Cassandra Cluster.
RabbitMQ® is a trademark of VMware, Inc. in the U.S. and other countries.