Monitoring at Scale Series
In this series of blogs, explore the various ways we pushed our metrics pipeline—mainly our Apache Cassandra® cluster named Instametrics—to the limit, and how we went about reducing the load it was experiencing on a daily basis over the course of several years. Beginning in 2015 and up until now, discover how Instaclustr has continued to build and expand its metrics pipeline over the years:
Vol. 1: Monitoring Apache Cassandra® and IT Infrastructure (December 2015)
Vol. 2: Upgrading Instametrics to Apache Cassandra® 3 (November 2016)
Vol. 3: The Introduction of Kafka® (January 2022)
Vol. 4: Using Redis™ as a Cassandra® Cache (March 2022)
Vol. 5: Upgrading our Instametrics Cassandra® Cluster from 3.11.6 to 4.0 (June 2022)
The Problem Space
Instaclustr hosts hundreds of clusters, running thousands of nodes, each of which is reporting metrics every 20 seconds. From operating system level metrics like cpu, disk and memory usage, to application specific metrics like Cassandra read latency or Kafka® consumer lag.
Instaclustr makes these metrics available on our metrics api for customers to query. As we continue to grow and add more customers and products, the underlying infrastructure to make these metrics available needs to scale to support the expanding number of nodes and metrics.
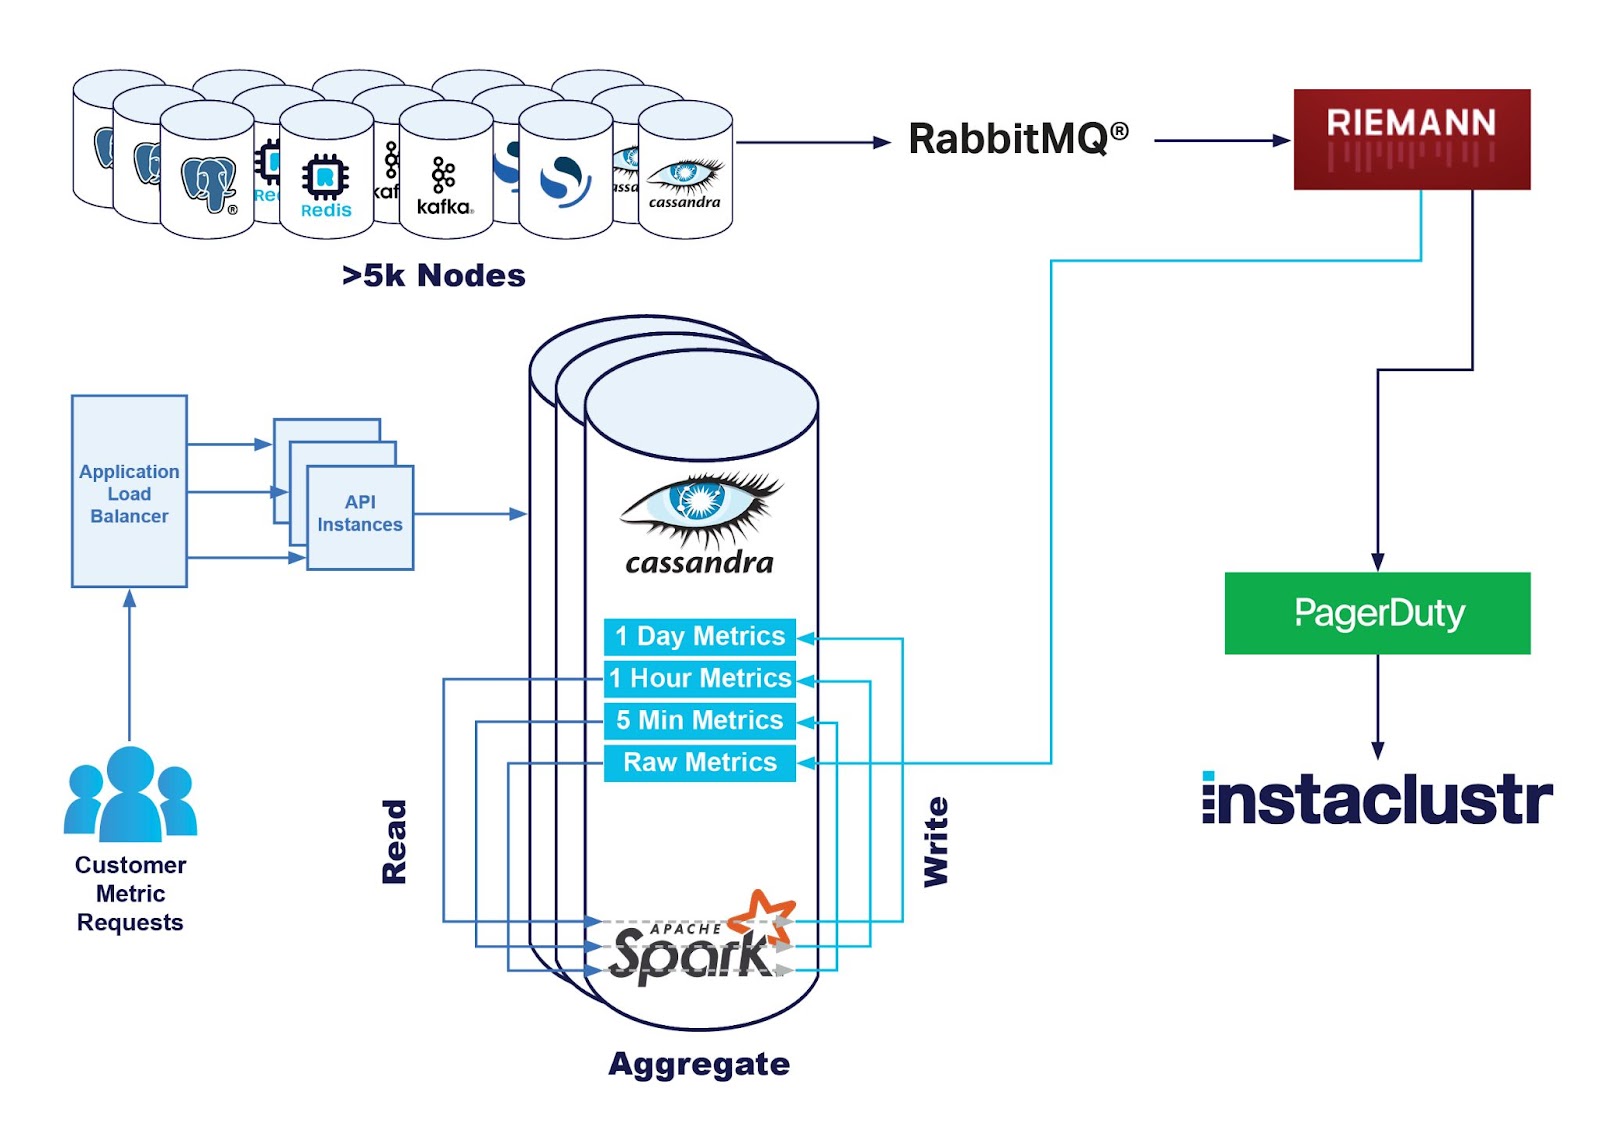
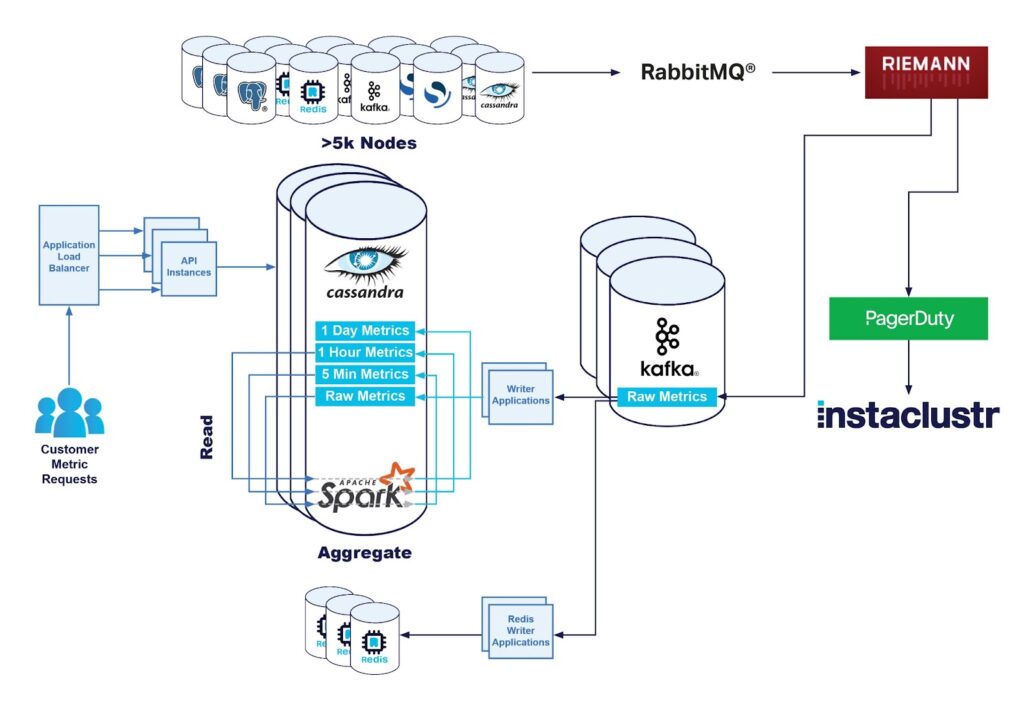
Our Monitoring Pipeline
We collect metrics on each node with our monitoring application which is deployed on the node. This application is responsible for periodically gathering various metrics and converting them to a standard format, ready to be shipped.
We then ship the metrics off to our central monitoring infrastructure where it is processed by our fleet of monitoring servers where various operations are performed such as:
- Calculating new metrics when necessary; in turn running counters into differential metrics, mapping various cloud service file system paths into common paths and the like.
- Processing the metrics, applying rules, and generating reports or alerts for our technical operations team to respond to.
- Storing the metrics, the primary data store is our Apache Cassandra cluster named Instametrics—itself running as a managed cluster on our platform, supported by our Technical Operations staff just like all of our clusters.
In a previous blog our Platform team had introduced how we had improved our metrics aggregation pipeline, to take a large amount of strain off our Instametrics Cassandra cluster. They had achieved this by introducing a Kafka streaming pipeline.
Taking a Load off the API
As we continued to scale out to new product offerings, adding more customers and more nodes, we started looking at where our monitoring pipeline needed further improvement.
One of the major concerns was our Monitoring REST API, which had continued to see response latency grow as we gained more customers who were eager to consume the metrics as quickly as we could produce them. Metrics are published every 20 seconds, and some customers like to ingest them as quickly as they are available.
As part of the effort to reduce the latencies and errors being reported to customers, we did some investigation into what was causing the issues. After shoring up the capacity of the API servers themselves, we did some analysis and came to the conclusion that Cassandra is a relatively expensive way (in terms of $ and CPU load) to serve the ready-heavy workload we had for fresh metrics. If we wanted to continue servicing all the requests from our Instametrics cluster with the desired latency, it would need to be scaled further to appropriately handle the load. We had to service requests that were coming from multiple dimensions, significant write load from storing the metrics, significant load from the original Spark based metrics rollup calculations, and finally read load from the API requests.
Our Platform team had already started the work on the reduction of the metric aggregation calculations, but we also wanted to make an effort to further reduce the read load on our Cassasndra cluster. We ideally wanted something that would continue to scale as we added clusters and products, that would return an even better user experience, and reduce the strain on our Cassandra cluster.
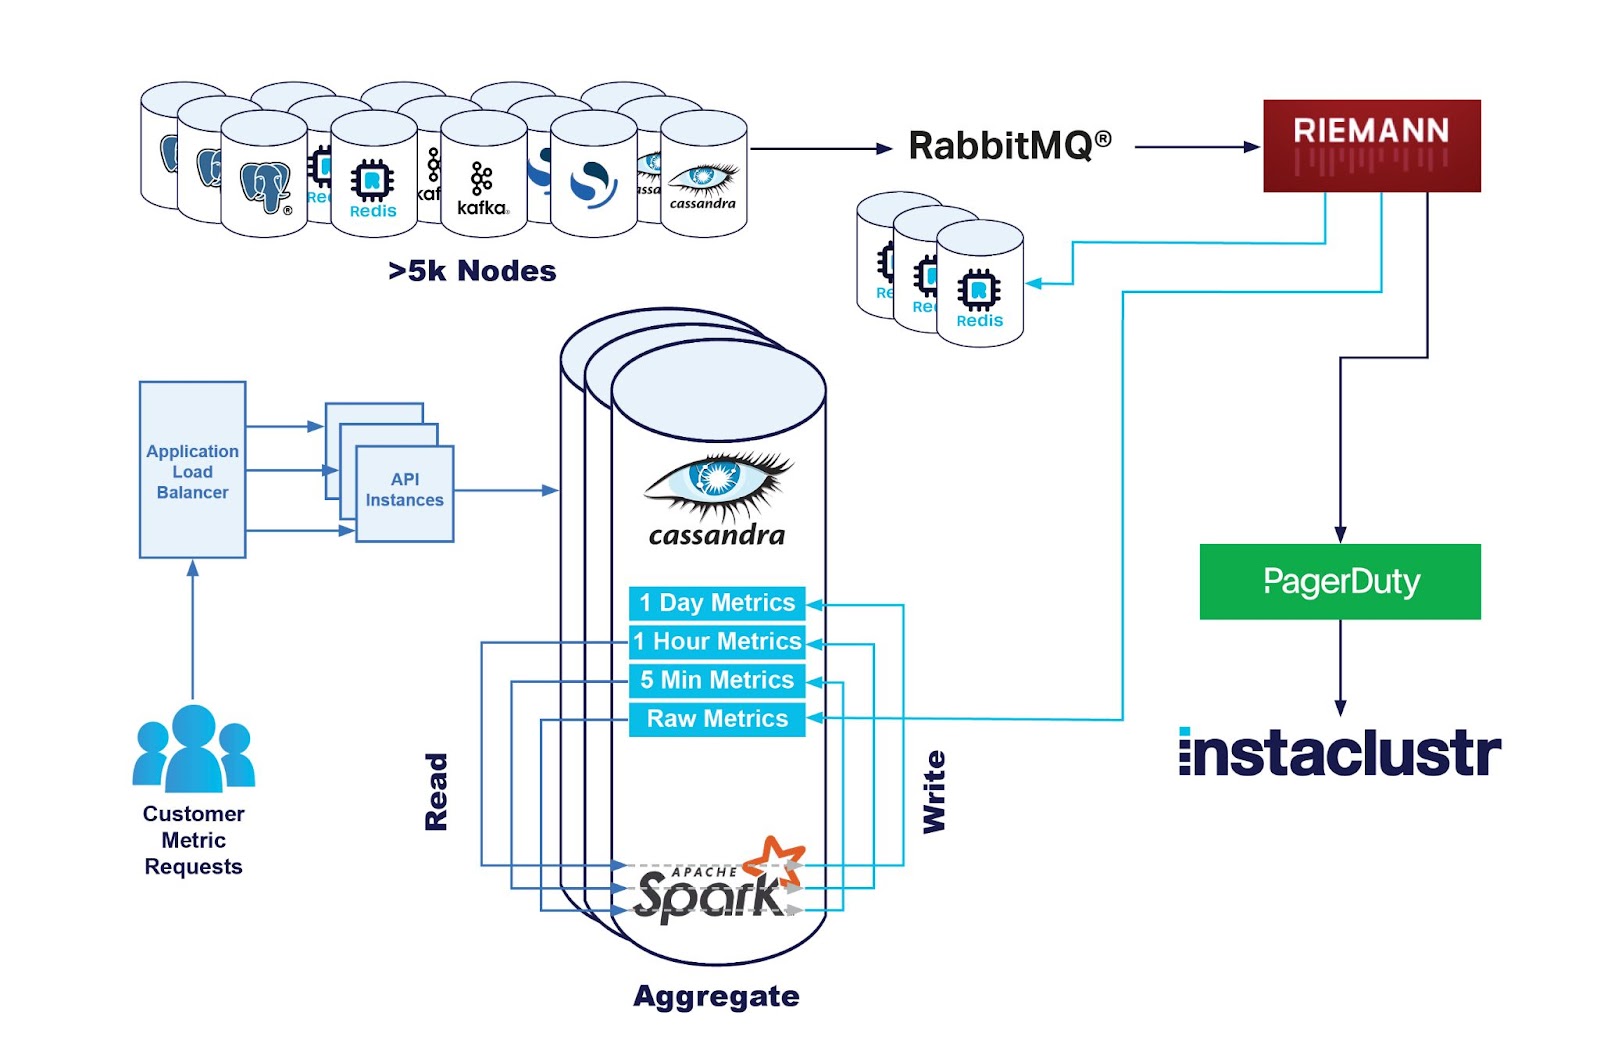
Enter Redis
For solving the read load, Redis was an easy decision to make. Our Instaclustr for Redis offering was created to help companies solve these exact types of problems. We created a plan using our Terraform provider and created a Redis cluster, configured and networked to our core applications, and it was all ready to serve metrics requests.
The challenge then became how to get the metrics there.
Getting the Data Model Correct
We had always anticipated that the data stored in Redis was always going to be slightly different than those stored in Instametrics.
Our Cassandra cluster stores all raw metrics for 2 weeks, but storing that amount of data in Redis would have been cost prohibitive. This is because while Cassandra stores this information on disk, Redis stores it in memory. This means significantly faster query times, but much more expensive to store.
However, while it’s possible for customers to ask for a metric from 2 hours or 2 days ago, we know that the majority of API load comes from customers who are constantly querying for the latest metric available, which they often feed into their own monitoring pipelines. So we really only need to have the latest minute or so of data in Redis to serve the vast majority of API requests.
We also know that not every single customer uses the monitoring API—lots of our customers simply view metrics on our console as needed. For those that do like to store them themselves, they may not be using it 24×7, but rather only storing it in certain situations. We can save on data transfer costs, cpu, and memory overhead if we only cache metrics for clusters that will be reading them from the API.
Taking into account that the majority of our API requests are for the most recent metrics, we apply a 15 minute Time To Live (TTL) on all the Redis records, and only cache metrics for customers who have been actively using the monitoring API within the last hour.
The First Attempt
The simplest solution, with minimal required changes to our existing stack, was to introduce dual writes in the monitoring pipeline. In addition to writing raw metrics into our Cassandra cluster, we would additionally write them into our Redis cluster.
This wasn’t entirely risk free, the monitoring servers have a constant large load which was delicately balanced. If the pipeline wasn’t cleared fast enough, it would create a type of negative feedback loop that would fail quickly.
But this pipeline is pretty well instrumented, and we can see when requests are backing up before it becomes a huge problem.
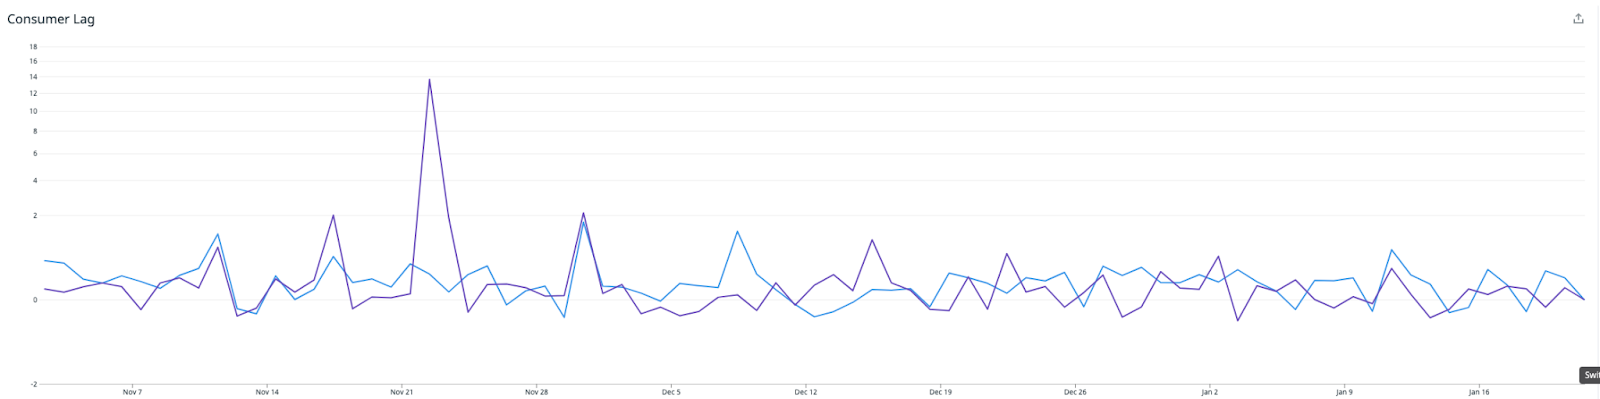
So we wrote a Redis metrics shipper and wired it into our processing engine behind a feature flag and turned it on a small subset of the monitoring servers and observed.
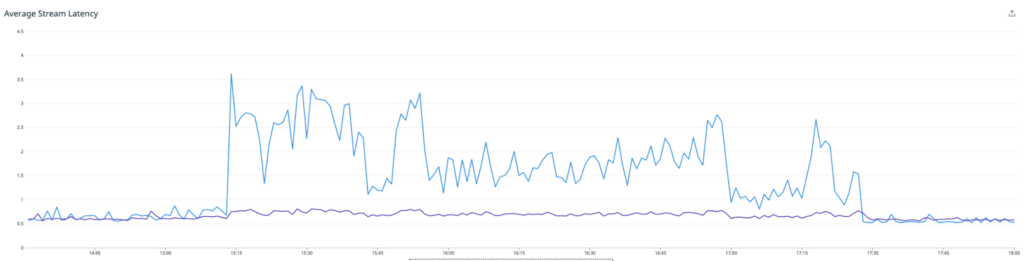
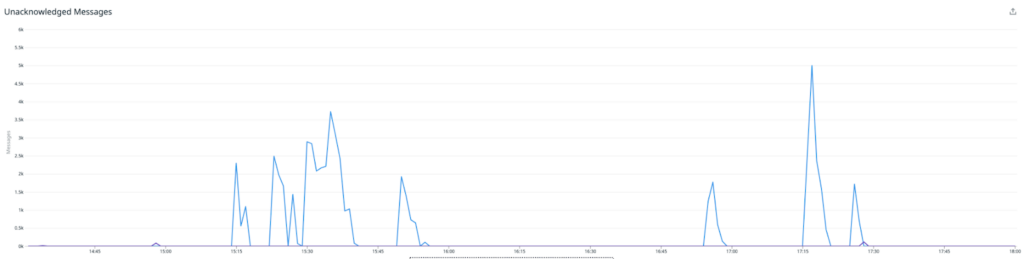
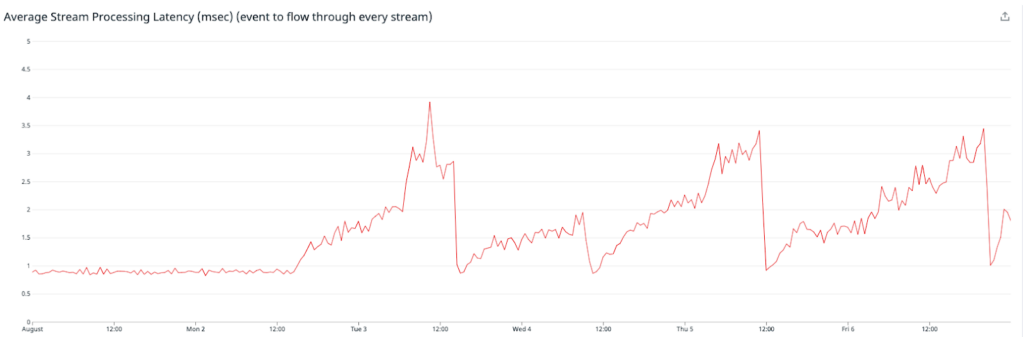
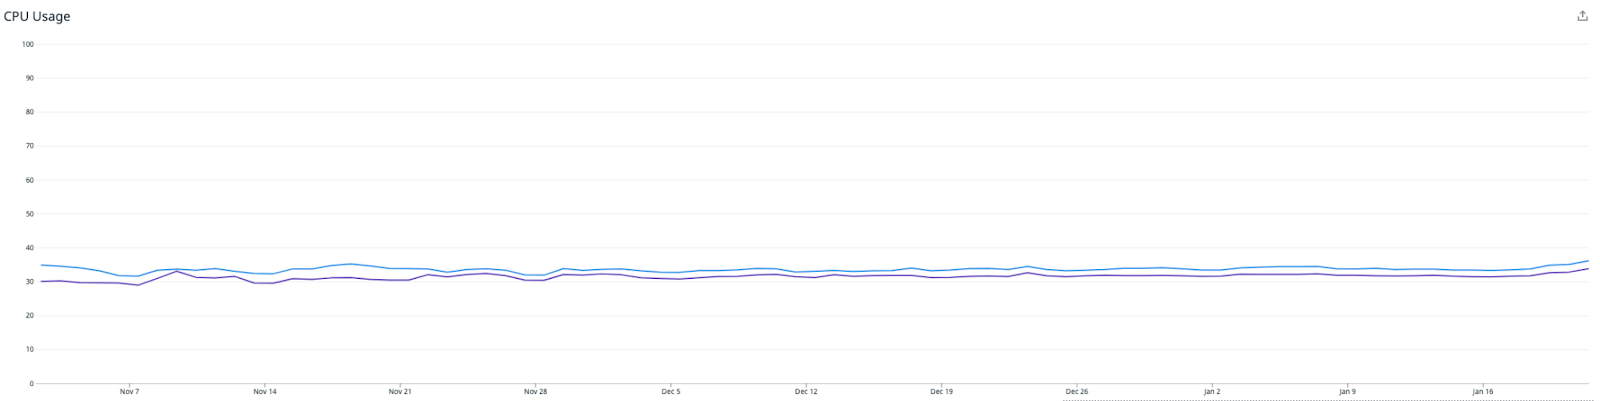
The average of monitoring boxes with the feature enabled is in blue, and the others in purple. As the image above relates, we saw our latencies spike significantly, which caused the queues upstream to spike heavily. We decided to turn off the experiment and assess.
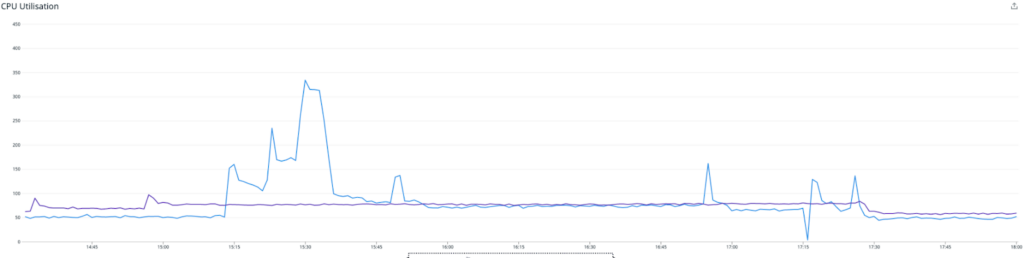
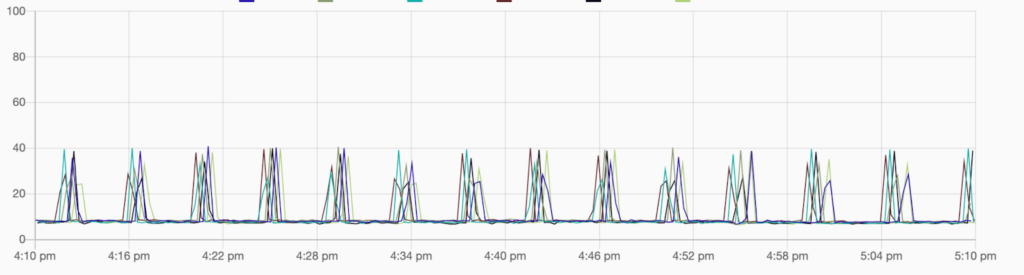
We also reached out to the Instaclustr Technical Operations team, who had a quick look at the Redis cluster for us, and reached the conclusion that it was humming along with minimal issues. The bottleneck was not with the Redis cluster itself.
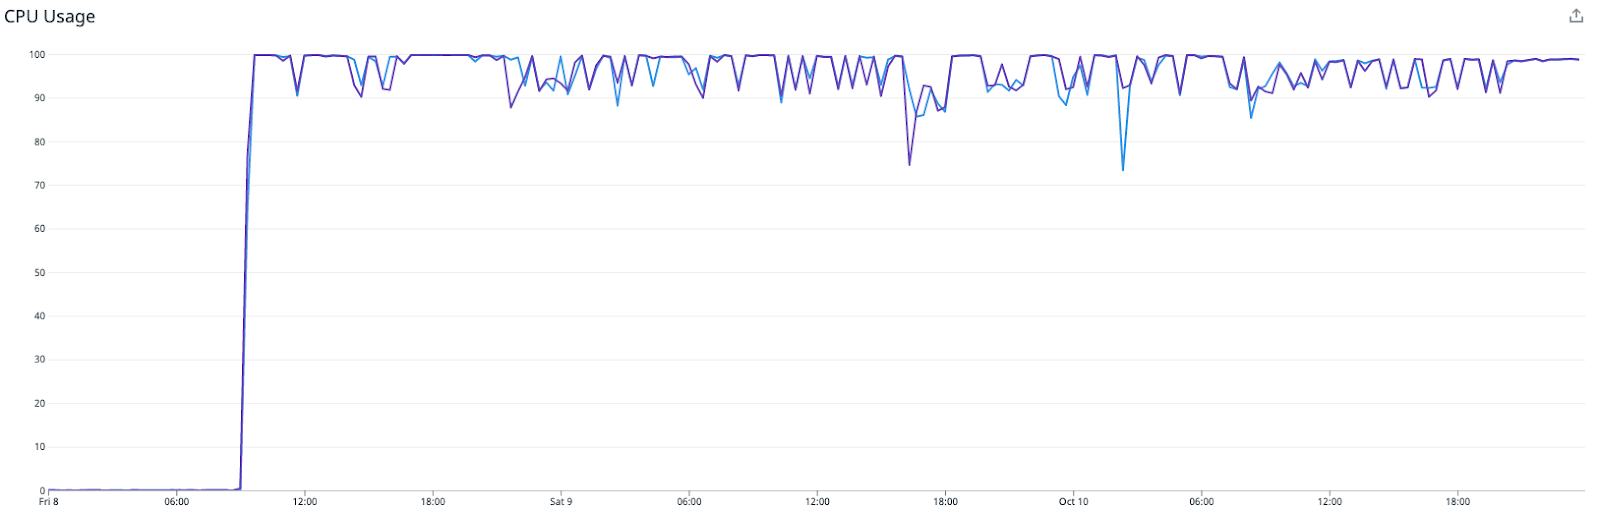
This graph shows the CPU load—the periodic spikes are due to AOF rewriting, which we will write about in a subsequent article. Without them it was sitting at around 10% cpu load while ingesting roughly 30% of the total metrics.
All in all, a reasonable first attempt, but improvements had to be made!
Attempt 2
We were observing much more cpu being consumed on our monitoring servers than was anticipated and went to find some improvements. After a bit of poking around, we found a function that was moderately expensive when called once per metric collection, but was having its impact amplified when we called it 2-3 times due to the new Redis destination.
We did some work and consolidated the call so it was back to only once per cycle and turned it all on again.
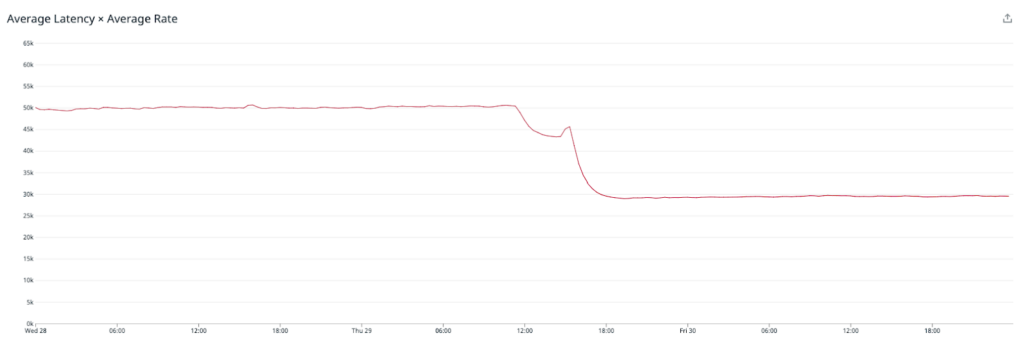
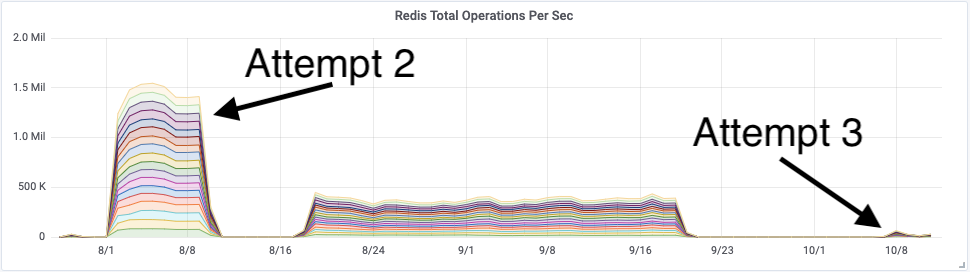
As you can see, the average latency of our processing engine decreased markedly, including turning on the Redis metrics shipper! Our Redis cluster was, again, humming along with no issues. Each node was processing 90 thousand operations per second and sitting at around 70% cpu with plenty of memory overhead available.
Job done! It was time to start using these metrics in the API.
Attempt 2: Continued
No such luck.
Having solved the processing latency problem, we thought we were in the clear. But after leaving the servers alone for a few days, we observed sporadic CPU spikes causing the servers to spiral out of control, crash and then restart.
We were seeing a correlated increase in application stream latency—which was indicating that they were gradually slowing down, before crashing, and restarting.
This was observed on the busiest servers first, but eventually all of them experienced similar symptoms.
We had to turn off metrics shipping to Redis, again, and go back to the drawing board.
The issue was that we were running out of optimization options. Our monitoring pipeline is written in Clojure, and the options available for client libraries and support are constrained. We often end up calling out to native Java libraries to get the full functionality we require, but that can come with its own set of issues.
At this stage, we were a bit stuck.
Kafka to the Rescue
Thankfully we were not the only team working on improving the monitoring pipeline. One of our other teams was getting close to the final implementation of their Kafka metrics shipper.
The raw metrics would go to a Kafka cluster first, before their final destination into our Instametrics Cassandra cluster.
Once the metrics are in Kafka, the possibility space opens up for us significantly. We can afford to ingest the metrics at a slower pace, since we are no longer blocking an incoming time critical queue, we can scale consumers more easily and time-walk records when necessary if there is a failure.
While they were working on getting it completely stable, we were writing the second version of our Redis metrics shipping service. This time we were consuming the metrics out of Kafka, and were able to build a small Java application running on a familiar set of tools and standards.
This really validated our choice of Kafka as the core of our metrics pipeline. We are already seeing the benefits of having multiple teams, creating multiple applications, all able to consume the same stream of messages.
Removing the above constraints around processing time on our monitoring instances meant we could push out this microservice in minimal time and effort, and have all the instrumentation we need using jmx metrics and logging tools.
Attempt 3: Redis Writers as Dedicated Kafka Consumer Applications
Developing an application to read from Kafka and write to Redis was reasonably straightforward, and it wasn’t too long before we had something we were ready to begin testing.
We deployed the new Redis writer application to our test environment and let it soak for two weeks to check for stability and correctness. Our test environment has very little monitoring load compared to the production environment, however with both the Redis writers and the Redis cluster remaining stable after two weeks in the test environment, we decided to push ahead and deploy the writers to production to test using the production workload.
This was another one of the major benefits of deploying our monitoring infrastructure on Kafka. We saw this as an extremely low risk deployment, as even if the Redis writer was unable to keep up, or needed to be stopped, or just generally buggy, it would have placed only a tiny amount of additional load on our Kafka cluster – with no dependency on the rest of the system.
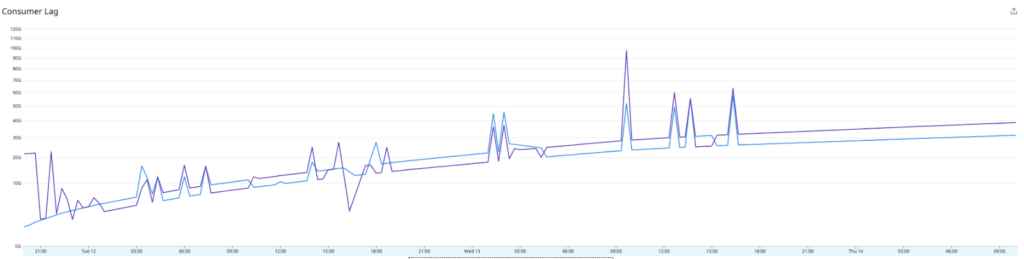
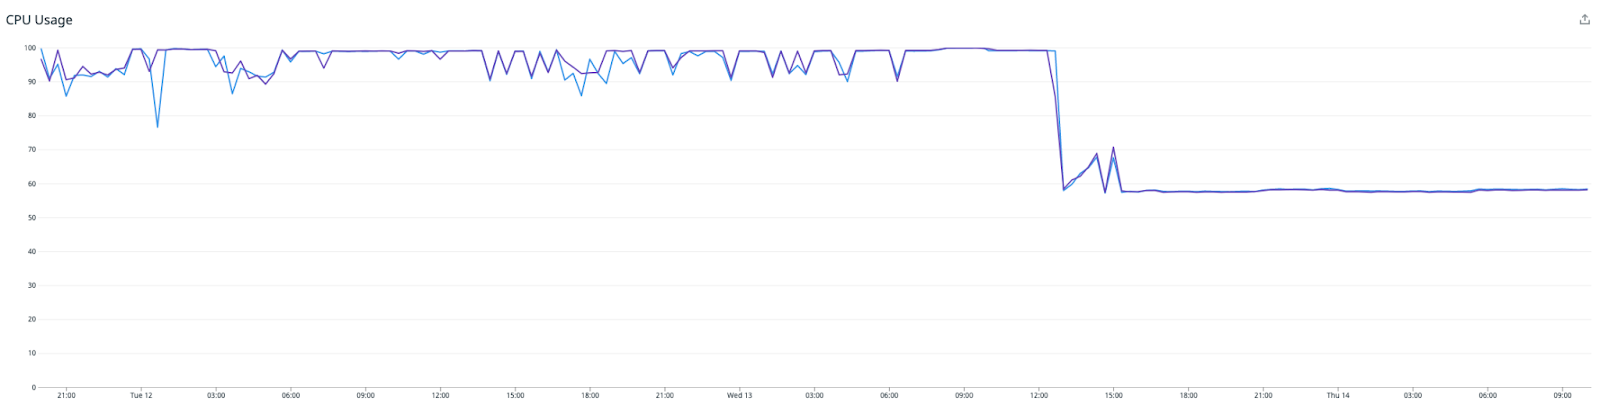
After deploying the Redis writer application to production, it became obvious that the writers could not keep up with the amount of traffic. The CPU utilization was maxed out, and rapidly increasing consumer lag for the Redis-writer consumer group. The overall throughput was only a fraction of what the original riemann based solution was able to achieve.
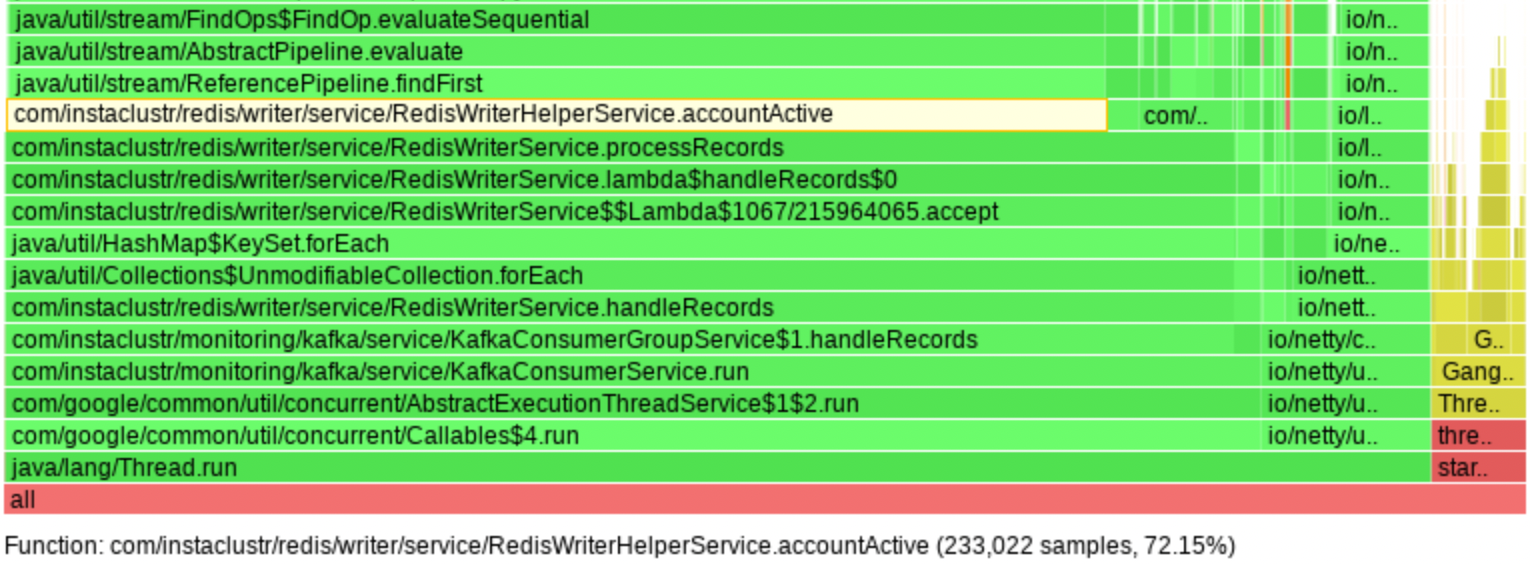
Problem 3a: Excessive CPU Usage by the Writers
The next steps were to try and figure out exactly why our Redis writer was unable to meet our performance expectations. For this we began profiling using async-profiler, which revealed that 72% of CPU time was spent performing linear searches through lists of recently active object IDs. Essentially the code path which worked out if a customers metrics should be stored in Redis. That’s right, almost 75% of CPU was spent working out if we should cache a metric, and only 25% was utilized actually saving the metric to Redis. This was further worsened by the usage of the Java Stream API in a way that caused a large number of invokeinterface JVM instructions, contributing 24% towards the 72% total. For lists containing thousands of IDs, the solution is to use hash tables.
Problem 3b: Redis Caching Cluster Runs Out of Memory
While working on problem 3a, a would-be disaster strikes! Our monitoring system alerted the on-call support team about an outage of the internal Redis caching cluster, which was quickly determined to be caused by the cluster running out of memory. How is it that we are running out of memory when we are processing less data than before? And how did we run out of memory when our Redis clusters are configured with what was thought to be reasonable memory limits, along with a least-recently-used (LRU) eviction policy?
Analysis of the new Redis writer code revealed a bug in the TTL-based expiration logic that rendered it almost completely useless for any non-trivial volume of data. It only applied the TTLs during one minute intervals every 30 minutes, so most of the data ended up with no TTLs, leading to the uncontrolled growth of memory usage. This was an unnecessary optimization, so we can fix it by always updating the TTLs when writing metrics, which is an easy enough change. But this led us to another larger question—why did the fallback memory limit mechanism not work?
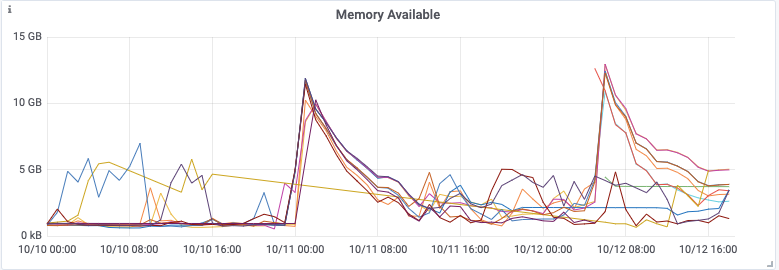
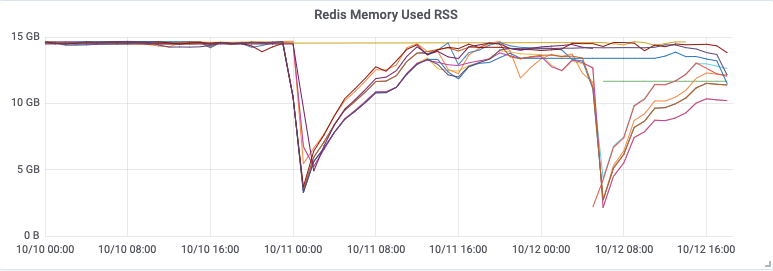
The used-memory metrics reported by Redis tells us that the memory limit was respected, at least until the cluster started falling over, but what was surprising was the inverted spikes in the memory available as reported by the system, sometimes reaching down to zero!
We compared the timestamps of the spikes to Redis logs and discovered they are caused by append-only-file (AOF). Further research revealed the general problem, that the Redis peak memory usage can be much higher than the max memory limit (redis#6646). Redis forks the main process to take consistent snapshots of the database, needed for the AOF rewrite. Forking is typically space-efficient because it uses copy-on-write (COW), but if the workload is write-heavy, a significant proportion of the original memory pages needs to be copied. For this workload, we would need to restrict the Redis max memory to less than half of the total system memory, and even then, we needed to perform testing to be sure that this would prevent Redis from running out of memory.
Problem 3c: Inefficient Metrics Format in Redis
Our application stored metrics in Redis as JSON objects in sorted sets. After a few iterations of the solution, we ended up with a legacy model that duplicates the key name in each value. For the typical metric value, the key name started accounting for about half of the memory usage.
For example, here is a key for a CPU load metric of a node:
|
1 |
{46e4157b-e6de-42e1-9c37-5fe5e8d1e676}/metrics/cpuUtilization |
And here is a value that could be stored in that key:
|
1 |
{"service":"{46e4157b-e6de-42e1-9c37-5fe5e8d1e676}/metrics/cpuUtilization","time":1623814124123,"value":0.0} |
If we remove all the redundant information, we can reduce this down to:
|
1 |
{"time":1623814124123} |
In addition to removing the service name, we can also remove the value if it is the default. With both of these optimizations, we can reduce memory usage by approximately half.
Attempt 4: Bugfix, Optimize, and Tune
After the problems were fixed, the CPU usage dropped, and the throughput increased, but the ever-increasing consumer lag barely slowed down. We still just weren’t processing as many messages as we needed to to keep up with the incoming event rate.

The low CPU usage along with the lack of any other obvious resource bottlenecks suggested that some sort of thread contention could be happening. The Redis writer uses multiple Kafka consumer threads, but all threads share the same instance of the Lettuce Redis client, which is what the Lettuce documentation recommends. Going against the recommendation, we tried refactoring the Redis writer so each consumer thread gets its own Lettuce client.
Success! Immediately after deploying the new Redis writer, the throughput has doubled, and the consumer lag is racing downwards for the first time.
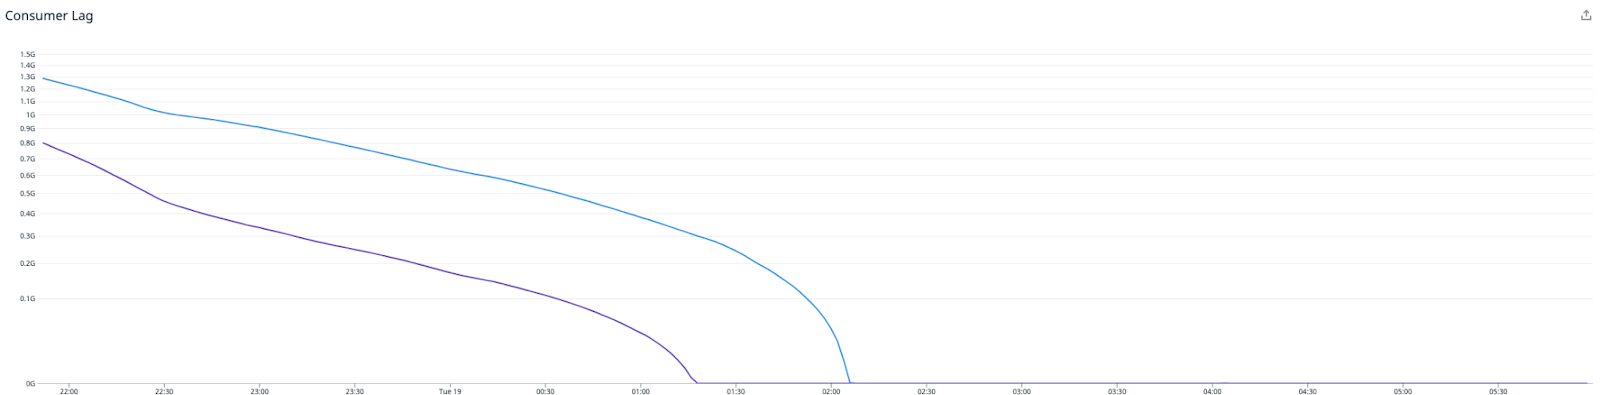
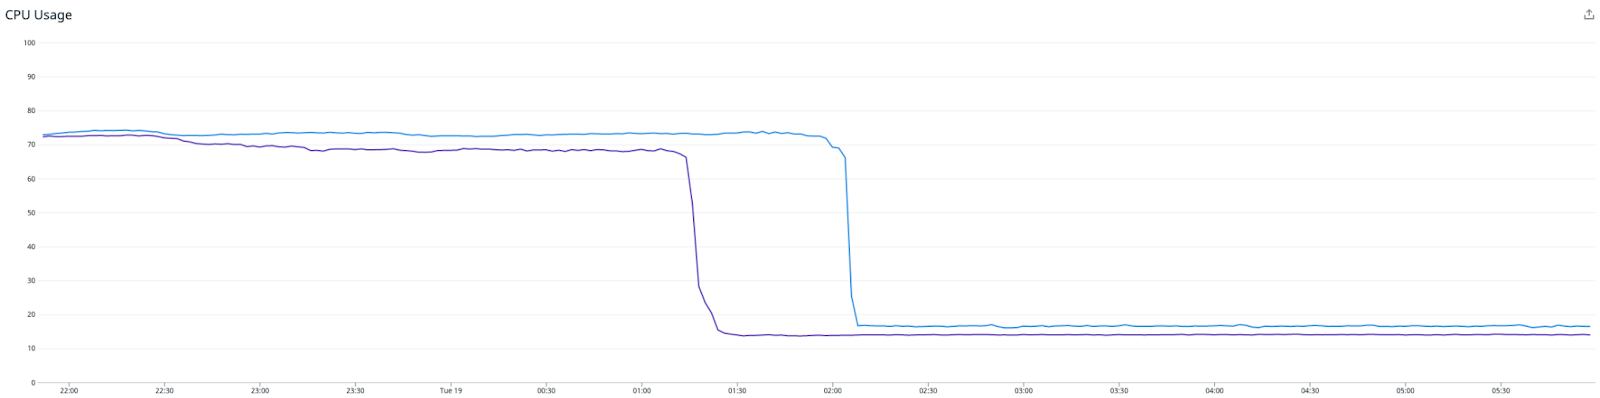
Note that a higher load is sustained while the writer is catching up. Once it has processed the backlog of metrics, the CPU drops significantly to around 15%. At this point, all we have left to do is to downsize the Redis writer instances to best match the CPU usage between the Redis writer and Redis cluster, while leaving plenty of headroom for future growth.
Turning on Reading from the API
So now we have a pipeline which is continually caching the last 15 minutes of metrics for any customer nodes who have used the api recently. But that won’t have any impact unless we extend our API to query Redis!
The final piece of work that needed to be completed was allowing our API instances to query metrics from Redis!
In the end our API logic only filters for metric requests based on time, and if it is in the last 15 minutes – queries Redis first. Redis is fast at reads, but is extremely fast in saying that it doesn’t have a cached value. So rather than trying to programatically figure out if a particular recent metric is cached, we try redis, and if it’s not there – we query from Cassandra. Taking a “fail fast” approach to the metrics retrieval only adds a very minor latency increase in the worst case.
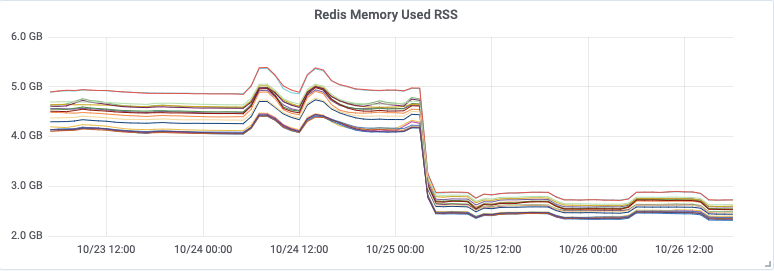
The initial deployment of the API feature worked quite well, and we were seeing a reduction in reads from our Cassandra Cluster. However we did have some edge cases causing issues with a small number of metrics, requiring us to turn off the feature and develop a fix. This final solution was deployed on the 27th of October.
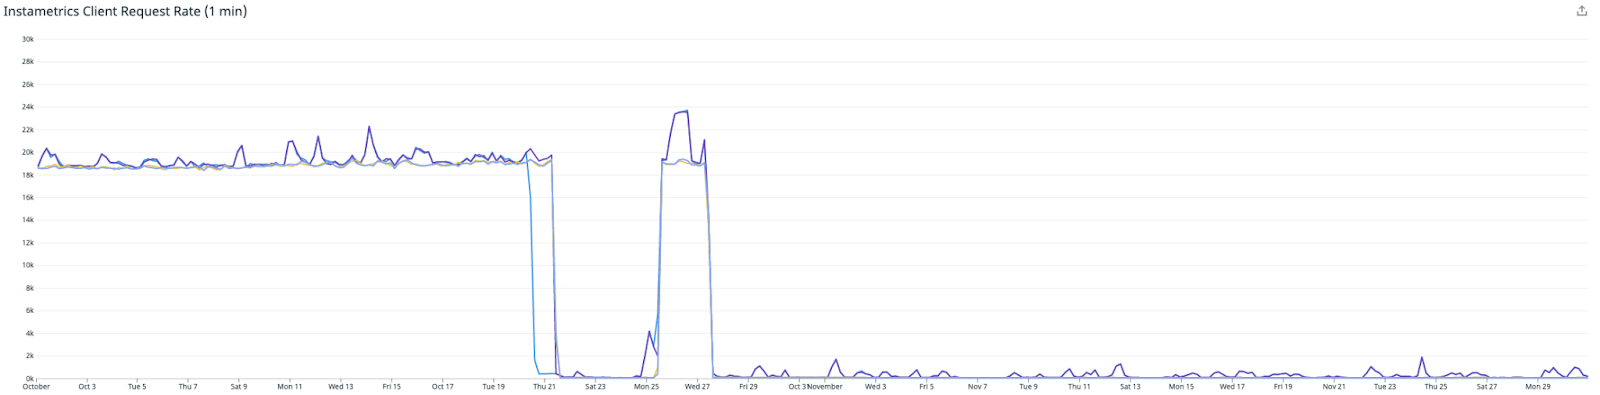
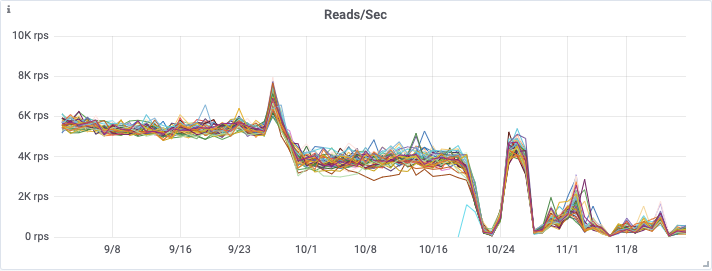
This first graph shows the reduction in the number of requests which were hitting our Instametrics Cassandra cluster from our API – showing that we have almost eliminated these reads.
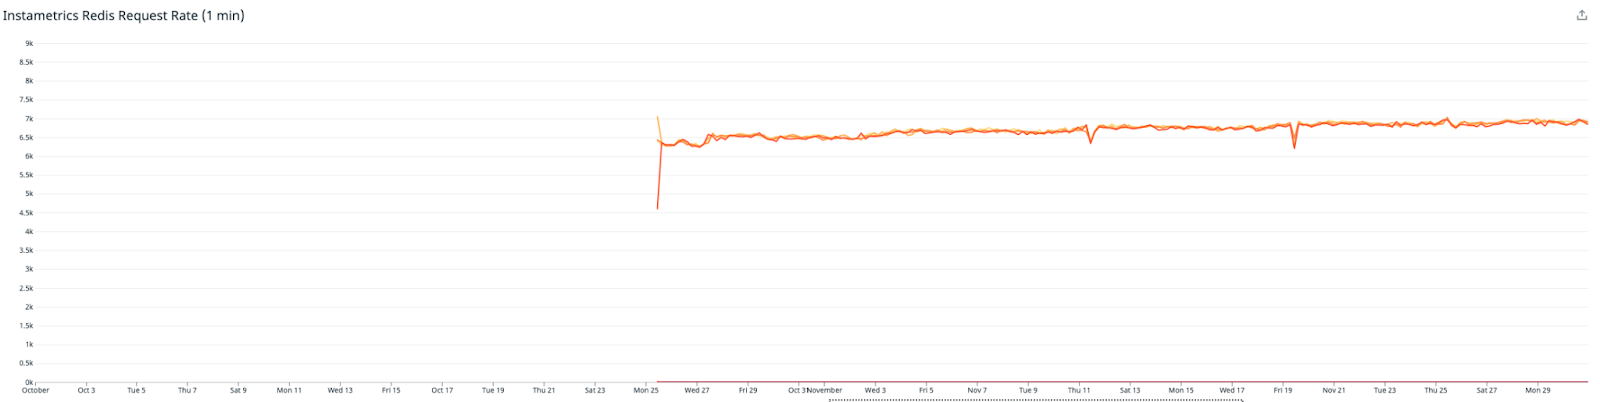
This graph shows the number of reads that had been moved to our Redis Cluster (note this metric was only introduced on the 25th of October)
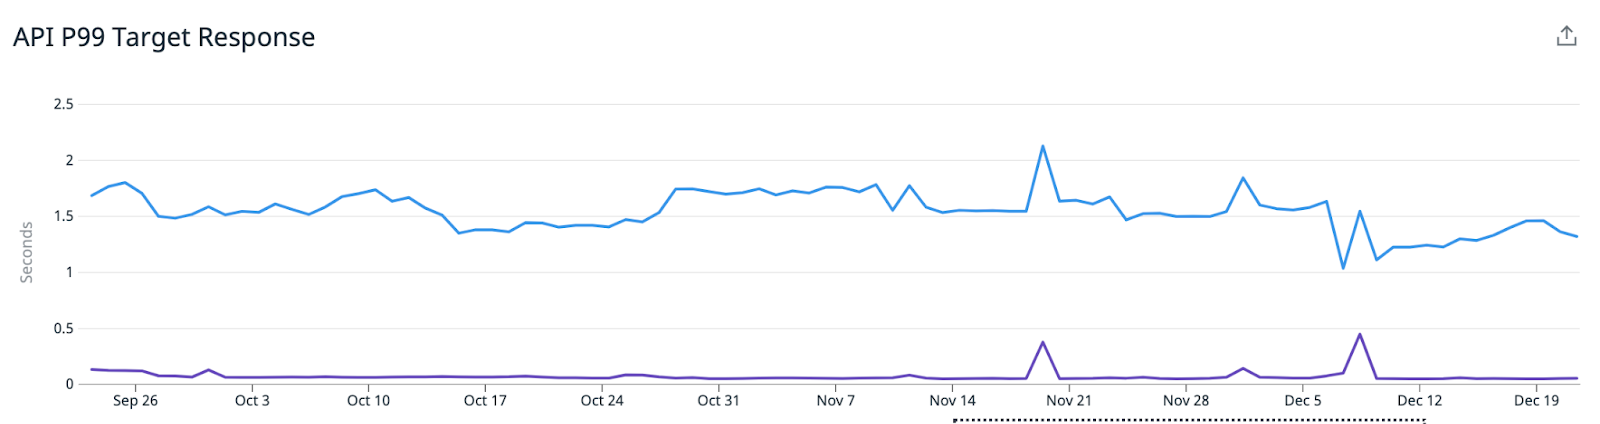
The interesting part is – that this actually hasn’t had a large impact on our API latencies. We are still reporting very similar P95 (blue) and P50 (purple) latencies.
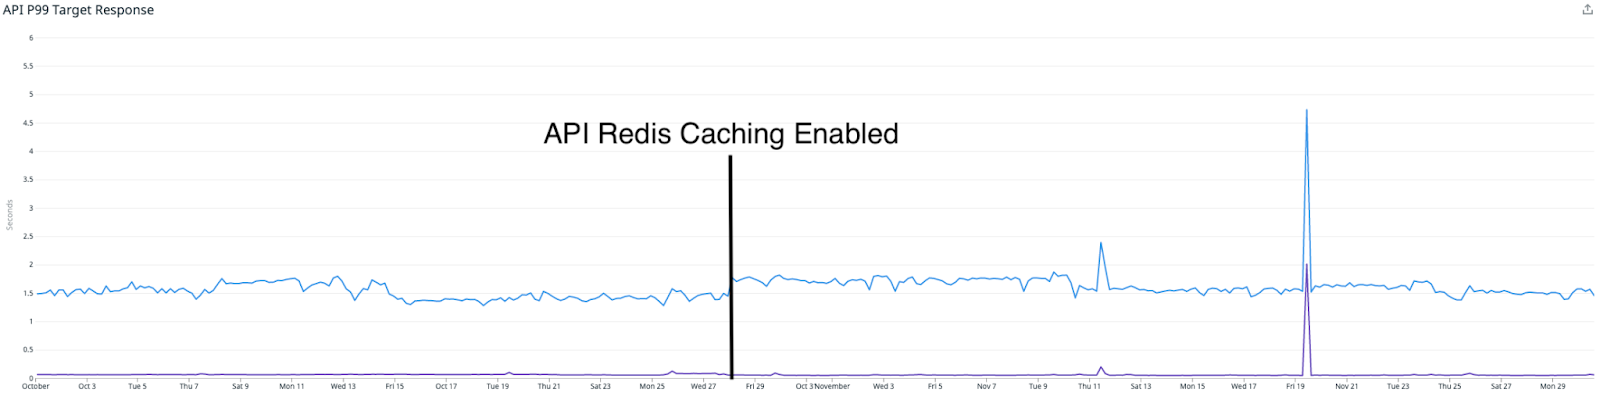
This can actually be explained by two things:
- Our Cassandra cluster was very large at this point, over 90 nodes of i3.2xlarge nodes, which includes extremely fast local storage. This meant that any read requests were actually still being serviced in a reasonable time.
- The Redis cluster is much smaller than our Cassandra cluster, and we can still make some performance improvements. One is by moving from AOF persistence, to diskless persistence, which should further improve performance for a large write heavy workload like ours.
At this point – the major benefit for our Redis Caching of metrics, is the impact it has had on our Cassandra cluster health. When we started work on our Redis Caching, we had a 90 node i3.2xlarge Cassandra cluster. This was actually resized to a 48 node i3.4xlarge cluster in early September to provide additional processing capacity.
The first improvement the cluster saw was the Kafka based Rollups, which was released on the 28th of September, then the Redis Caching close to one month later on the 27th of October.
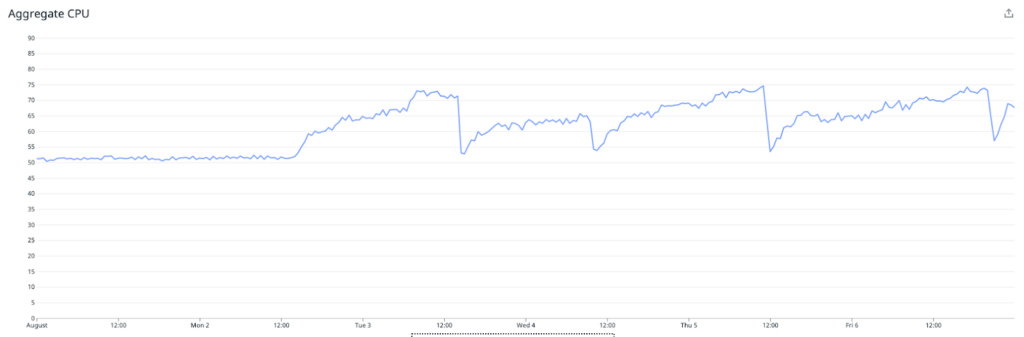
You can see from the below graphs the significant improvement that both of these releases had on on CPU utilization, OS Load, and the number of reads being performed on the cassandra cluster.
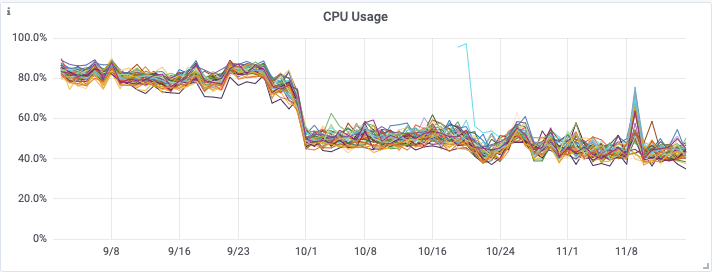
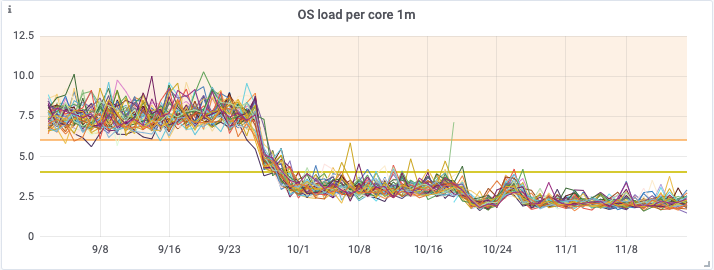
In the end this enabled us to downsize our Cassandra cluster from a 48 node i3.4xlarge cluster, to a 48 node i3en.2xlarge cluster in mid November. This represents a large saving in infrastructure costs, whilst maintaining our new found cluster health, and read latencies.
Everything has been running smoothly for the past few months on our redis writers, with no major rework needed to maintain a stable caching pipeline, and we are continuing to see really promising customer impacts.
Stay tuned for an upcoming blog, where we explain how having a Redis cache enabled us to build our new Prometheus Autodiscovery Endpoint, which makes it really easy for customers using Prometheus to scrape all available metrics.
RabbitMQ® is a trademark of VMware, Inc. in the U.S. and other countries.
If you have questions about Instaclustr’s managed Redis get in touch today to discuss options