Monitoring at Scale Series
In this series of blogs, explore the various ways we pushed our metrics pipeline—mainly our Apache Cassandra® cluster named Instametrics—to the limit, and how we went about reducing the load it was experiencing on a daily basis over the course of several years. Beginning in 2015 and up until now, discover how Instaclustr has continued to build and expand its metrics pipeline over the years:
Vol. 1: Monitoring Apache Cassandra® and IT Infrastructure (December 2015)
Vol. 2: Upgrading Instametrics to Apache Cassandra® 3 (November 2016)
Vol. 3: The Introduction of Kafka® (January 2022)
Vol. 4: Using Redis™ as a Cassandra® Cache (March 2022)
Vol. 5: Upgrading our Instametrics Cassandra® Cluster from 3.11.6 to 4.0 (June 2022)
Monitoring at Scale
The Instaclustr managed service fleet continues to grow: we are quickly approaching 10,000 servers under our management. This continued growth puts an increasing load on various aspects of the Instaclustr system, none more so than our metrics collection pipeline.
Every server, or “node”, in the fleet has a running agent that collects metrics and sends them to be processed. These metrics range from operating system metrics like CPU load and disk usage, to application specific metrics like compactions in Apache Cassandra® or number of in sync replicas in Apache Kafka®.
Internally, the metrics are used by our systems and teams to support and maintain the fleet. Routine maintenance operations and daily status reporting use the metrics to verify cluster health. Our automated processes use metrics to decide when it’s safe to progress and when to wait.
For customers, cluster metrics are made available via the Instaclustr Monitoring API, either in the JSON or Prometheus format.
These metrics are stored in an Apache Cassandra cluster, known internally as “Instametrics”. This cluster has evolved with the fleet. It’s expanded with our growth and been optimized with new technologies.
Over the years, Instametrics has been upgraded from Cassandra 2 to 3, then from version 3 to 4. We removed Spark™ from the Cassandra cluster and converted the rollup tasks to use Kafka streaming.
And we reduced the read load being generated by our monitoring API by using a Redis™ cache for frequently accessed metrics.
Today we’re going to hear about how we significantly reduced the disk usage of the stored metrics by tweaking the data schema in Apache Cassandra.
Cassandra as a Managed Service
The Instametrics cluster exists in our system exactly as a customer cluster does in our own managed service. The Engineering team is the customer, and our Technical Operations and Customer Support team (TechOps) is responsible for managing it and treating us just like any other customer.
Although we carefully use Time To Live (TTL) indicators on our data, as the fleet grows the size of the Instametrics cluster has needed to grow to the size it is today—76 i3en.2xlarge nodes in AWS.
Instaclustr’s automated systems are constantly monitoring the growth of Instametrics, and periodically it reaches a threshold where TechOps determines it requires more storage.
When this happens, they contact the Engineering team to get permission to add more nodes.
On one of these occasions, our team of experts in TechOps looked more closely at our usage of Cassandra and how it has changed over the years, to see if there were ways to further optimize it.
And we found a way to reduce our disk usage by over 20%, with just a change to our data schema.
So, what was the change?
Cassandra—Primary Keys, Partitions and the Index
The data schema used in Instametrics has remained largely unchanged for over 5 years and has stood the test of time—until now.
Here it is:
|
1 2 3 4 5 6 7 8 9 10 11 12 13 14 15 16 17 18 19 20 21 22 23 24 25 26 27 28 29 30 31 32 33 34 35 36 37 38 39 40 41 42 43 44 45 46 47 48 49 50 51 52 53 |
CREATE TABLE IF NOT EXISTS instametrics.events_raw_5m ( host text, -- The id of the server or node bucket_time timestamp, -- Metrics are stored in 5 minute buckets service text, -- The metric name, e.g.: /cpu/percent time timestamp, -- The actual time of the metric metric double, -- The metric value, e.g.: 14.5632 state text, PRIMARY KEY ((host, bucket_time, service), time) ) WITH CLUSTERING ORDER BY (time DESC) AND bloom_filter_fp_chance = 0.01 AND caching = { 'keys' : 'ALL', 'rows_per_partition' : 'NONE' } AND comment = '' AND compaction = { 'class': 'org.apache.cassandra.db.compaction.TimeWindowCompactionStrategy', 'compaction_window_size': '6', 'compaction_window_unit': 'HOURS', 'max_threshold': '32', 'min_threshold': '4' } AND compression = {'sstable_compression': 'org.apache.cassandra.io.compress.LZ4Compressor'} AND crc_check_chance = 1.0 AND default_time_to_live = 1209600 AND gc_grace_seconds = 11000 AND max_index_interval = 2048 AND memtable_flush_period_in_ms = 0 AND min_index_interval = 128 AND speculative_retry = '99.0PERCENTILE'; |
After all the information into account, TechOps suggested we change this line:
|
1 |
PRIMARY KEY ((host, bucket_time, service), time) |
To this:
|
1 |
PRIMARY KEY ((host, bucket_time), service, time) |
So, what does this change do?
In Cassandra, a primary key is made up of 2 components: the partition key and the clustering key.
The partition key is responsible for evenly distributing data within a cluster. Cassandra uses a consistent hashing algorithm to split the data, using the partition key, into a number of partitions. It then assigns these partitions evenly around to all the available nodes.
The partition key is a composite key – made of multiple columns and is defined inside the inner parenthesis – (host, bucket_time, service).
The clustering key informs Cassandra how to sort and store the data within each partition to ensure reads from disk are as efficient as possible.
In our schema, the clustering key is what remains—time.
So, what did we achieve by removing the service column from the partitioning key?
Before we can understand what we changed, we need to understand the tradeoffs that are made when designing a data model for Cassandra.
The goal is to develop a model where we distribute the data as evenly as possible throughout the cluster, while minimizing the number of partitions read in a single request.
If your partitions are too large, it makes distributing the data evenly across the cluster difficult.
If they are too small, your read performance will suffer because you end up reading too many partitions for each request.
For Instametrics, we had too many partitions—but our read performance wasn’t the primary problem! In previous enhancements, we worked to reduce the CPU load on the cluster to the point where we were happy with its latency and throughput.
The main issue was how much disk space these partitions were causing us to consume.
It turns out, the sheer number of partitions we had, combined with the values in the partition key, was causing the Partition Index in Cassandra to blow out in size.
“Blow out” is an understatement here. In some cases, the index was over 50% the size of the actual data. In one particular data window there was 13GB of data and a 9GB index!
What was going on?
Partition Index Under Scrutiny
Instametrics operates like a customer cluster in every way except for one important exception. TechOps is authorized to look inside the data of our cluster.
When our Cassandra experts looked at the files for an Instametrics node, they immediately noticed the partition index was enormous and looking closer they saw two things:
There were hundreds of thousands of entries in the index, one for each partition, and each index entry consisted of multiple strings, some of them very long.

An excerpt from a partition index
The partition index is uncompressed, meaning large string values have a direct impact on file size. The number of entries in the Index combined with the size of each entry was causing the file size to grow incredibly large.
So why were the entries so large? Due to the columns included in the partition key and their data types.
A single row of metrics data looks like this:
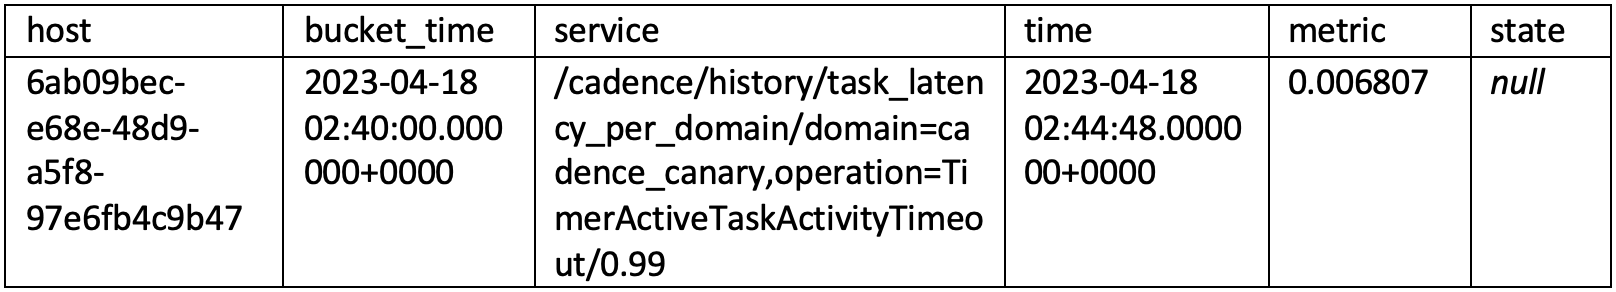
A row of metrics data
We can see that 2 columns have string values—host and service. With our existing schema, both of these fields end up in the partition index because they make up the partition key.
The main problem is the service column which contains the name of the metric. These can range from being fairly short to extremely long.
In the above excerpt from the partition index, you can see that the bucket_time field and some other values are represented by binary values, but the host and service values are in plain text and make up the bulk of what we see.
Combined with the sheer number of entries in the file, the result ended up being that the partition index was, at times, more than half the size of the data it was indexing.
Note that Summary.db (which is an index on index.db) will also get smaller (less entries in Index.db and each entry in Summary is also smaller) [ZC1]
Updating the Schema
Now we understand the problem, how did TechOps determine that we should move the service column, or metric name, outside of the partition key?
First of all, it was clear that we were over-partitioning the data in our cluster. Each partition ended up holding a maximum of 15 records, and sometimes less than that.
However, it isn’t as simple as merely identifying that the metric name was too long and saying it was unnecessary.
Remember, we want to distribute the data as evenly as possible throughout the cluster, while minimizing the number of partitions read in a single request.
If we moved the metric name out of the partition key, would that adversely impact the applications in our system that read the metrics? Would that cause too much data to end up in a single partition?
Our experts in TechOps worked with our Engineering team to understand our use case, and they were able to do some additional analysis on the cluster.
Specifically, they looked at the improvements we’ve made in the preceding years and how the schema was involved:
- The tiny partitions made more sense back when we were using Spark to read every row of data out of Cassandra and perform rollup calculations, but those processes were replaced with a Kafka streaming application.
- Our monitoring API has been optimized and we’ve introduced a Redis cache for the frequently accessed metrics.
These improvements have steadily reduced the read load on our cluster, to the point that TechOps was confident that we could change the schema without adversely affecting our cluster performance.
In fact, they determined that the bulk of requests for metrics obtain all the metrics for a node at a time.
By putting all the metrics for a node into a single partition, rather than hundreds of partitions, we could improve the efficiency of these requests and further reduce CPU usage.
Making the Switch
The final piece of the puzzle was making the change.
It’s not possible to change the primary key in a Cassandra table, so the only alternative is to create another one.
The engineering team decided to create a new keyspace and set of tables and they did some performance modeling and testing in our lower preproduction environment.
The results from the testing indicated everything was looking good, so the final step was to introduce the change to all our systems.
As we mentioned before, there are many Instaclustr systems that need access to the metrics data, and the Engineering team has carefully ensured that all access to Instametrics happens via a common library.
Thanks to this design pattern, the Engineering team only had to make the schema change once, and then deploy the impacted systems.
The Engineering team decided to implement time-based switching logic in the Instametrics library. Any request for data before a certain date would go to the old tables and anything else would go to the new ones.
We deployed the new schema and tables, updated the dependent systems with the new logic and waited.
Impact
As soon as all the systems swapped over to the new schema, the results were plain to see.
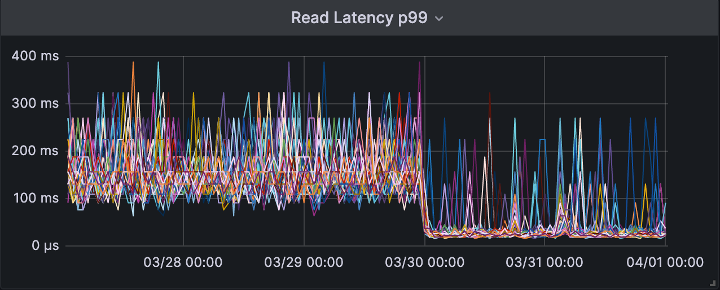
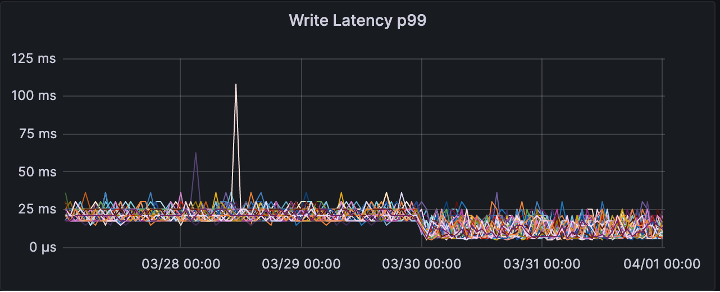
P99 read and write latency was reduced instantly.
Most of the read load for Instametrics comes from customers requesting the latest data for their cluster, and all the data is now located in a single partition.
The write latency is reduced thanks to having less partitions.
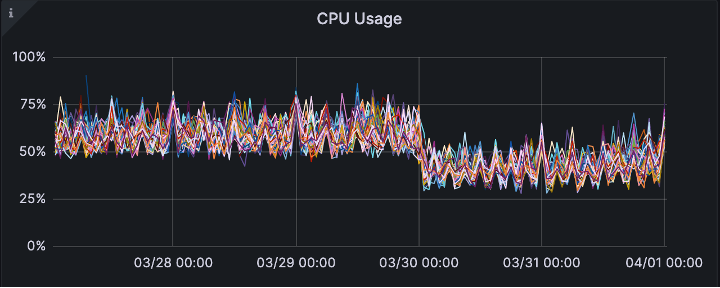
CPU usage reduced. As TechOps suspected, the new data model is more efficient for our current demand.
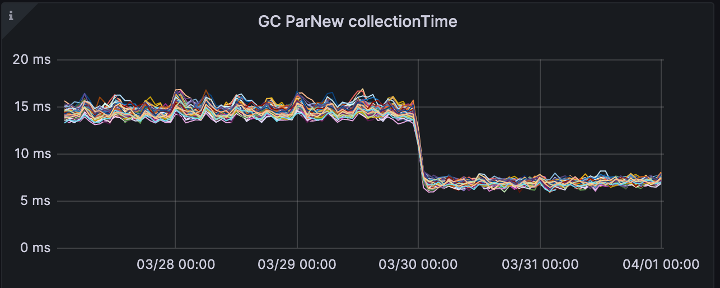
Garbage collection (GC) time is improved.
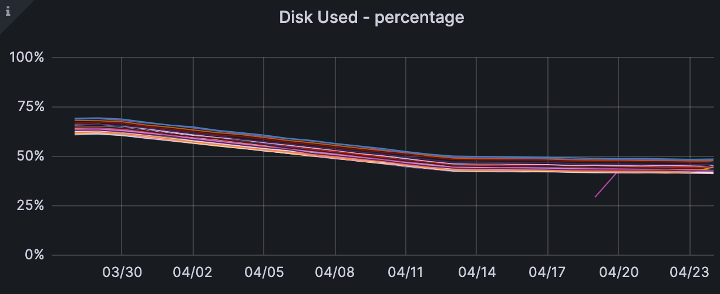

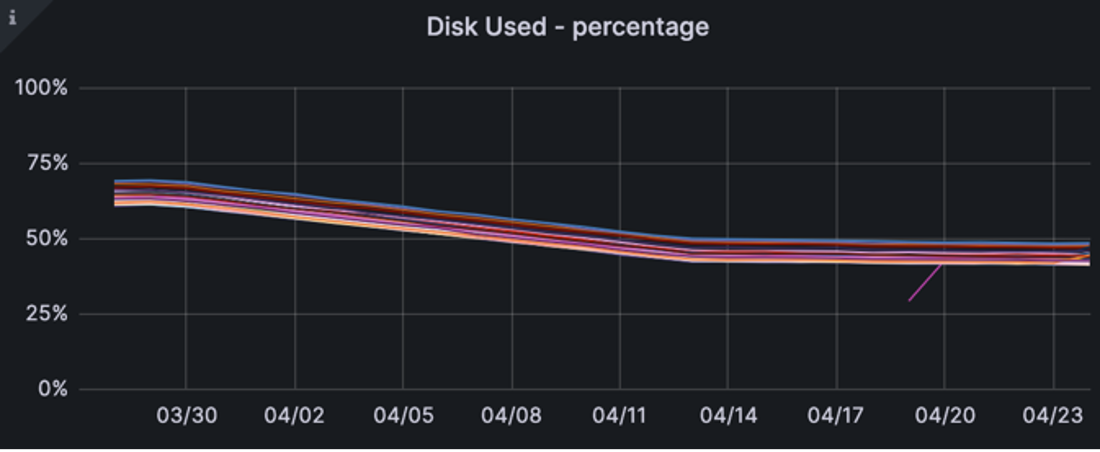
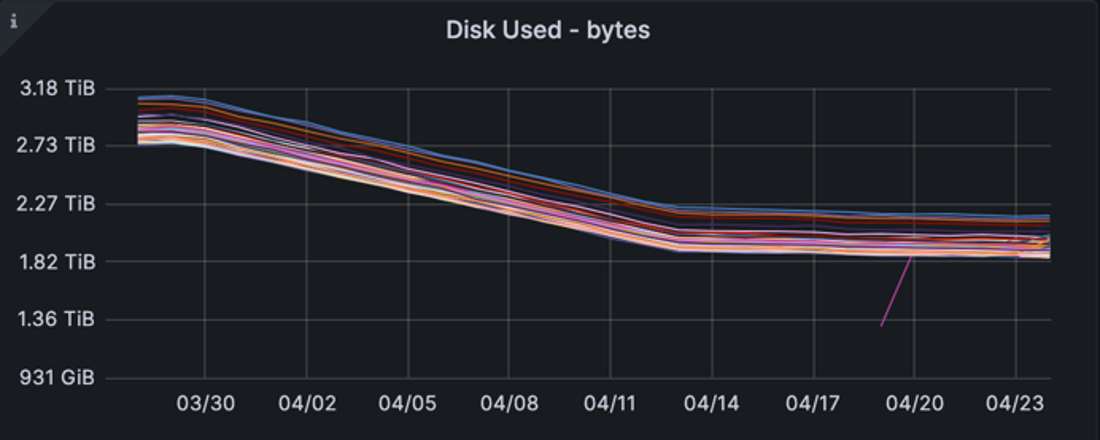
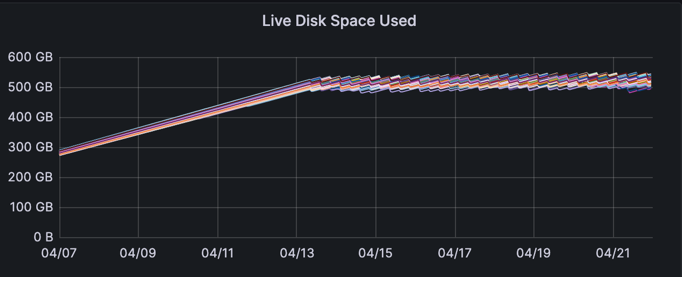
Finally, to our goal of disk usage. In the weeks immediately following deployment, we see a reduction from an average 67% disk usage to 45%.
Looking closer at the file system, TechOps compared the old and new schema on disk.
| Old 6-hour window | New 6-hour window |
| · 13GB data
· 9.4GB index Total 22GB |
· 7.7GB data
· 237MB index Total 7.9GB |
On those particular tables, the disk saving was around 65%! The index file is significantly smaller as expected, but another interesting saving is the size of the data itself.
The team in TechOps identified that by changing the partition key, there is less now metadata being stored. Each partition contains: partition key, localDeletionTime (integer), markedForDeleteAt (long).
By consolidating the partition count, we removed a lot of this data before compression and reduced its size.
We also looked at the same column family in each keyspace and compared a few of the values
(Old schema on top, New on bottom)
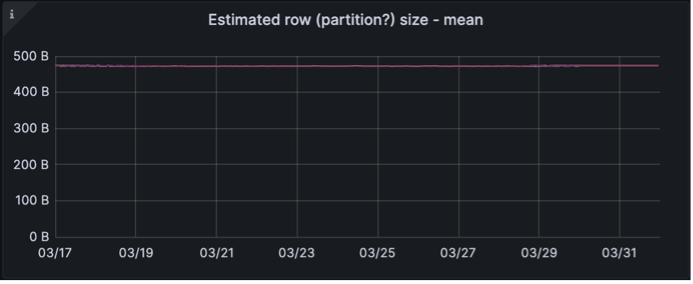
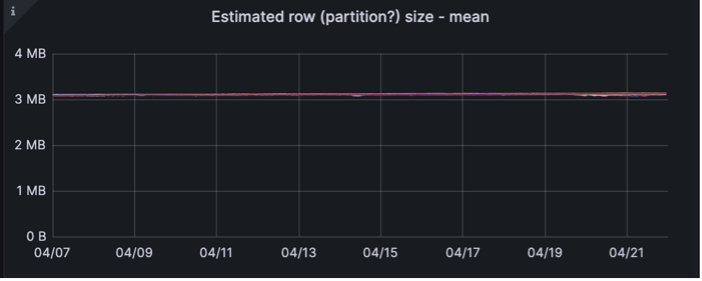
The size of the partitions grew as expected, from 500B to 3MB.
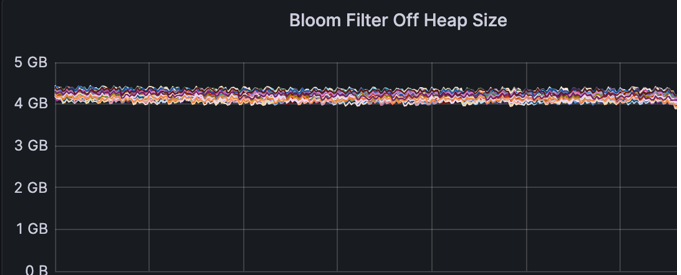
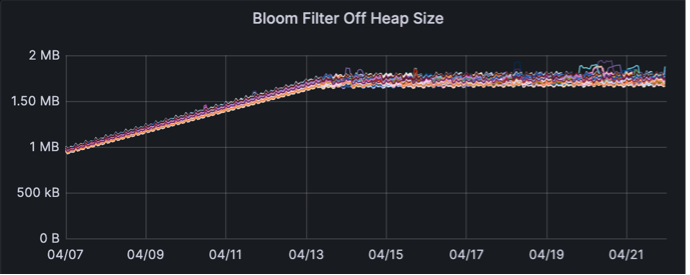
The bloom filter is taking significantly less off heap memory.
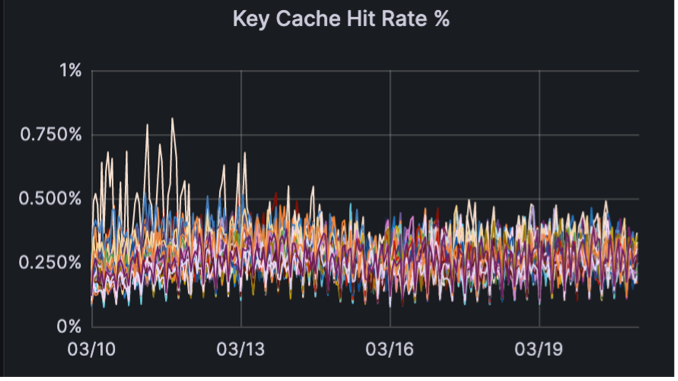
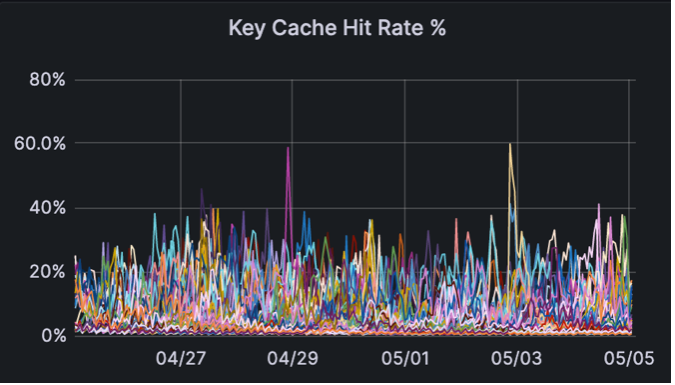
The Key Cache hit rate has significantly improved, from virtually zero to 20%.
And re-enforcing what we already saw, this particular table has reduced its size by a factor of 3!
This timeframe represents the bulk of the data that is stored in our cluster, but not all of it.
The full scale of the savings will take months to realize, as the older data reaches its TTL and is compacted away finally.
The final estimate is a disk savings of around 30% across all tables.
Conclusion
Instaclustr continues to grow and mature. As it does, our team of experts are continually growing their expertise in Apache Cassandra, Apache Kafka, and the other products we offer on our managed service.
Our experts in engineering and technical operations managed to reduce our own storage requirements and improve the general efficiency of our cluster.
Over the coming months, we will be able to scale down the Instametrics cluster by decommissioning nodes and consolidating the data. This will reduce both the infrastructure cost and the general maintenance tasks associated with larger clusters.
Instaclustr is solving problems like this every day across our managed service and support offerings. This expertise is available to all of our customers and can save you time and money when employing open source technologies in your company.
Talk to our experts today.