As a new member of the Product Team here at Instaclustr, I wanted to explore our offerings by connecting Logstash with our Managed Elasticsearch and Kibana. Having had no prior experience with the ELK Stack, and wanting to find out more about the power of Elasticsearch, I thought “How hard could it be?”
What Is the ELK Stack and Where Does Logstash Fit?
Logstash is a tool designed to aggregate, filter, and process logs and events. Logstash can take a variety of inputs from different locations, parse the data in different ways, and output to different sources. One of the more powerful destinations for Logstash is Elasticsearch, where the logs can be indexed and searched. Aside from the fast searchability, once the data is available in Elasticsearch it can easily be visualized using Kibana.
Kibana can be used to create visual dashboards so that you can make your data work for you. You can see trends, explore data visually, and create meaningful graphs that can be shared with other parts of your business. Together the first letters of these tools make up the “ELK Stack” which will help to search, analyze, and visualize your data.
Logstash itself can be a little difficult to configure as you have to customize how the data is manipulated. However, connecting it to Instaclustr’s Managed Elasticsearch and Kibana only takes a few short steps once you have your Logstash configuration ready to go.
Finding Data to Work With
A normal use case for Logstash would be to follow and consume something like Apache HTTP logs, to send them into Elasticsearch, and make them available in Kibana. However I was looking for something a little more exciting for my first foray into this stack, so I went looking for some different data I could use.
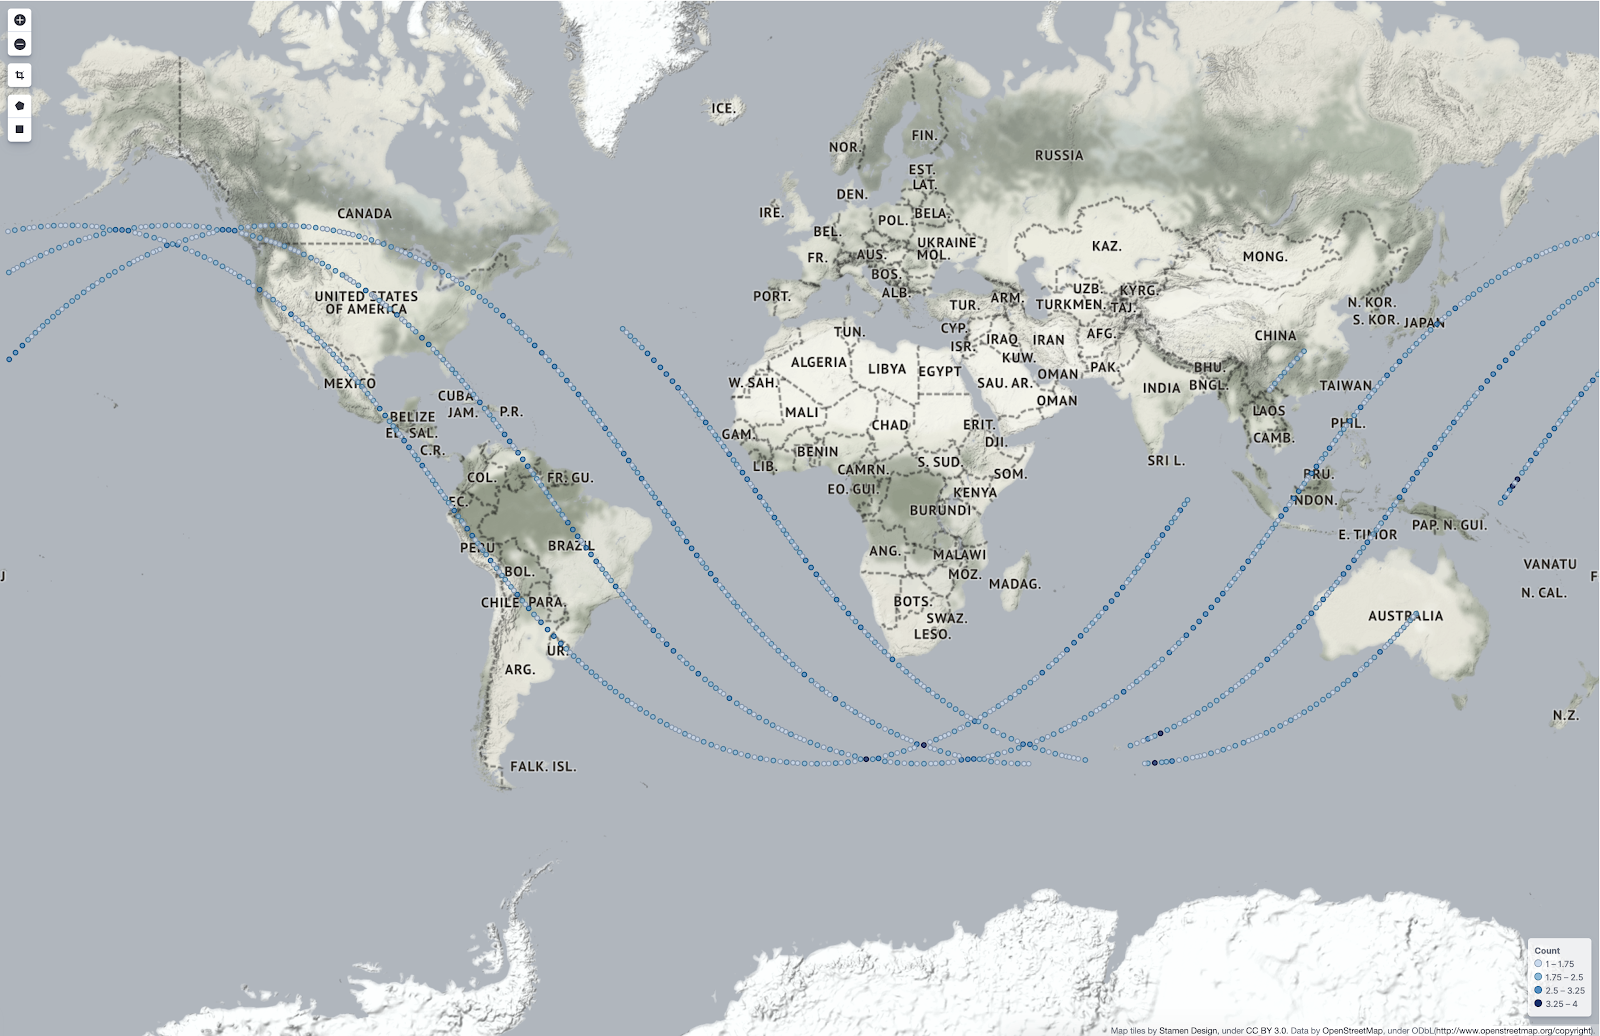
Knowing that I could use Kibana for a Coordinate Map, and that I find it very interesting that people live in a big, floating space apartment for the advancement of humankind, I decided to map the path of the International Space Station (ISS).

The current location of the ISS can be found on open-notify.org, an open source project where a REST API provides the latitude and longitude at any given time. I collected this into a log file using a script scheduled to run every 10 seconds. Once I had a few hours of data, I began the process of getting my logs from a file on my computer to Kibana via Logstash and Elasticsearch.
Setting Up Managed Elasticsearch, Kibana, and Logstash
The first step was getting a managed instance of Elasticsearch and Kibana set up as a place to import the data. This was really simple using the Instaclustr console; all that was required was logging in and following the steps to create an instance. After a few minutes of provisioning I had a brand new Open Distro for Elasticsearch instance ready to be filled with data.
Instaclustr recommends switching on the Security Plugin for Elasticsearch Open Distro instances, so I followed this recommendation as well. I then needed to create a service account with the correct permissions to allow Logstash to push data to the instance. You can do this using the Elasticsearch REST API, but that can get confusing if you aren’t familiar with the API. Fortunately, you can use Kibana’s GUI and a pre-existing Logstash role as a template.
By duplicating the role and only giving it access to the indexes I wanted to work on, I was able to set up the Logstash service user, link the account to the role, and confirm that my changes were correct.
Logstash Basic Requirements
Now for the hard part: creating a Logstash configuration file which could interpret my log file and manipulate the data into the correct data points for my Elasticsearch index. The configuration file is the most important part of the Logstash application; without it Logstash won’t do anything. The basic setup of a configuration file is:
Input: Where is the data coming from? This can be a file, an API, or a service such as Kafka.
Filter: What do you want to do with the incoming data?
Output: The data that gets output, and where do you want to output it to?
I initially started with a really basic configuration file just to test my connection to the Elasticsearch instance. This was achieved using the generator input plugin for Logstash, no filters, and the data being output to both my terminal and Elasticsearch.
Moving to the Real Dataset
I then moved on to importing the log file with the ISS coordinates. The data came in line by line in JSON format, so I was able to use the JSON filter within Logstash to interpret the incoming data. However, the incoming fields didn’t exactly match what I needed in the Kibana coordinate map where I would visualize the data.
When experimenting with the map, I discovered that I needed to import my data in a way that could be interpreted as coordinates. The map required latitude and longitude as a single field and to be marked as a data type known as a geo_point. What I had was latitude and longitude separately in normal text fields.
Conveniently though, manipulating data fields is what Logstash is built for. Using the mutate plugins, I was able to convert and merge the two fields into a new data point: geolocation. So now I had my single data field, I had to tell Elasticsearch that the field was a geo_point. This required the addition of an Elasticsearch mapping through the Kibana developer console, so that when the geolocation field was imported into the index, the data was automatically marked as a geo_point.
# <code for creation of the template>
PUT _template/geotemplate
{
  "index_patterns": [
    "iss-*"
    ],
    "settings": { },
      "mappings": {
        "properties" : {
          "geoLocation" : {
            "type" : "geo_point"
          }
        }
      },
    "aliases": {
    }
}
I finished my filter with a time conversion to make the time more easily readable, and then a cleanup of the final output. It is worth noting that while getting my configuration file correct, I found it much easier to output my data to the terminal only using the stout output plugin so that I wasn’t cluttering up my Elasticsearch instance with messy data. My final configuration file can be seen below.
# <code for config file here>
input {
 file {
   path => ["/iss.log"]
   sincedb_path => "/dev/null"
   start_position => "beginning"
  }
}
filter {
  json {
    source => "message"
    target => "raw_json"
  }
  mutate {convert => ["[raw_json][iss_position][latitude]", "float"]}
  mutate {convert => ["[raw_json][iss_position][longitude]", "float"]}
  mutate {
    add_field => {
      "geoLocation" => "%{[raw_json][iss_position][latitude]},%{[raw_json][iss_position][longitude]}"
    }
  }
  mutate {
      add_field => {
          latitude => "%{[raw_json][iss_position][latitude]}"
      }
      add_field => {
          longitude => "%{[raw_json][iss_position][longitude]}"
      }
  }
  date {
    match => [ "[raw_json][timestamp]", "UNIX" ]
    target => "time"
  }
   mutate {
   remove_field => ["raw_json","message", "@timestamp", "path", "host", "@version"]
 }
}
output {
  elasticsearch {
      hosts => ["elasticsearch-host:port"]
      ssl => true
      ssl_certificate_verification => true
      cacert => "cluster-ca-certificate.pem"
      user => "username"
      password => "password"
      index => "iss_location"
      ilm_enabled => false
  }
}
When I was happy with my data at the output stage, it was time to add the credentials to push data to Elasticsearch. I ran Logstash again and the console happily informed me that I had pushed my data to the nodes. Success!
In Kibana I was able to add the index and then use the visualization tab to create my map. Once the map had rendered I could see the path that the ISS has taken over the globe for around a three hour period. Except, there was no map, just the path plotted on my screen.
As Instaclustr uses Open Distro for Elasticsearch, tile maps are switched off by default due to licensing restrictions. This is a similar hurdle faced by our tech evangelist Paul Brebner earlier in the year. After some help from our support team and a tilemap server offered by Stamen Design, I had maps switched on and finally, I was able to see the path of the ISS, mapped across the Earth over about a three hour period.
How cool!
Upon further research after finishing my initial tests, I realized that I didn’t even have to use a script to collect the location data for the ISS. Using the HTTP poller plugin I could have queried the ISS location API and just allowed it to run infinitely to plot the current location onto the map. This sort of adaptability is really the power of Logstash: the ability to put your data somewhere you can make it work for you.
The final result really only scratches the surface of the power of the ELK stack. There are so many ways that data can be input and output with Logstash and then visualized with Elasticsearch and Kibana. I’ve only used the most basic setup to get a grip on how the ELK stack works.
Importing and visualizing logs and events using Logstash, Elasticsearch, and Kibana is a great way to make more sense of your data. Want to try visualizing your data with Elasticsearch and Kibana? You can easily create your own with our support article and a free trial of Instaclustr’s Managed Elasticsearch. Or you can have a chat with our team about your needs and we’ll be happy to help with a solution that fits you.