Connecting Logstash to Elasticsearch
| For Legacy Support Purposes Only |
|---|
Contents
- Introduction
- Logstash Use Case
- Security Plugin Configuration
- Logstash Installation and Configuration
- Adding Logstash Data to Kibana
- Troubleshooting
- Example Docker Installation
Introduction
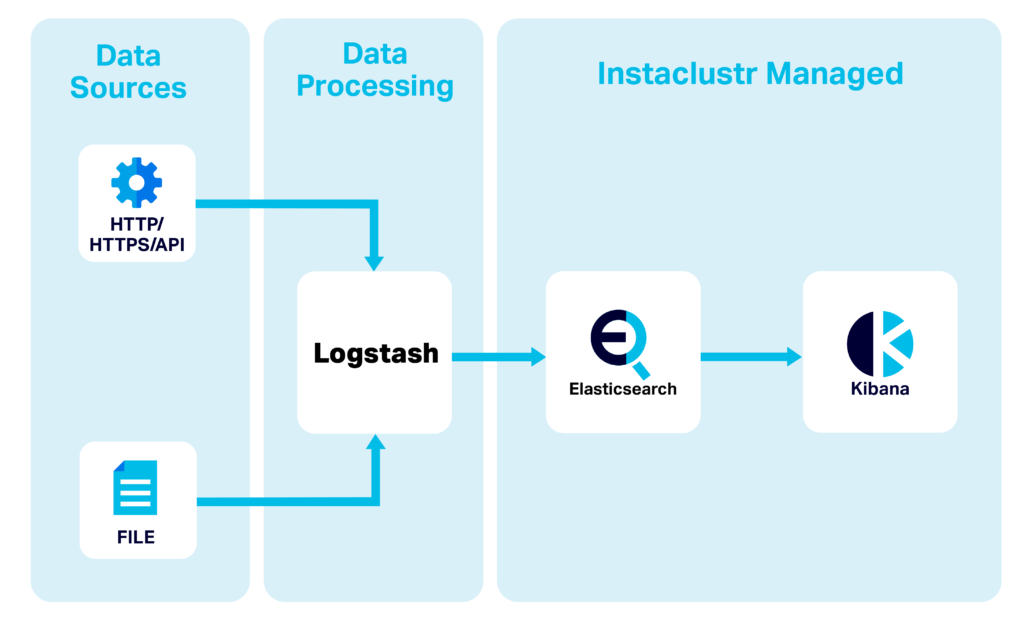
Logstash is an open source, server-side data processing pipeline that allows for the collection and transformation of data on the fly. Logstash supports a range of input sources, these range from HTTP to s3 bucket events.
Logstash is commonly used as an input pipeline for Elasticsearch as it allows for on the fly data transformation. These transformations can be applied through various filter plugins.
There are two different versions of Logstash. Logstash OSS is open source under the Apache 2.0 Licence, and the other has Elastic proprietary extensions under a different license. Instaclustr recommends that Logstash OSS is installed and used with our Managed Elasticsearch offering. This document details the minimum requirements to connect Logstash to an Instaclustr Managed Elasticsearch instance and includes an example Docker setup. However, your installation may vary and this document should only be used as a guide. Details on how to set up Logstash OSS for your use case should be followed from the Logstash Github which is maintained by Elastic.
Logstash Use Case
Security Plugin Configuration
Instaclustr makes use of the Open Distro Security Plugin, allowing for node to node encryption and role based access control. It is highly recommended that this plugin is enabled and utilized where possible. To enable the security plugin on a new cluster:
Ensure the Security Plugin checkbox is enabled when configuring a new Elasticsearch instance under Cluster Setup. Please note that this option is not available on developer tier nodes.
Once you have enabled the security plugin, you must create an account for Logstash to use for connections to the cluster. To create the account:
First, get your connection credentials. Under the “Connection Info” section of the console you will be met with the default credentials for your cluster. These credentials will be required to add a Logstash user account to the security plugin.
In addition to the above credentials, if you are intending to use the Elasticsearch API to create a Logstash user ID and password you will need to obtain the .pem file from the Instaclustr Console. This is needed to ensure secure communication to and from your cluster. Download the cluster certificates from the Connection Info page of the Instaclustr console.
As outlined in the Security Access Control support article, follow the steps for creating a new user, ensuring to give only necessary permissions needed for Logstash to operate. These permissions are as follows:
- Cluster Permissions:
- cluster_monitor
- cluster_composite_ops
- indices:admin/template/get
- indices:admin/template/put
- cluster:admin/ingest/pipeline/put
- cluster:admin/ingest/pipeline/get
- Index Permissions:
- < your index pattern name >
- write
- create
- delete
- create_index
Logstash Installation and Configuration
Logstash can be installed using a package manager on macOS and Linux, or through a Docker container. More details can be found on the Logstash installation page. Once installed, you will need to create a configuration file that can be placed in the /pipeline/ directory of your Logstash installation. This file can be called any name but must end with a .conf file extension.
Logstash configuration file is made up of three parts, where plugins (included as part of the Logstash installation) are used in each part:
Input—Where is the data coming from. This can be a file, an API or a service such as Kafka.
Filter—What do you want to do with the incoming data.
Output—The data that gets output and where do you want to output it to?
For a basic configuration file for a connection to an Instaclustr Managed Elasticsearch instance your configuration will need at a minimum:
|
1 2 3 4 5 6 7 8 9 10 11 12 13 14 15 16 17 18 19 20 21 22 23 24 25 26 27 |
input { # Required - An input plugin to pass some data to Elasticsearch - file or API } filter { # Can be empty } output { # All of the following connection details elasticsearch { # Your node IP addresses from the Instaclustr Console hosts => ["https://<NodeIP1>:9200","https://<NodeIP2>:9200","https://<NodeIP3>:9200"] # SSL enabled ssl => true ssl_certificate_verification => true # Path to your Cluster Certificate .pem downloaded earlier cacert => "<Path to: cluster-ca-certificate.pem>" # The Logstash Username and Password created Earlier user => "<LogstashUserName>" password => "<LogstashPassword>" # The name of the Index index => "<Intended Name of Your Index>" ilm_enabled => false } |
Once you have created the configuration file, place the .conf file in the /pipeline/ directory and start Logstash based on your installation method. If Logstash is started directly, you will be able to see success or error messages directly in the terminal. If Logstash is started as a system process, you should check the logs of your Logstash installation for more details.
Adding Logstash Data to Kibana
- Navigate to your Kibana instance and login using the credentials from the Instaclustr Connection Info Page.
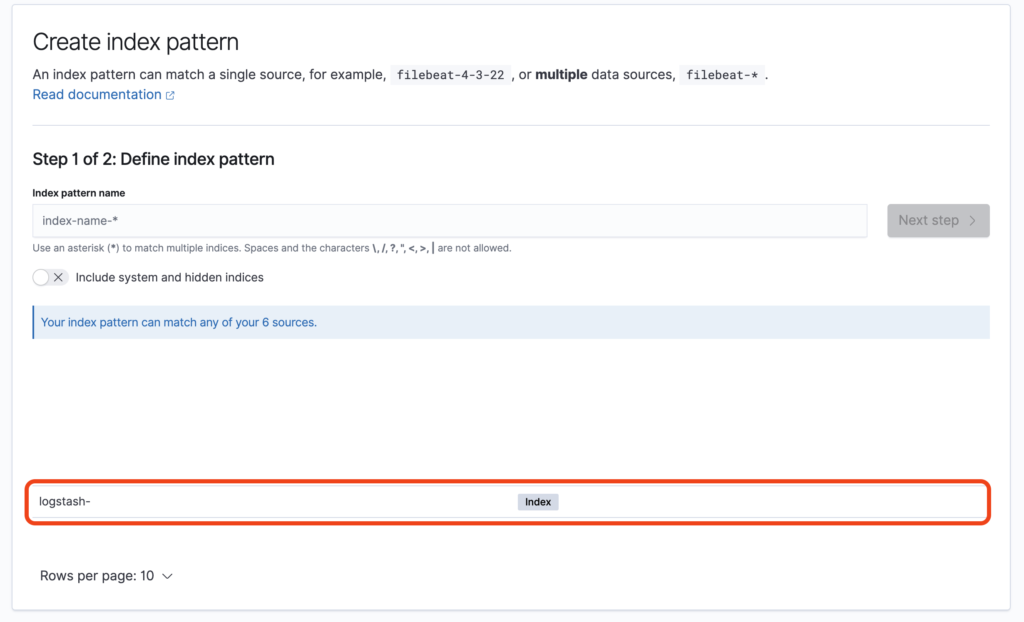
- Head to Management > Index Patterns > Create Index Pattern
- If successful, you should see your index as defined in the Elasticsearch Output plugin above.
- From here, manipulating your data is identical to using any other data source in Kibana.
Troubleshooting
| Problem Observed | Possible Reason | Solution |
|---|---|---|
| No Config Files Found In Path | Logstash requires all configuration files to be placed within the /pipeline directory of the application. | Utilize docker copy or docker volumes when creating the docker image to move the desired config file to its correct destination. |
| Dead ES Instance | Client IP address is not added as an exception within the dashboard. | Add client IP to firewall exceptions within the Instaclustr Dashboard. |
| Error 401 | Authentication failed due to incorrect SSL/credentials configuration. | Check to make sure SSL certificate is supplied and correct credentials are entered into configuration file. |
Note: Utilizing proprietary extensions within the open source Logstash version can lead to miscellaneous syntax errors. Ensuring ilm_enabled is set to false should help to rectify these issues. Syntax errors may also arise if anything other than a configuration file is placed within the /pipeline directory.
Example Docker Installation
Pull the desired Docker image from the Logstash Repo.
|
1 |
sudo docker pull docker.elastic.co/logstash/logstash-oss:7.9.3 |
Below is a sample configuration file designed to stash a .csv to Elasticsearch. For connection to Elasticsearch you will require the credentials for the logstash user you created in the security plugin configuration section as well as the IP addresses of your Elasticsearch data nodes.
Note: All paths are required to be absolute paths directly to a given file.
Create your configuration file and store it in a location that can be accessed by docker. The Elasticsearch output for your configuration file should be as follows:
|
1 2 3 4 5 6 7 8 9 10 11 12 13 14 15 16 17 18 19 20 21 22 23 24 25 |
input { file { path => "/usr/share/logstash/test.csv" start_position => "beginning" } } filter { csv { separator => "," columns => [ "record_id", "duration", "src_mac", "dest_mac" ] } } output { elasticsearch { hosts => ["https://<NodeIP1>:9200","https://<NodeIP2>:9200","https://<NodeIP3>:9200"] ssl => true ssl_certificate_verification => true cacert => "<Path to: cluster-ca-certificate.pem>" user => "<LogstashUserName>" password => "<LogstashPassword>" index => "testdata" ilm_enabled => false } stdout {} } |
The above logstash.conf file will need to be placed in the /pipeline directory of the docker container. This can be done using Docker volumes within the below docker compose file or using docker copy once your container has been established.
|
1 2 3 4 5 6 7 8 |
version: '3' services: logstash: image: docker.elastic.co/logstash/logstash-oss:7.9.3 container_name: logstash volumes: - ./logstash.conf:/usr/share/logstash/pipeline/logstash.conf \ - ./cluster-ca-certificate.pem:/usr/share/logstash/cluster-ca-certificate.pem |
Run the configured Docker container using the following command:
|
1 |
sudo docker-compose up |
Once the container is started, as outlined within the logstash.conf file from step 2, Logstash will now attempt to pass the logs as configured in the Logstash configuration file from the path defined in the docker-compose config file to your Elasticsearch cluster.