In Part 1 of this blog, we built a simple real-time data processing pipeline to take streaming tidal data from NOAA stations using Kafka connectors, and graph them in Elasticsearch and Kibana. We also tried viewing the data on a Kibana map but ran into a problem! In Part 2 we add the missing geo_points to the data using an Elasticsearch Ingest Pipeline, and successfully visualize them on a Kibana map. Finally, we discover what can go wrong with the pipeline and investigate some solutions, and finish up with some possible extensions and further resources.
1. Mapping Data in Kibana
Given that the tidal data sensors are at given geospatial locations, and the lat/lon data is in the JSON already, it would be nice to visualize the data on a Kibana map. But, at first attempt, nothing appeared on the map.
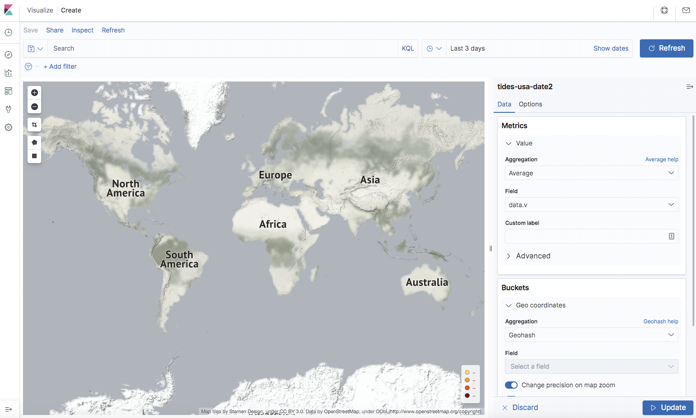
Looking at the Elasticsearch index data more closely it turns out that there are no geo_points (which I first came across in this blog) in the data due to the default mapping, and Elasticsearch doesn’t recognize separate lat/lon fields as geo_points. I tried multiple solutions to fix this.
Plan A was to use the Kafka Connect Single Message Transforms (SMTs, KIP-66) in the REST source connector to add the new geo_point location field. I tried using the insertField transform (there’s an example here, and a good overview of other SMT use cases here), but concluded that either the REST source connector I was using doesn’t support SMTs, or that there was just something about the configuration I couldn’t get right. Oh well, on to Plan B.
Plan B was to write some custom KSQL for the Elasticsearch sink connector to create a new geo_point field from the existing separate lat/lon fields. However, it turns out that the connector only supports a connector specific subset of KSQL, so this approach was also unsuccessful.
2. Adding an Elasticsearch Ingest Pipeline for Location Data
Luckily there was a Plan C. A nice feature of Elasticsearch is the ability to add an Ingest Pipeline to pre-process documents before they are indexed. The three mapping steps needed to do this are as follows (requiring reindexing again!):
- Add geo-point field to index mapping
- Create Elasticsearch ingest pipeline
- Add as default ingest pipeline to index
Here’s the “curl” command to add a new “location” filed with a geo_point data type to the mapping and index. Note that geo_points can have a variety of formats—we’ll just use a simple String “lat, lon” format:
curl -u elasticName:elasticPassword ”elasticURL:9201/tides-index"  -X PUT -H 'Content-Type: application/json' -d'
{
"mappings" : {
  "properties" : {
     "data" : {
        "properties" : {
             "t" : { "type" : "date",
                     "format" : "yyyy-MM-dd HH:mm"
             },
             "v" : { "type" : "double" },
             "f" : { "type" : "text" },
             "q" : { "type" : "text" },
             "s" : { "type" : "text" }
             }
       },
       "metadata" : {
          "properties" : {
             "id" : { "type" : "text" },
             "lat" : { "type" : "text" },
             "long" : { "type" : "text" },
            "location" : { "type" : "geo_point" },
             "name" : { "type" : ”keyword" } }}}}         }'
Next, create a new ingest pipeline to construct the new location geo_point string from existing lat/lon fields:
curl -u elasticName:elasticPassword ”elasticURL:9201/ _ingest/pipeline/locationPipe"  -X PUT -H 'Content-Type: application/json' -d'
{
  "description" : ”construct geo_point String field",
  "processors" : [
    {
      "set" : {
        "field": "metadata.location",
        "value": "{{metadata.lat}},{{metadata.lon}}"
      }
    }
  ]
}
'
And finally add locationPipe as the default pipeline to the index. This means that you don’t have to explicitly specific they pipeline as part of the index URL (which I was unable to do in the Elasticsearch sink connector configuration):
curl -u elasticName:elasticPassword ”elasticURL:9201/tides-index/_settings?pretty"  -X PUT -H 'Content-Type: application/json' -d'
{
  "index" : {
    "default_pipeline" : ”locationPipe"
  }
}
'
To debug these steps I found that ingest simulate was really useful.
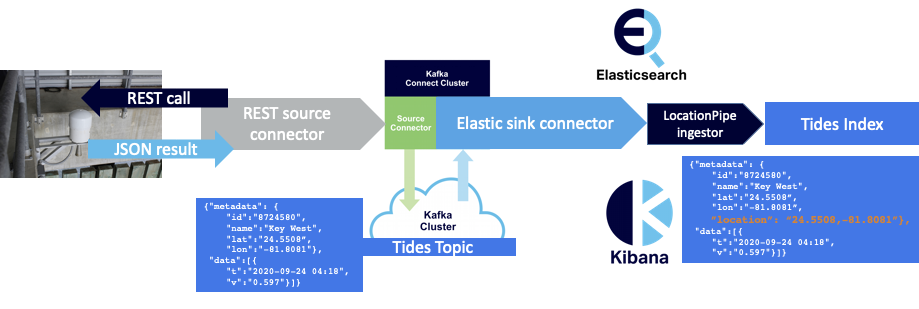
Now we have a pipeline transforming the raw data and adding geo_point location data in Elasticsearch:
3. Map Visualization in Kibana
As we can reuse the existing index pattern, it now only takes two steps to visualize the data on a Kibana map:
- Create Visualization
- Visualizations -> Create visualization -> New Coordinate Map -> Select index patterns -> Visualization with default map
- Configure Graph Settings (to display data correctly)
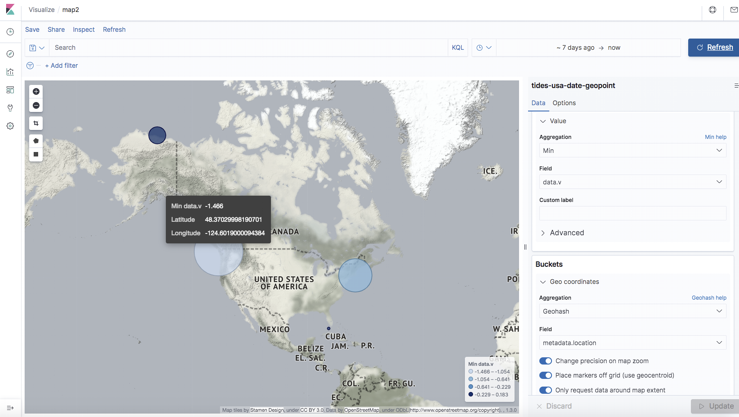
- Select Metrics -> Aggregation (min) -> Field -> data.v -> Buckets -> Geo coordinates -> Geohash -> Field -> metadata.location
The Kibana Map shows sensor locations and selected values (min values in this case) over a week (the largest circle is Neah Bay).
You can even add your own map layers as Web Map Service (WMS) layers. Here’s a particularly USA-centric view of the world (the country between the USA and Alaska is missing), using the USGSNAIPPlus Map Server with this URL and lots of layers:
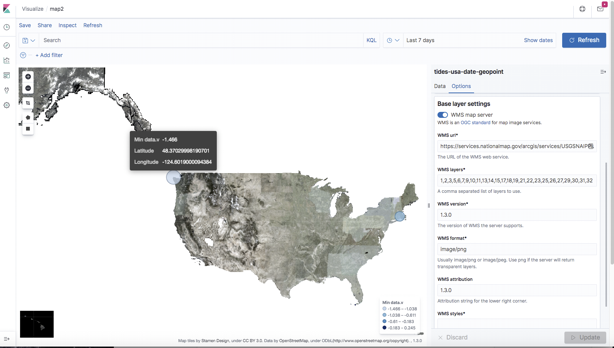
Note that because Instaclustr runs Open Distro for Elasticsearch and Kibana, the Elasticsearch Map Service is not included, which normally provides the base map tiles. And you need base map tiles for any custom WMS map server layers (added in the Kibana GUI) to work. However, Instaclustr can easily add a base map service of your choice to your managed Kibana upon request. For example, for this demo, we used: here (© Stamen Design, under a Creative Commons Attribution license).
4. What Can Go Wrong?
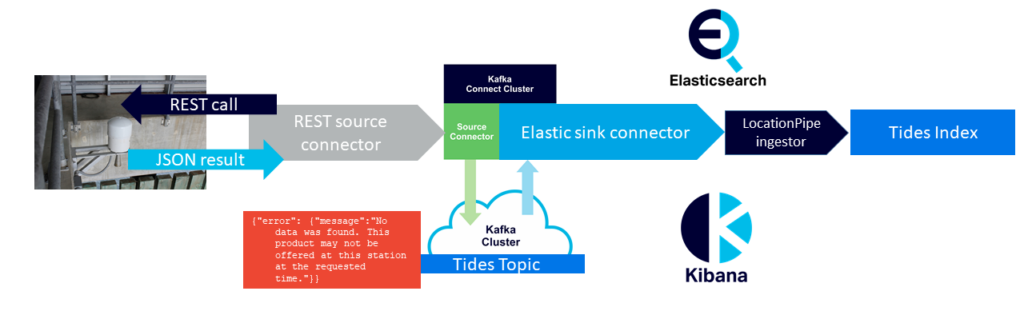
The pipeline appears to be working, but what can go wrong? After running successfully for a few days I found that the Elasticsearch sink connector tasks had all FAILED. Initially, I incorrectly thought that the Kafka Connect cluster should have restarted them, but the protocol is that FAILED tasks are assumed to have a permanent error, so are not automatically restarted (unlike tasks with other error states which are automatically restarted). On the input side of my pipeline, the REST source connectors and tasks were all running correctly, and data was appearing in the Kafka tides-topic. However, upon closer inspection of the actual Kafka records it became clear that some of the REST API calls were returning JSON data in a different format, in fact, with an error message instead of the expected format/data—e.g.
{"error": {"message":"No data was found. This product may not be offered at this station at the requested time."}}
And in a few cases, JSON wasn’t even being returned, just HTTP with a more generic message (“502 Bad Gateway”). Apparently the REST sink connector doesn’t have any way of handling these two cases as exceptions, and just sends the message to the Kafka topic to be processed by the rest of the pipeline.
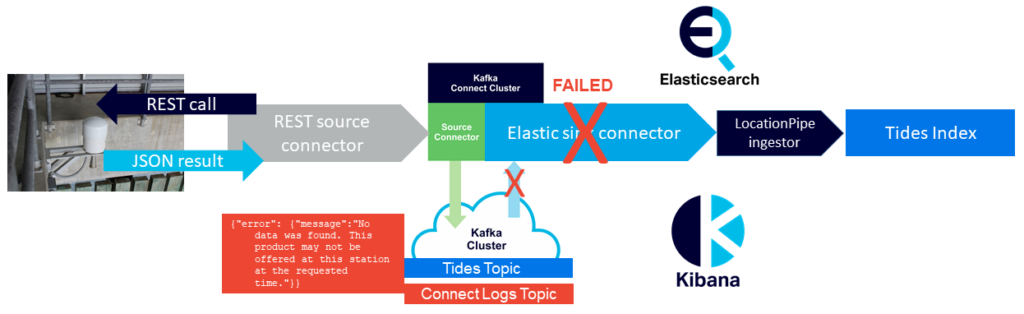
The Elasticsearch sink connector then tries to read the “error” messages but can’t (in one case the JSON format is incorrect for the Elasticsearch index mapping, and in the other case there isn’t even any JSON to parse), so it fails to the FAILED state, rather than doing something more robust such as skipping the record and trying again with the next record. Luckily, using Instaclustr Managed Kafka Connect, the connector exceptions are logged to a Kafka Connect logs topic so I was able to see what was going on.
Just to get things flowing again ready for the ApacheCon talk deadline I used a quick workaround, which was to monitor and restart failed connectors.
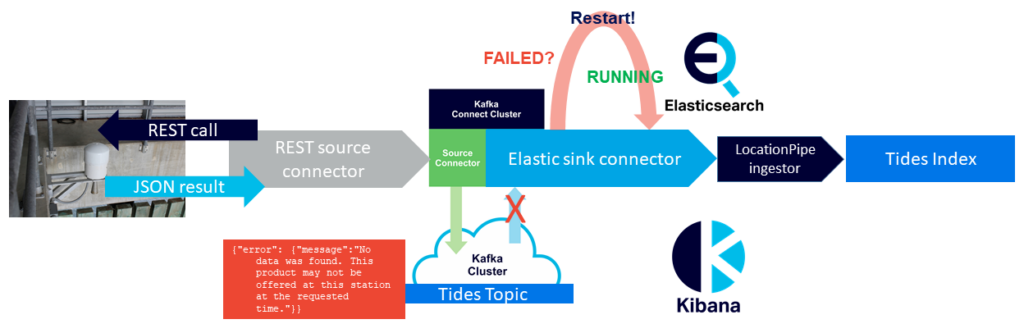
This magically worked for about a week but for some reason stopped working—restarted connectors failed immediately with no records moved into Elasticsearch. So a more robust solution was needed.
The problem of more robust error handling for Kafka connectors has already been recognized, and is addressed in KIP-298 “Error handling in Connect”. The intention is to “allow users to configure how failures should be handled during all phases of processing records.” Here’s a good blog on “error tolerance in kafka connect”. I tried configuring the Elasticsearch sink connector with a few exception handling options, including setting “error.tolerance” to “all”, and setting a dead letter queue. In theory this would have resulted in the problematic records just being skipped and the rest being processed correctly without the connector failing as follows:
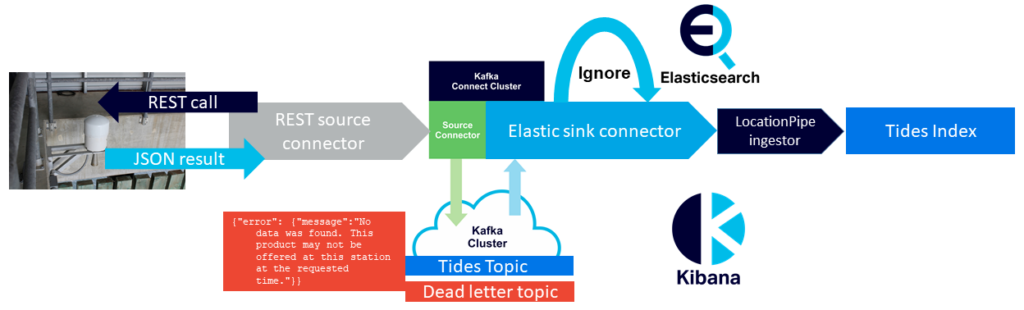
Unfortunately, it is likely that the Elasticsearch sink connector I was using doesn’t support KIP-298. Just to check I tried an alternative Elasticsearch sink connector. After a few complications importing in into the Instaclustr Kafka Connect cluster (this connector had multiple JAR files so I had to either create a S3 directory for them all or create a single “Uber” JAR file—both approaches work—and it was missing this guava JAR file), it worked as expected with the added exception handling configuration, and successfully skipped both types of error records (JSON and HTML) and continued reliably inserting all the delayed and subsequent records into Elasticsearch.
Nonetheless, other types of exceptions could still occur so it’s important to have an approach to monitor the Kafka connectors and tasks.
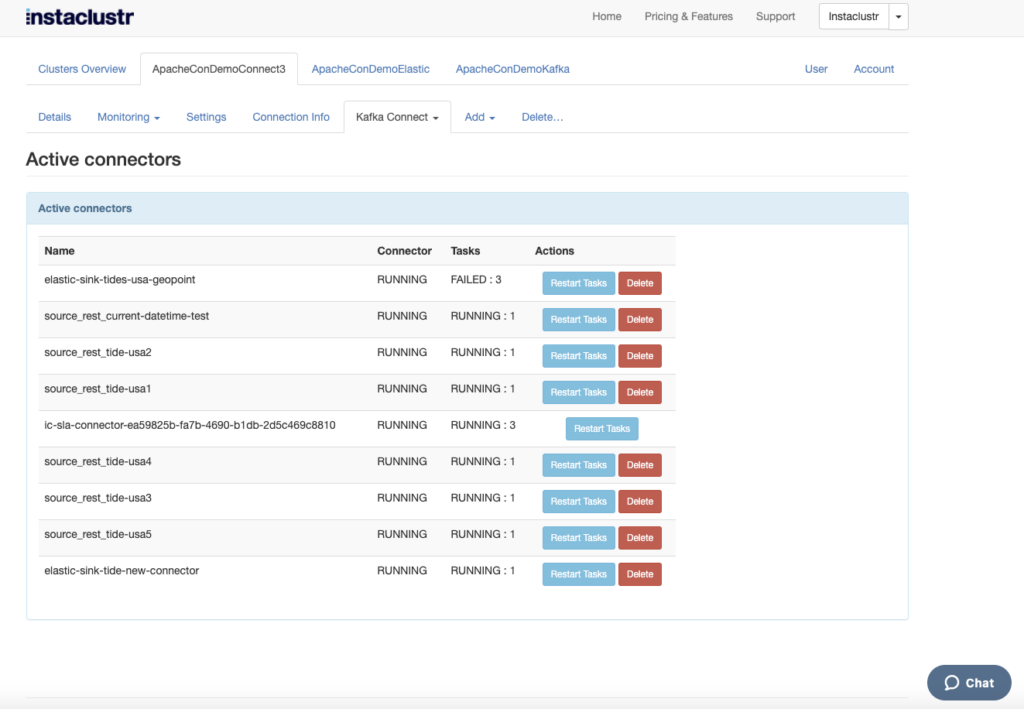
A nice feature in the Instaclustr Managed Kafka Connect console is the “Active Connectors” view, which lists all the running connectors, along with the number of tasks and their state. You can also restart tasks or delete the connectors.
For example, this screenshot shows all of my 5 source rest connectors and tasks running, my original Elastic sink connector running but with 3 failed tasks (top of the list), and the new elastic sink connector (with improved exception handling) running with 1 running task (bottom of the list).
5. Extensions?
I wondered if the pipeline could be easily expanded to work with all the available NOAA stations and metrics? The first problem is finding all of the station IDs. It turns out that there is a URL for this—this URL returns all of the 297 valid Station IDs. And this URL builds URLs! But there are 18 products (different metrics) available for most stations. Given that the current REST source connector only works for a single URL (Station ID and metric), you would need 297 x 18 = 5346 connector configurations and eventually running connectors and tasks for all the permutations. The only sensible way of doing this would be programmatically. The other alternative is if the REST source connector allowed for configurations with multiple URLs somehow. With multiple metrics, so as to be interpretable by the time the data arrives at Elasticsearch, you would also need to add extra meta-data fields for the metric name, unit, datum, etc., or possibly use multiple Elasticsearch indices.
This use case was a relatively simple integration/transformation pipeline example. There are obviously more complex use cases with more demanding requirements, more typical of functionality available in traditional Enterprise Service Buses (ESBs) and Message Oriented Middleware (MOMs). For example, schema validation, more complex transformations (e.g. aggregations, filtering, data format, or protocol conversion, etc.), and content-based delivery. There are a couple of native Kafka solutions to these such as schema validation with Avro and the Kafka Schema Registry (provided as an add-on for Instaclustr managed Kafka), or custom streams processors to handle transformations and exceptions (both suggested by this blog).
Another approach is to use a complementary Apache technology. For example, Apache Camel is a potential candidate: “Camel is an open source integration framework that empowers you to quickly and easily integrate various systems consuming or producing data”. And it comes with a whopping 346 Camel-X-Kafka connectors!
6. Further Information
I had a feeling of déjà vu doing this project, and sure enough, I found blogs I wrote two years ago on Kafka Connect architecture and connecting Kafka to Cassandra with Kafka Connect. There are also some recent blogs on Elasticsearch if you want to get up to speed with that.
You may also experience some déjà vu if you watch Instaclustr’s sponsored ApacheCon @Home 2020 keynote talk which coincidentally has a “Tidal” theme: A Rising Tide Lifts All Boats: Working With Contributors of All Sizes, by Anil Inamdar, Head of US Consulting and Delivery, Instaclustr.
I gave this talk “Massively Scalable Real-time Geospatial Anomaly Detection with Apache Kafka and Cassandra” in the ApacheCon @Home 2020 Geospatial Track.
Mussa’s Big Data Workshop code is available here (Docker based).
You can build this demo pipeline with (1) the example configuration files and connectors above, and (2) the Instaclustr Managed Platform! The trial is available for free here.
Follow the Pipeline Series
- Part 1: Building a Real-Time Tide Data Processing Pipeline: Using Apache Kafka, Kafka Connect, Elasticsearch, and Kibana
- Part 2: Building a Real-Time Tide Data Processing Pipeline: Using Apache Kafka, Kafka Connect, Elasticsearch, and Kibana
- Part 3: Getting to Know Apache Camel Kafka Connectors
- Part 4: Monitoring Kafka Connect Pipeline Metrics with Prometheus
- Part 5: Scaling Kafka Connect Streaming Data Processing
- Part 6: Streaming JSON Data Into PostgreSQL Using Open Source Kafka Sink Connectors
- Part 7: Using Apache Superset to Visualize PostgreSQL JSON Data
- Part 8: Kafka Connect Elasticsearch vs. PostgreSQL Pipelines: Initial Performance Results
- Part 9: Kafka Connect and Elasticsearch vs. PostgreSQL Pipelines: Final Performance Results
- Part 10: Comparison of Apache Kafka Connect, Plus Elasticsearch/Kibana vs. PostgreSQL/Apache Superset Pipelines