Modern event-based/streaming distributed systems embrace the idea that change is inevitable, and actually desirable! Without being change-aware, systems are inflexible, can’t evolve or react, and are simply incapable of keeping up with real-time, real-world data. In a previous 2-part blog series (Part 1, Part 2) we discovered how to capture change data from a Apache Cassandra® database and produce real-time event streams in Apache Kafka® using the Debezium Cassandra Connector.
But how can we speed up an “Elephant” (PostgreSQL®) to be as fast as a “Cheetah” (Kafka)?

Cheetahs are the fastest land animal (top speed 120km/hr, they can accelerate from 0 to 100km/hr in 3 seconds), 3 times faster than elephants (40km/hr)
(Source: Shutterstock)
1. The Debezium PostgreSQL Connector
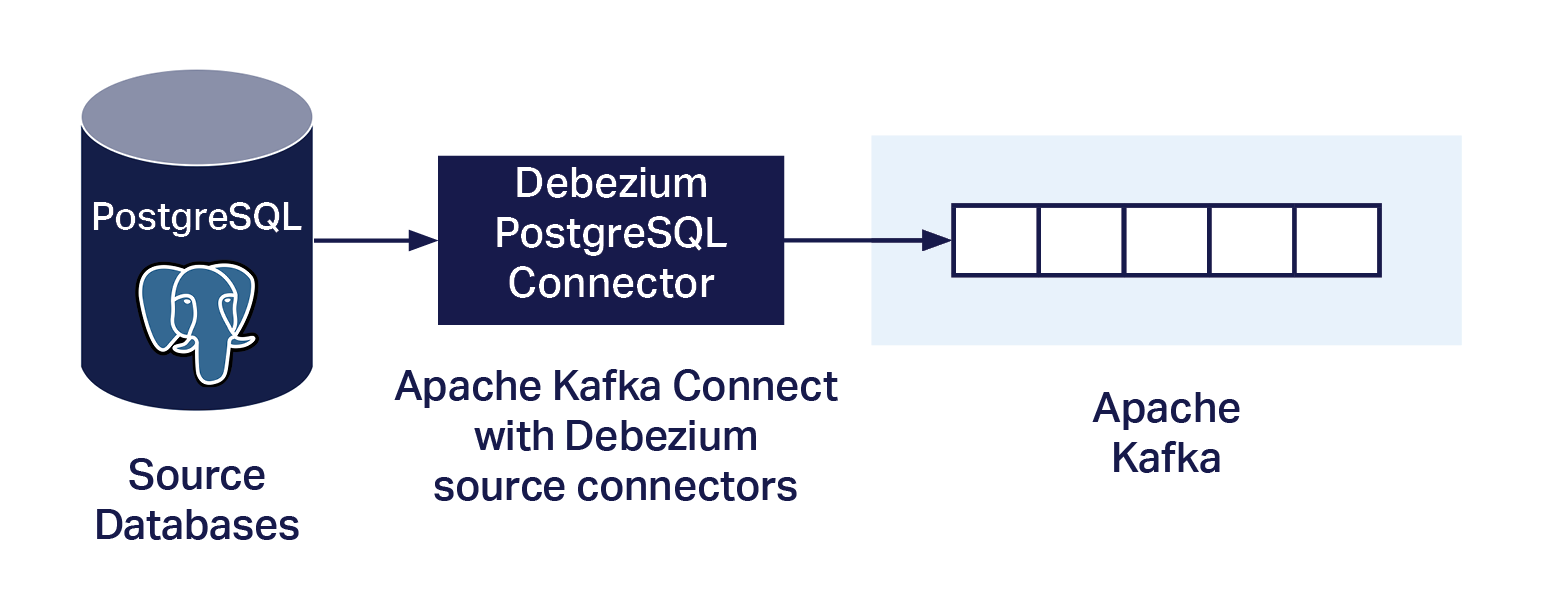
Similar to the Debezium Cassandra Connector (Blog Part 1, Part 2), the Debezium PostgreSQL Connector also captures row-level database changes and streams them to Kafka via Kafka Connect. One main difference, however, is that this connector actually runs as a Kafka Source Connector. So how does it avoid having to run custom code on the PostgreSQL server? The documentation says:
“As of PostgreSQL 10+, there is a logical replication stream mode, called pgoutput that is natively supported by PostgreSQL. This means that a Debezium PostgreSQL connector can consume that replication stream without the need for additional plug-ins.”
This means that the connector can just run as a PostgreSQL streaming replication client. To run the connector you have to get it, deploy it on your Kafka Connect environment, configure it, set up PostgreSQL, and then run it as follows.
1.1. Download the Debezium PostgreSQL Connector
The connector download is available here.
1.2. Deploy the Debezium PostgreSQL Connector
I’ll be using the Instaclustr Managed Kafka Connect service. Custom connectors can be used with this service, but they must first be loaded to an AWS S3 bucket and then synchronized from the Instaclustr management console (I created a folder in my S3 bucket called “debezium-connector-postgres” and uploaded all the jars from the original download to it).
Assuming that all worked you will see a new connector with the name “io.debezium.connector.postgresql.PostgresConnector” in the list of available connectors on the console.
1.3. Configure PostgreSQL
Here are the required PostgreSQL server settings:
- Check wal_level and if it’s not logical, set it to logical (this requires a server restart and for a managed service may require assistance)
- No extra plugins are required for PostgreSQL > 10+, as pgoutput is used (but you do have to override the default plugin.name in the connector configuration, see below).
- Configure user permissions
a. The instructions say to create a Debezium user that has the minimum required privileges (REPLICATION and LOGIN permissions),
b. and to use pgoutput you also need other permissions.
Note that to set these you will need PostgreSQL administrative permissions, so if you are using a managed service you may have to enlist the help of your service provider to make the necessary changes.
1.4. Configure and Run the Debezium PostgreSQL Connector
To run the connector, here’s an example connector configuration. Note that the default value of plugin.name is not pgoutput, so you have to specify it explicitly (you must supply values for the Kafka Connect cluster IP, username, and password, and the PostgreSQL database IP, username, and password):
|
1 2 3 4 5 6 7 8 9 10 11 12 13 |
curl https://KafkaConnectIP:8083/connectors -X POST -H 'Content-Type: application/json' -k -u kc_username:kc_password -d '{ "name": "debezium-test1", "config": { "connector.class": "io.debezium.connector.postgresql.PostgresConnector", "database.hostname": "PG_IP", "database.port": "5432", "database.user": "pg_username", "database.password": "pg_password", "database.dbname" : "postgres", "database.server.name": "test1", "plugin.name": "pgoutput" } } |
If that worked correctly, then you will see a single running task for “debezium-test1” in the Instaclustr Kafka Connect console. Note that the default, and also the only allowed value for “tasks.max”, is exactly 1, so you don’t need to set it explicitly.
1.5. Debezium PostgreSQL Connector Table-Topic Mappings
Strangely, you may notice that there are also no table names or topics specified in the configuration. This is because, by default, the connector captures changes for all non-system tables, and writes events for a single table to a single Kafka topic.
By default, the Kafka topic name is “serverName.schemaName.tableName” where:
- serverName is the logical name of the connector as specified with the database.server.name connector configuration property (which must be unique)
- schemaName is the name of the database schema
- tableName is the name of the database table
There are a bunch of configuration options for including or excluding (only use one for each object) schemas, tables, and columns.
I couldn’t find any PostgreSQL connector-specific configuration options to change the default table-topic mapping; however, this is because you need to use generic Debezium Single Message Transforms, SMTs for custom Topic Routing.
2. Exploring the Debezium PostgreSQL Connector Change Data Events

A terrifying “Giraffosaurus”! (or a T-Raffe?)
(Source: Shutterstock)
If everything is working correctly, then you will see some change data events on a Kafka topic. For example, for a table called “test1”, the topic name will be something like “test1.public.test1”. The table has 3 integer columns (id, v1, v2), id is the primary key.
So what does the Kafka data look like? On the first encounter, it looks slightly terrifying—what have the simple database CRUD operations metamorphosed into? This is the event for an insert:
|
1 |
Struct{after=Struct{id=1,v1=2,v2=3},source=Struct{version=1.6.1.Final,connector=postgresql,name=test1,ts_ms=1632457564326,db=postgres,sequence=["1073751912","1073751912"],schema=public,table=test1,txId=612,lsn=1073751968},op=c,ts_ms=1632457564351} |
For an update we get this event:
|
1 |
Struct{after=Struct{id=1,v1=1000,v2=3},source=Struct{version=1.6.1.Final,connector=postgresql,name=test1,ts_ms=1632457801633,db=postgres,sequence=["1140858536","1140858536"],schema=public,table=test1,txId=627,lsn=1140858592},op=u,ts_ms=1632457801973} |
And after a delete we get this event:
|
1 2 |
Struct{before=Struct{id=1},source=Struct{version=1.6.1.Final,connector=postgresql,name=test1,ts_ms=1632457866810,db=postgres,sequence=["1140858720","1140858720"],schema=public,table=test1,txId=628,lsn=1140858776},op=d,ts_ms=1632457867187} Null |
What do we notice about these events? As expected, the operation type (c, u, d) corresponds to the PostgreSQL operation semantics (create—for an insert, update, delete). For create and update there is an “after” record which shows the id and values after the transaction was committed. For delete, there’s a “before” record which shows the id only and a Null for the “after” values. There are also lots of meta-data including time, database-specific sequence and “lsn” information, and a Transaction Id. Multiple events can share a Transaction Id if they occurred in the same transaction context. What’s the Transaction Id useful for? Transaction meta-data corresponding to the txId can be written to topics with a “.transaction” postfix (“provide.transaction.metadata” is false by default).
I found this data initially surprising, as, from my initial reading of the documentation, I was expecting slightly more readable (JSON) change event data including key and value schemas and payloads. But the “fine print” says:
“How you configure the Kafka Connect converter that you choose to use in your application determines the representation of these four parts in change events.”
So obviously I was missing some configuration. After a bit of hunting I discovered the following extra configuration settings: “key/value.converter” and “key/value.schemas.enable” are needed to include the key and value Schemas in the data, and to use JSON format:
|
1 |
"value.converter": "org.apache.kafka.connect.json.JsonConverter" |
|
1 |
"value.converter.schemas.enable": "true" |
|
1 |
"key.converter": "org.apache.kafka.connect.json.JsonConverter" |
|
1 |
"key.converter.schemas.enable": "true" |
After changing the configuration and restarting the connector the data produced is much more verbose, but is at least now in JSON as expected. For example, for an insert operation we get this long event:
|
1 |
{"schema":{"type":"struct","fields":[{"type":"struct","fields":[{"type":"int32","optional":false,"field":"id"},{"type":"int32","optional":true,"field":"v1"},{"type":"int32","optional":true,"field":"v2"}],"optional":true,"name":"test1.public.test1.Value","field":"before"},{"type":"struct","fields":[{"type":"int32","optional":false,"field":"id"},{"type":"int32","optional":true,"field":"v1"},{"type":"int32","optional":true,"field":"v2"}],"optional":true,"name":"test1.public.test1.Value","field":"after"},{"type":"struct","fields":[{"type":"string","optional":false,"field":"version"},{"type":"string","optional":false,"field":"connector"},{"type":"string","optional":false,"field":"name"},{"type":"int64","optional":false,"field":"ts_ms"},{"type":"string","optional":true,"name":"io.debezium.data.Enum","version":1,"parameters":{"allowed":"true,last,false"},"default":"false","field":"snapshot"},{"type":"string","optional":false,"field":"db"},{"type":"string","optional":true,"field":"sequence"},{"type":"string","optional":false,"field":"schema"},{"type":"string","optional":false,"field":"table"},{"type":"int64","optional":true,"field":"txId"},{"type":"int64","optional":true,"field":"lsn"},{"type":"int64","optional":true,"field":"xmin"}],"optional":false,"name":"io.debezium.connector.postgresql.Source","field":"source"},{"type":"string","optional":false,"field":"op"},{"type":"int64","optional":true,"field":"ts_ms"},{"type":"struct","fields":[{"type":"string","optional":false,"field":"id"},{"type":"int64","optional":false,"field":"total_order"},{"type":"int64","optional":false,"field":"data_collection_order"}],"optional":true,"field":"transaction"}],"optional":false,"name":"test1.public.test1.Envelope"},"payload":{"before":null,"after":{"id":10,"v1":10,"v2":10},"source":{"version":"1.6.1.Final","connector":"postgresql","name":"test1","ts_ms":1632717503331,"snapshot":"false","db":"postgres","sequence":"[\"1946172256\",\"1946172256\"]","schema":"public","table":"test1","txId":1512,"lsn":59122909632,"xmin":null},"op":"c","ts_ms":1632717503781,"transaction":null}} |
Having the explicit Schema meta-data makes things pretty complex, so let’s turn it off with:
|
1 |
"value.converter.schemas.enable": "false" |
|
1 |
"key.converter.schemas.enable": "false" |
This gives a more readable payload (highlighted above, but note that “payload” no longer appears) only record:
|
1 |
{"before":null,"after":{"id":10,"v1":10,"v2":10},"source":{"version":"1.6.1.Final","connector":"postgresql","name":"test1","ts_ms":1632717503331,"snapshot":"false","db":"postgres","sequence":"[\"1946172256\",\"1946172256\"]","schema":"public","table":"test1","txId":1512,"lsn":59122909632,"xmin":null},"op":"c","ts_ms":1632717503781,"transaction":null} |
Note that we now have a “before” field as well as an “after” field for create operations.
Also note that with no explicit Schema, the Kafka sink connector needs to be able to understand the payload without extra context, or alternatively you need to use and configure a Schema Registry. Here are the instructions for using a Kafka Schema Registry with the Instaclustr managed Kafka service. Changes to the Debezium source connector configuration will need to include:
|
1 |
"value.converter": "io.confluent.connect.avro.AvroConverter" |
|
1 |
"value.converter.schema.registry.url": "https://schema-registry:8081" |
I was curious to see what would happen after a table truncate operation, but surprised to find that no events were produced at all. Surely a truncate is semantically equivalent to multiple delete operations? It turns out that truncate events are turned off by default (“truncate.handling.mode” : “skip”—not “bytes” as incorrectly documented; “include” to turn them on).
The other consideration is that Kafka the sink connector will need to be able to process truncate events sensibly, which may be application and/or sink system specific (e.g. for Elasticsearch it could make sense to delete an entire index in response to a truncate event. But for steams processing applications it’s not obvious what a sensible response would be. Mind you, the same problem occurs for deletes and updates as well perhaps).
3. Debezium PostgreSQL Connector Throughput

How fast can a Debezium PostgreSQL Connector run?
(Source: Shutterstock)
One limitation of the Debezium PostgreSQL connector is that it can only run as a single task. I ran some load tests and discovered that a single task can process a maximum of 7,000 change data events/second. This also corresponds to transactions/second as long as there’s only one change event per transaction. If there are multiple events per transaction, then the transaction throughput will be less. In a previous blog (pipeline series part 9) we achieved 41,000 inserts/s into PostgreSQL, and 7,000 is only 17% of that. So, this part of the CDC pipeline is acting more like an elephant than a cheetah in practice. However, typical PostgreSQL workloads have a mix of writes and reads, so the write rate may be substantially less than this, making the Debezium PostgreSQL connector a more viable solution.
I also noticed another slightly odd behaviour that you may need to be aware of. If two (or more) tables are being watched for change events, and the load is unbalanced across the tables (e.g. if a batch of changes occurs in one table slightly before the other), then the connector processes all the changes from the first table before starting on changes for the second table. This was a 10 minute delay for the example I discovered. I’m not really sure what’s going on here, but it looks like the connector has to process all changes for one table, before moving onto other tables. For more normal, well-balanced workloads, this may not be an issue, but for spikey/batch loads that heavily load a single table, this may cause problems for timely processing of change events from other tables.
One solution may be to run multiple connectors. This appears to be possible (e.g. see this useful blog), and may also help with overcoming the 7,000 events/s max processing limit. However, it would probably only work if there is no overlap of tables between the connectors, and you need to have multiple replication slots for this work (there is a connector configuration option for “slot.name”).
4. Streaming Debezium PostgreSQL Connector Change Data Capture Events Into Elasticsearch With Kafka Sink Connectors

The final metamorphosis, from Cheetah (Kafka) to Rhino! (Sink System, e.g. Elasticsearch)
(Source: Shutterstock)
Successfully getting sufficient change data events into Kafka, and understanding them, isn’t the end goal of course, as you want to be able to stream them into one or more sink systems.
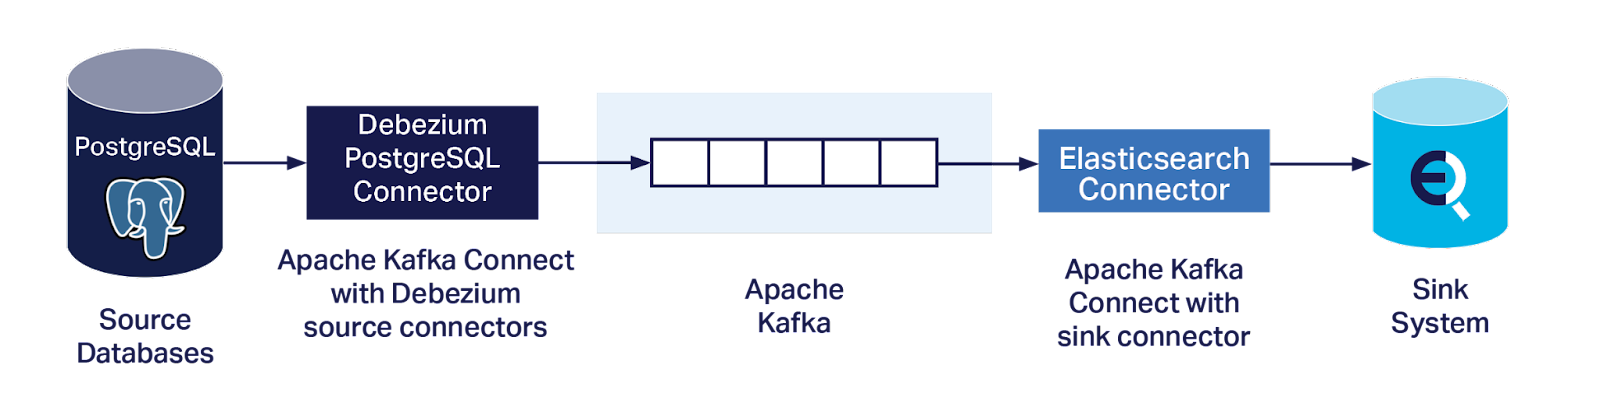
I wanted an easy way of testing the complete end-to-end system, particularly using an approach that didn’t need custom Kafka Connect Sink Connectors to interpret complex change data events and semantics of the sink system, or running a Schema Registry (which would probably also require a custom source connector). I, therefore, re-used the Elasticsearch Sink Connectors from the recent pipeline blog series. This approach previously worked well for reading schemaless JSON data, so seemed ideal for this use case as well.
The first cab off the rank (which in these days of ride-sharing apps is an anachronistic turn of phrase) is the Apache Camel Kafka Elasticsearch Sink Connector. This was the connector that was the most robust from past experiments. Unfortunately, this time around it was missing a class (“org.elasticsearch.rest.BytesRestResponse”) which I didn’t attempt to debug further. Apparently, I would not make a good spy, as anyone versed in spy-craft knows not to accept the first cab that turns up!
For my second attempt, I used another open source Elasticsearch sink connector, from lenses.io, which is included by default in Instaclustr’s Managed Kafka Connect service.
Here’s an example configuration for this connector (you need to supply the Kafka Connect and Elasticsearch IPs, usernames, and passwords):
|
1 2 3 4 5 6 7 8 9 10 11 12 |
curl https://KC_IP:8083/connectors/elastic-sink-tides/config -k -u KC_user:KC_password -X PUT -H 'Content-Type: application/json' -d ' { "connector.class" : "com.datamountaineer.streamreactor.connect.elastic7.ElasticSinkConnector", "tasks.max" : 100, "topics" : "test1.public.test1", "connect.elastic.hosts" : "ES_IP", "connect.elastic.port" : 9201, "connect.elastic.kcql" : "INSERT INTO test-index SELECT * FROM test1.public.test", "connect.elastic.use.http.username" : "ES_user", "connect.elastic.use.http.password" : "ES_password" } }' |
This ran correctly. Note that to process anything like 7,000 events/s we need multiple sink connector tasks, and you will also need to increase the number of Kafka partitions accordingly (partitions >= tasks).
One limitation of this connector configuration is that it processes all events as “insert” events. However, our change data events can have “before” and “after” fields which it doesn’t know anything about, and you will just end up with “junk” in the Elasticsearch index which you’ll have to subsequently make sense of. A simple solution is to use an SMT (Single Message Transformation) on the sink connector to extract just the “after” fields. I used the “event-flattening” ExtractNewRecordState SMT. Here’s the final Debezium PostgreSQL source connector configuration including the SMT:
|
1 2 3 4 5 6 7 8 9 10 11 12 13 14 15 16 17 18 19 20 |
curl https://KC_IP:8083/connectors -X POST -H 'Content-Type: application/json' -k -u kc_user:kc_password -d '{ "name": "debezium-test1", "config": { "connector.class": "io.debezium.connector.postgresql.PostgresConnector", "database.hostname": "pg_ip", "database.port": "5432", "database.user": "pg_user", "database.password": "pg_password", "database.dbname" : "postgres", "database.server.name": "test1", "plugin.name": "pgoutput", "value.converter": "org.apache.kafka.connect.json.JsonConverter", "value.converter.schemas.enable": "false", "key.converter": "org.apache.kafka.connect.json.JsonConverter", "key.converter.schemas.enable": "false", "transforms": "unwrap", "transforms.unwrap.type": "io.debezium.transforms.ExtractNewRecordState" } } ' |
And finally, to double-check everything I reused my original pipeline NOAA data and topics. This also allowed me to check that the JSON data was being indexed into Elasticsearch as expected (although I just used default mappings this time around), and also enabled me to check if there was any difference in throughput between PostgreSQL JSON and JSONB (with a GIN index) reads—I am pleased to report that there wasn’t.
However, as I discovered in the pipeline series blog 8, Elasticsearch sink connectors struggle to index more than 1,800 inserts/s, well below the single-threaded connector task limitation of 7,000 events/s (but in part 9 we got better results using a workaround and the BULK API), so any difference between JSON and JSONB performance is possibly being masked, but is certainly not the major performance issue.
5. Conclusions
In this blog, we successfully deployed, configured, and ran a test CDC pipeline from PostgreSQL to an example target sink system (e.g. Elasticsearch) using the Debezium PostgreSQL Connector and the Instaclustr Managed Kafka Connect and OpenDistro Elasticsearch service. For many use cases, you will need to have more complex Kafka sink connectors to interpret the change data event semantics and how to apply them to different sink systems, and there are many more configuration options to take into account that I didn’t look at. Given the potential limitations of the single task and other potential performance idiosyncrasies, you should also conduct an adequate test of performance and lag with realistic data and appropriately sized systems before moving into production.
Note: the experiments in this blog were done in a development environment, using a combination of open source/self-managed PostgreSQL (not our managed PostgreSQL service) used in conjunction with Instaclustr’s managed Kafka Connect and Elasticsearch services. Currently we have customers using Debezium in private preview for our managed Cassandra service, but at the time of publication Debezium is not yet offered on our managed PostgreSQL service.