In Part 6 and Part 7 of the pipeline series we took a different path in the pipe/tunnel and explored PostgreSQL and Apache Superset, mainly from a functional perspective—how can you get JSON data into PostgreSQL from Kafka Connect, and what does it look like in Superset. In this blog, we run some initial load tests and find out how the capacity of the original Elasticsearch pipeline compares with the PostgreSQL variant.
1. Scaling Kafka Connect, Elasticsearch, and PostgreSQL Pipelines
The first part of the blog focuses on scaling up the Elasticsearch and PostgreSQL pipelines so we can get some ballpark results for pipeline capacity. In part 5 of the pipeline series we started scaling up the Kafka Connect and Elasticsearch pipeline, which involved:
- Using a different load generation approach (a Kafka connect source load generator)
- Monitoring multiple relevant metrics across different systems to achieve end-to-end throughput and latency visibility into the pipeline
- Increasing the number of Kafka connector tasks to increase throughput
- And checking that the various different systems were all keeping up
We encountered and fixed several “speed-humps” along the way including:
- Problems with the Kafka key/partitions (insufficient key cardinality)
- Ensuring that the Elasticsearch sink system wasn’t a bottleneck (increasing the number of shards)
- And increasing the number of Kafka partitions (but only as many as are actually needed for the number of Kafka connect tasks)
This enabled the Elasticsearch pipeline option to scale linearly up to 5 Kafka Connect tasks, and 3 Elasticsearch shards, achieving 350 index operations per second.
In order to scale further, we need to ensure that we have big enough Kafka, Kafka Connect, Elasticsearch, and PostgreSQL clusters (for the alternative path). But how big is big enough? I decided to make the Kafka Connect cluster the critical resource by creating a Kafka Connect cluster that is big enough to run a reasonable number of tasks, a Kafka cluster that is big enough to more than support the Kafka Connect cluster, and then size the Elasticsearch and PostgreSQL clusters accordingly.
I tried 3 different approaches for producing an increasing load into the Kafka cluster:
- The first approach is just to replay the events that are already on the tides-topic using the Kafka sink connectors. This actually works well, but the only control you have over the load into the sink systems is the number of sink connector tasks
- The second approach is using the kafka-console-producer client. Both this and the next approach need a separate and large (8 VCPU cores) AWS EC2 instance to run the client with multiple threads to generate a high enough load. However, it was difficult to produce sufficient load with this client (it’s not multi-threaded), so:
- The final approach is to use the kafka-producer-perf-test client. I used a dedicated payload-file containing sample NOAA JSON tidal data, and this worked better as it’s multi-threaded and you can specify the desired target load.
Here’s an example of the NOAA tidal data used in the payload-file
|
1 2 3 4 5 6 7 8 9 10 11 |
{ "metadata":{ "id":"8724580", "name":"Key West", "lat":"24.5508", "lon":"-81.8081"}, "data":[{ "t":"2020-09-24 04:18", "v":"0.597", "s":"0.005", "f":"1,0,0,0", "q":"p"}] } |
Note that all these approaches for load generation result in less load on the Kafka Connect cluster than would be the case for “normal” pipeline operation, as the Kafka Connect source connectors are not in use.
The following graph shows the breakdown of VCPU cores used for each technology cluster (Kafka uses 6 cores, Kafka Connect uses 24 cores, PostgreSQL uses 16 cores, and Elasticsearch uses 18 cores), and the total number for each complete alternative pipeline (PostgreSQL 46 vs. Elasticsearch 48). The total price is therefore comparable for each alternative ($ = $). The Kafka and Kafka Connect clusters are the same for each alternative, and the Kafka Connect cluster has the largest core count.
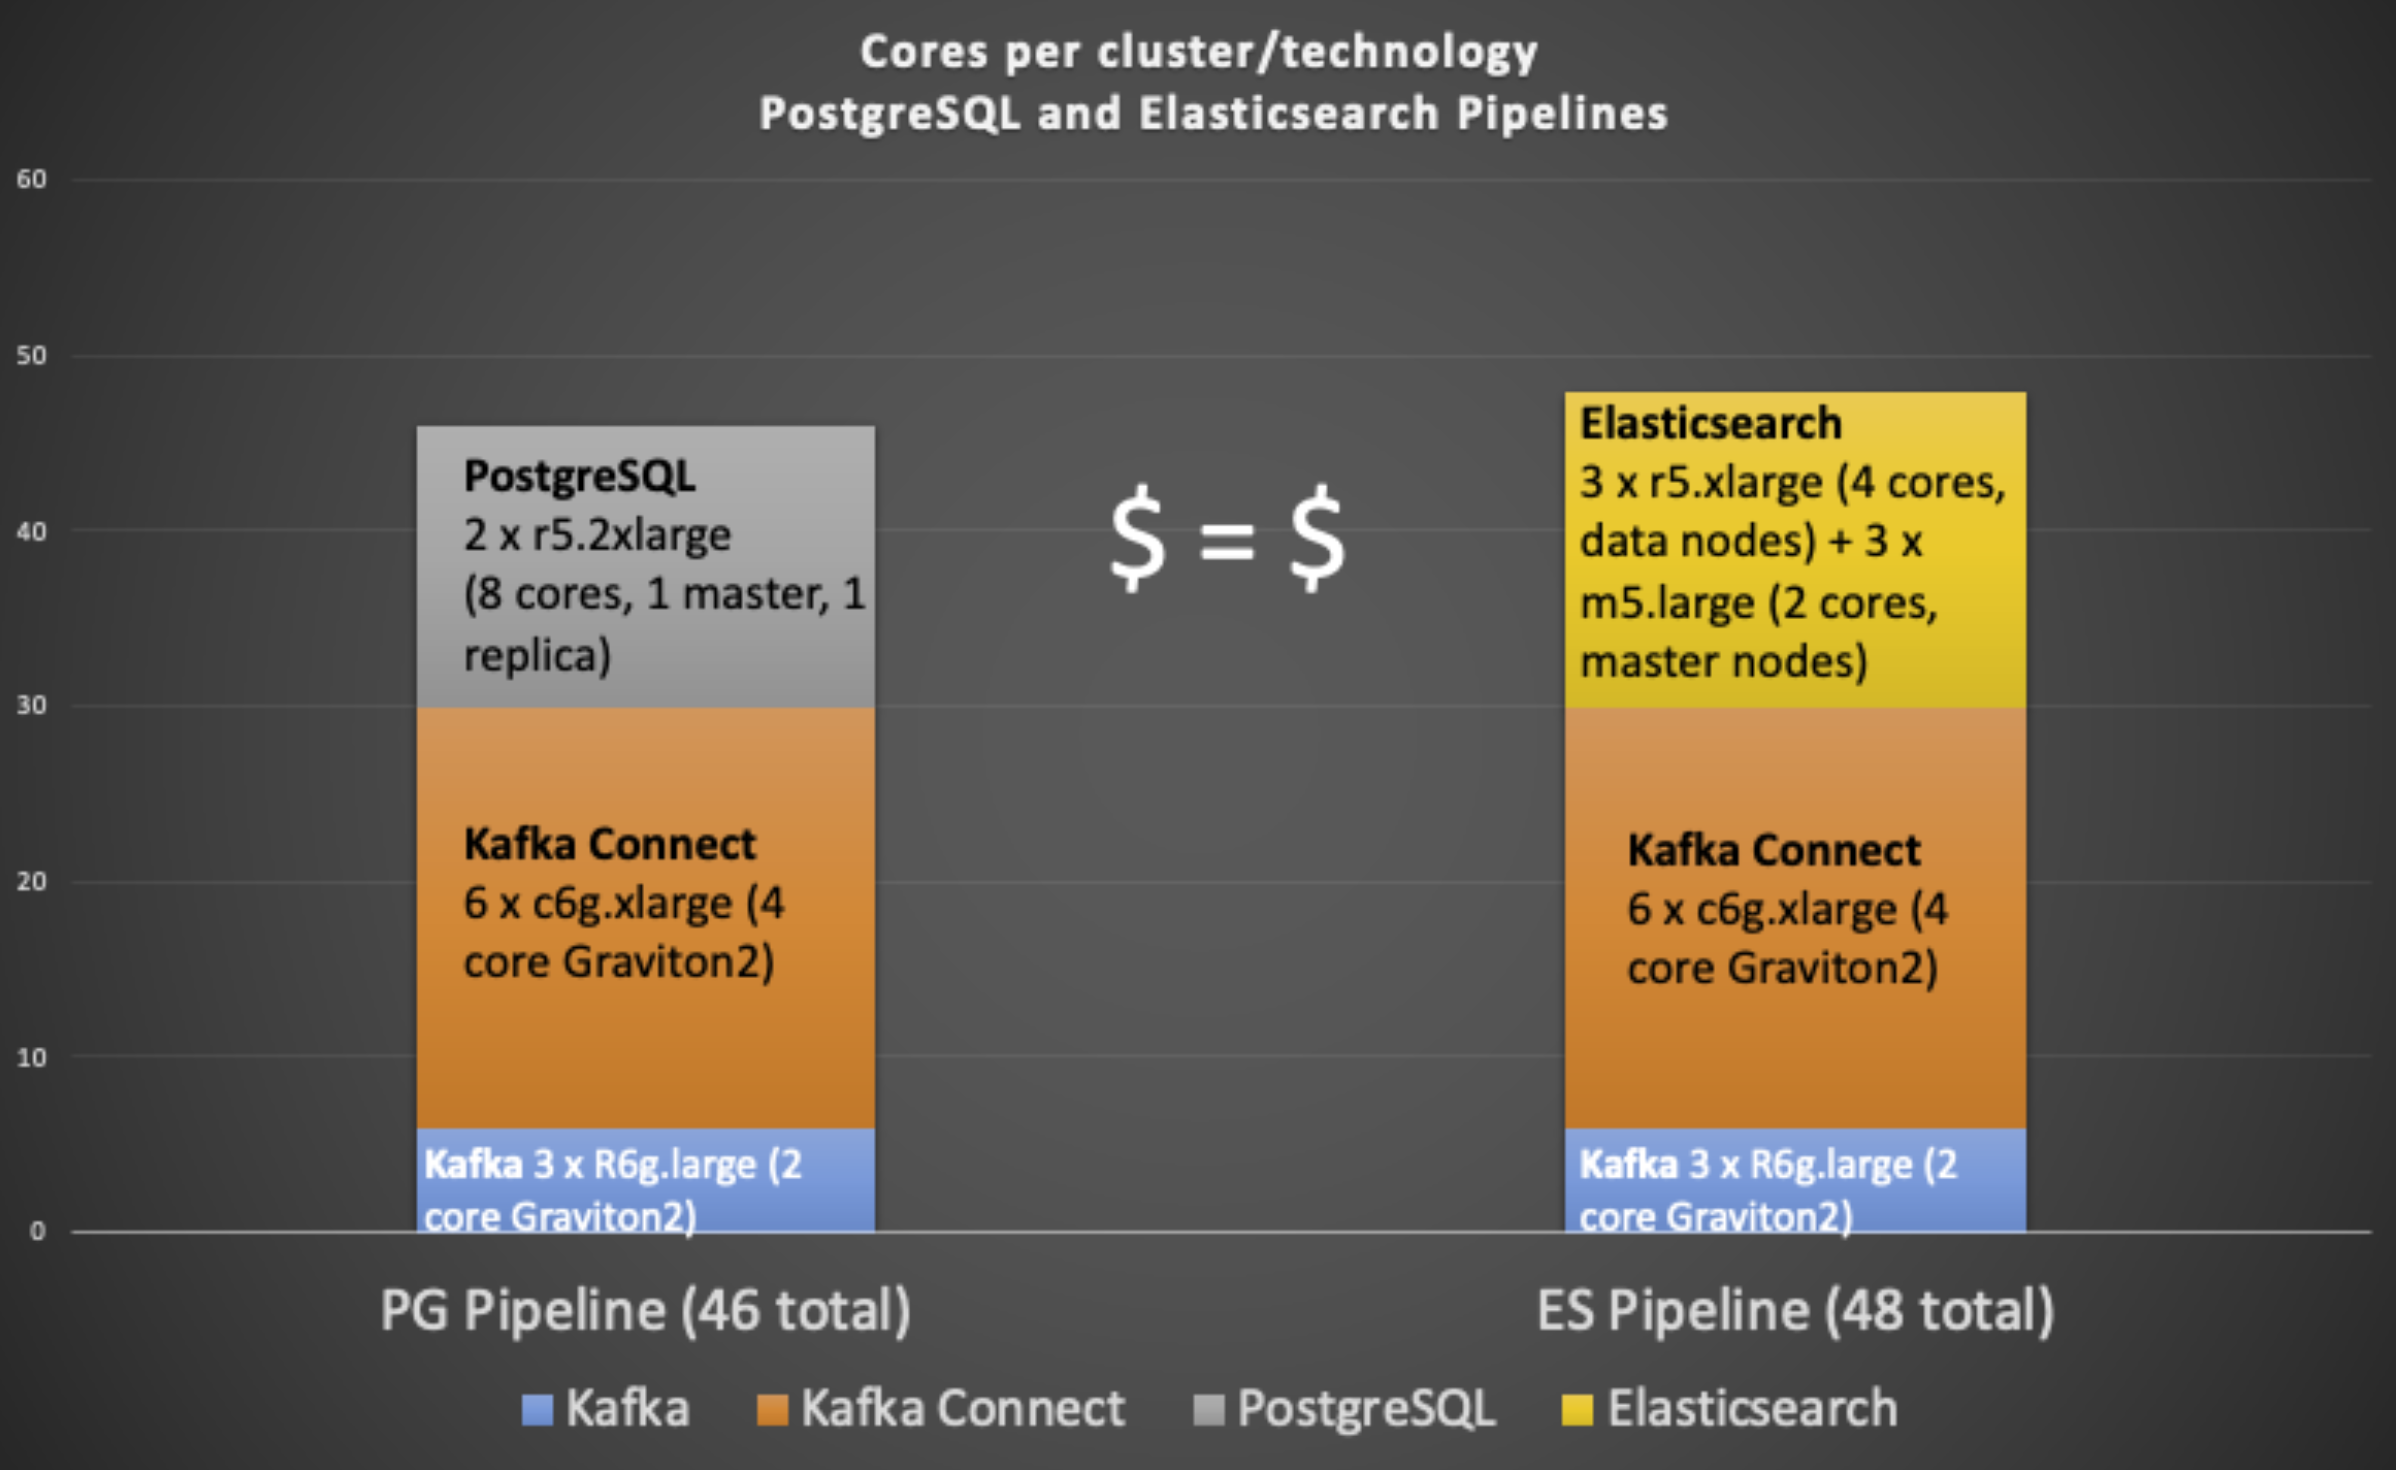
The 8 VCPU EC2 load generator instance is not included.
We have configured both sink systems as clusters for high availability and scalability. The Elasticsearch cluster consists of 3 data nodes, and 3 master nodes (smaller instances), with the default synchronous replication, and 3 shards per index (1 for each data node).
The PostgreSQL cluster consists of 2 nodes, equal-sized master and replica nodes. Instaclustr-managed PostgreSQL clusters with 2 or more nodes are configured for replication and high availability, and synchronous replication is enabled for this cluster. All the writes go to the master, they are replicated synchronously to the replica, and both nodes can serve read requests, horizontally improving the read scalability. Write scalability in this setup is limited to vertical scaling of the master server.
If you are interested in how to set up each pipeline alternative, see Parts 1 to 3 for Elasticsearch/OpenSearch, or Part 6 for PostgreSQL.
2. More Scaling Speed-Humps
Before revealing the results, I’ll share some of my experiences of further speed-humps I encountered along the way.
2.1 Kafka Connect Task Balancing

Tasks are the unit of concurrency for Kafka connectors, so increasing the number of sink connector tasks increases the capacity of the pipeline and the write rate into the target systems. I had 6 Kafka Connect nodes, so I started with 6 connector tasks.
The first problem I encountered scaling up the number of Kafka connector tasks was that the CPU load wasn’t very well balanced, as 3 nodes had all the load and the other 3 had no load, so I could only utilize the equivalent of one half of the cluster. I could see from the Instaclustr management console that the correct number of tasks were running (6), so I decided to check which nodes each of the tasks was running on with this command:
|
1 |
curl https://KC_IP:8083/connectors/sink-connector-name/status -k -u KC_User:KC_Password |
Surprisingly this revealed that there were 2 tasks running on each of only 3 nodes, but none on the other 3 nodes. What was going on? On closer inspection I discovered that there were 3 tasks for a different connector (the Instaclustr SLA connector) running on the other 3 nodes, so the Kafka connector worker didn’t allocate any of my sink connector tasks to these 3 nodes, resulting in a very unbalanced cluster. Increasing the number of tasks fixes this problem, with sink connector tasks being eventually added to the other 3 nodes, and 24 tasks (or more) gives close to equal CPU utilization across all 6 nodes.
So, the basic rule of thumb is to always run a number of tasks per connector that is a multiple of the current number of nodes, i.e. for a 6 node cluster, 6, 12, 18, 24 etc tasks per connector (note that if the number of nodes is increased, this implies increasing the number of tasks). This will ensure that as new tasks are added for other connectors, they will be well balanced across all the nodes.
2.2 PostgreSQL Connection Pooling and Leaks

(Source: Shutterstock)
The second problem I encountered was specific to the PostgreSQL JDBC connector that I was using (this IBM JDBC connector that I had modified to insert JSON into a JSONB data type, see part 6). Increasing the number of tasks gradually, I eventually noticed that I wasn’t getting the requested number of tasks. When I checked the Kafka Connect error topic I found this error message:
|
1 |
org.postgresql.util.PSQLException: FATAL: remaining connection slots are reserved for non-replication superuser connections |
After asking our PostgreSQL experts about this I found out that there is a PostgreSQL concurrent database connection limit of 100 (the typical default). The number of database connections is visible in the Instaclustr Xonsole, and I noticed that it had been climbing. There is a configuration option for database connection pooling in my sink connector (connection.ds.pool.size), which was set at 4, so I thought that decreasing this number would help. Restarting the connectors with a lower number unfortunately just immediately resulted in the same error and all of the tasks FAILING.
What was going wrong? I checked the database connections graph and found that the number of connections wasn’t dropping when I killed the connector tasks, and there’s no easy way (apart from restarting PostgreSQL) to reclaim the connections.
I concluded that the sink connector wasn’t handling the PostgreSQL database connections correctly on failure and/or connector restarts (so connections were “leaking”); it was unclear what the relationship is between the database connection pool configuration, the number of tasks, and total database connections. My current guess is that there’s a database connection pool per task, rather than being shared across all the tasks, which means that each task will use a minimum of 1 database connection. So it’s currently impossible to run more than 100 (actually a few less, as PostgreSQL reserves some connections) sink connector tasks on PostgreSQL, without increasing the database connections limit.
However, raising the connection limit only makes sense if your PostgreSQL server has sufficient resources (at least CPU and RAM, as each connection is a new process, and also requires memory). You also need to ensure adequate disk and network bandwidth if the load increases. A more serious issue is that connections use shared resources, so increasing connections will eventually result in global bottlenecks. Reading this PostgreSQL benchmark report confirms this theory, observing that there’s an optimal number of connections, and the performance drops once the number of connections surpasses the optimal—so maybe I even had too many connections!
According to our PostgreSQL gurus, one solution is to run “PgBouncer” (A lightweight connection pooler for PostgreSQL), and we are investigating this for use with our managed PostgreSQL service.
A similar (but slightly different) challenge arises with other technologies such as Elasticsearch and Kafka. In Elasticsearch, shards are the unit of concurrency, but each shard is a separate multi-threaded Lucene instance and uses memory. You need just the right number of shards for the load and available resources (nodes and cores) otherwise you will have less than optimal throughput. Similarly, for Kafka, partitions are the Kafka concurrency mechanism (paired with Kafka consumers, consumers per consumer group must be <= partitions), and you need sufficient partitions to support the load and number of consumers required, but not too many that there is a drop in throughput due to replication overhead.
2.3 Connecting to a PostgreSQL Cluster

Another minor hiccup occurred with the PostgreSQL sink connector after the cluster had been restarted to reclaim the database connections. Suddenly it was producing errors about now being able to execute inserts in a read-only transaction. What’s gone wrong? Checking on the Instaclustr console (primary/replica chart) reveals that the master and replicas have switched roles, so the sink connector is trying to write to what is now the replica server. I wondered if there’s a way of specifying all the IP addresses of the servers in the cluster and/all instructing it to connect to the master server?
|
1 |
org.postgresql.util.PSQLException: FATAL: remaining connection slots are reserved for non-replication superuser connections |
Unfortunately, this syntax didn’t work for my sink connector configuration (giving an error: “org.postgresql.util.PSQLException: Invalid targetServerType value: primary”), possibly because the driver being used isn’t aware of multiple nodes or primary node types.
One workaround is to use the Instaclustr Monitoring API to get the IP address of the current master PostgreSQL node and set it accordingly (this could be done in the connector code for restarts, or possibly by a script which, triggered by a change of the master IP address and restarting the connector with the updated configuration details). The relevant operation is getClusterBundle, and the pg::misc::isMaster metric (under “PostgreSQL Metrics” sub-heading) returns the following example information (for a given ClusterID):
|
1 |
<span style="background-color: #f4f4f4; font-size: 12.8px;">[{"id":"ClusterID","payload":[{"metric":"isMaster","type":"count","unit":"1","values":[{"value":"1.0","time":"2021-10-05T03:59:02.000Z"}]}],"publicIp":"IP1","privateIp":"IP2", etc }]</span> |
3. Elasticsearch vs. PostgreSQL (Apples-to-Apples Comparison): Let’s Race!

Robot camel racing (robot jockeys, not camels) (Source: Shutterstock)
First, some of the assumptions/settings:
- We will use a write-only workload for the time being
- Obviously, the read performance is also important, particularly how well Kibana and Superset can query large amounts of JSON/JSONB data, but that’s not currently in scope
- The focus is on write throughput (inserts/s, indexes/s), rather than latency (which is tricky to measure end-to-end)
- The Kafka tides topic is configured with replication factor 3, and 48 partitions, limiting us to 48 sink connector tasks (but which can be easily increased)
- PostgreSQL and Elasticsearch clusters both have equivalent replication of “2”, i.e. data is written to 1 one master, and replicated synchronously to 1 replica.
- This is perhaps less than ideal for a production cluster, as we typically recommended at least 2 replicas (apart from the master) to ensure high availability (particularly fast time to recover, with only a small reduction in SLA, if a node fails)
- Elasticsearch has 3 shards and a single index (I tried 6 shards but there was no measurable difference, not surprising as Lucene – a shard – is multi-threaded).
- Elasticsearch uses a HTTP RESTful client protocol, so connections are transient (i.e. you won’t ever hit a “connection limit” in Elasticsearch)
- PostgreSQL database connections are <= 100
- Both results use Kafka Connect sink connectors (hence “apples-to-apples”), but no source connectors (i.e. load is written directly into the Kafka cluster)
And now the initial results comparing the throughput of the Elasticsearch vs. PostgreSQL pipelines.
The PostgreSQL results were encouraging. With 24 connector tasks (75 database connections in use), the maximum rate achieved was 41,000 inserts/s. There was 50% CPU utilization on the PostgreSQL master server, 5% on the replica, 75% on the Kafka Connect cluster, 50% on the Kafka cluster, and the load generating EC2 instance was at 20% CPU.
This made the initial Elasticsearch results a big surprise, as the rate was a paltry 1,800 index operations per second, barely 4% of the PostgreSQL throughput. The Elasticsearch data nodes were at 50% CPU utilization, 36 connector tasks were used, and other cluster types were all under 50%. I also knew from other benchmarking efforts that this was well under what an Elasticsearch cluster of this size was capable of, so what’s wrong?
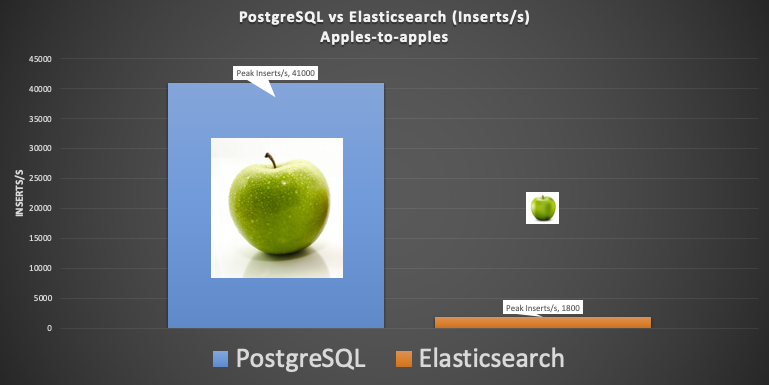
PostgreSQL vs. Elasticsearch capacity, apples-to-apples, initial attempt.
PostgreSQL vs. Elasticsearch capacity, apples-to-apples, initial attempt.
The Elasticsearch index was configured with the custom mapping and geo-point ingest pipeline from the previous blogs; possibly these added some overhead. Doing some quick reading about Elasticsearch index performance, I found two recommendations that looked promising:
- The first is to either turn off, or reduce, the frequency of the index refresh_interval. And the second was to use the Bulk indexing API.
- However, after discussing the issue with our Elasticsearch team they suggested the main problem was probably that I had disabled the default TLS security plugin for the cluster I was using, which meant that the connections were going through a more inefficient proxy service, probably causing a bottleneck
I, therefore, needed some way of using certificates on the Elasticsearch client and using the Bulk API. Unfortunately, the open source Elasticsearch sink connector I’d been using (Apache Camel Kafka Connect Elasticsearch Sink Connector) didn’t seem to support certificates or the Bulk API out of the box (possibly it does, but I couldn’t work out how to do it; other connectors may potentially offer better support).

(Source: Shutterstock)
But stay tuned for the next part when, in true “Myth Busters” style, we get the results we want!
Further Resources
kafka-producer-perf-test script
The kafka-producer-perf-test.sh script is used to test producer performance, and comes with the Apache Kafka distribution (it’s in the bin directory). But it’s hard to find any documentation for it, so here are the available options:
./kafka-producer-perf-test.sh –help
usage: producer-performance [-h] –topic TOPIC –num-records NUM-RECORDS [–payload-delimiter PAYLOAD-DELIMITER] –throughput THROUGHPUT [–producer-props PROP-NAME=PROP-VALUE [PROP-NAME=PROP-VALUE …]] [–producer.config CONFIG-FILE] [–print-metrics] [–transactional-id TRANSACTIONAL-ID]
[–transaction-duration-ms TRANSACTION-DURATION] (–record-size RECORD-SIZE | –payload-file PAYLOAD-FILE)
optional arguments:
-h, –help show this help message and exit
–topic TOPIC produce messages to this topic
–num-records NUM-RECORDS
number of messages to produce
–payload-delimiter PAYLOAD-DELIMITER
provides delimiter to be used when –payload-file is provided. Defaults to new line. Note that this parameter will be ignored if –payload-file is not provided. (default: \n)
–throughput THROUGHPUT
throttle maximum message throughput to *approximately* THROUGHPUT messages/sec. Set this to -1 to disable throttling.
–producer-props PROP-NAME=PROP-VALUE [PROP-NAME=PROP-VALUE …]
kafka producer related configuration properties like bootstrap.servers,client.id etc. These configs take precedence over those passed via –producer.config.
–producer.config CONFIG-FILE
producer config properties file.
–print-metrics print out metrics at the end of the test. (default: false)
–transactional-id TRANSACTIONAL-ID
The transactionalId to use if transaction-duration-ms is > 0. Useful when testing the performance of concurrent transactions. (default: performance-producer-default-transactional-id)
–transaction-duration-ms TRANSACTION-DURATION
The max age of each transaction. The commitTransaction will be called after this time has elapsed. Transactions are only enabled if this value is positive. (default: 0)
either –record-size or –payload-file must be specified but not both.
–record-size RECORD-SIZE
message size in bytes. Note that you must provide exactly one of –record-size or –payload-file.
–payload-file PAYLOAD-FILE
file to read the message payloads from. This works only for UTF-8 encoded text files. Payloads will be read from this file and a payload will be randomly selected when sending messages. Note that you must provide exactly one of –record-size or –payload-file.
Experience the power of open source technologies on the Instaclustr Managed Platform.
Follow the Pipeline Series
- Part 1: Building a Real-Time Tide Data Processing Pipeline: Using Apache Kafka, Kafka Connect, Elasticsearch, and Kibana
- Part 2: Building a Real-Time Tide Data Processing Pipeline: Using Apache Kafka, Kafka Connect, Elasticsearch, and Kibana
- Part 3: Getting to Know Apache Camel Kafka Connectors
- Part 4: Monitoring Kafka Connect Pipeline Metrics with Prometheus
- Part 5: Scaling Kafka Connect Streaming Data Processing
- Part 6: Streaming JSON Data Into PostgreSQL Using Open Source Kafka Sink Connectors
- Part 7: Using Apache Superset to Visualize PostgreSQL JSON Data
- Part 8: Kafka Connect Elasticsearch vs. PostgreSQL Pipelines: Initial Performance Results
- Part 9: Kafka Connect and Elasticsearch vs. PostgreSQL Pipelines: Final Performance Results
- Part 10: Comparison of Apache Kafka Connect, Plus Elasticsearch/Kibana vs. PostgreSQL/Apache Superset Pipelines