After my last blog post about Logstash, Elasticsearch, and Kibana, I wanted to investigate something else I kept coming across during my Logstash research: Elastic Beats.
Beats initially appeared to me to be a way to send data to Elasticsearch, the same as Logstash, leading me to wonder how Beats is different and where it fits in the ELK stack. In this blog, I’ll take a deeper look at Beats to understand how it works, what you might use it for, and how it compares with Logstash.
What Is Elastic Beats (or More Correctly, What ARE Elastic Beats)?
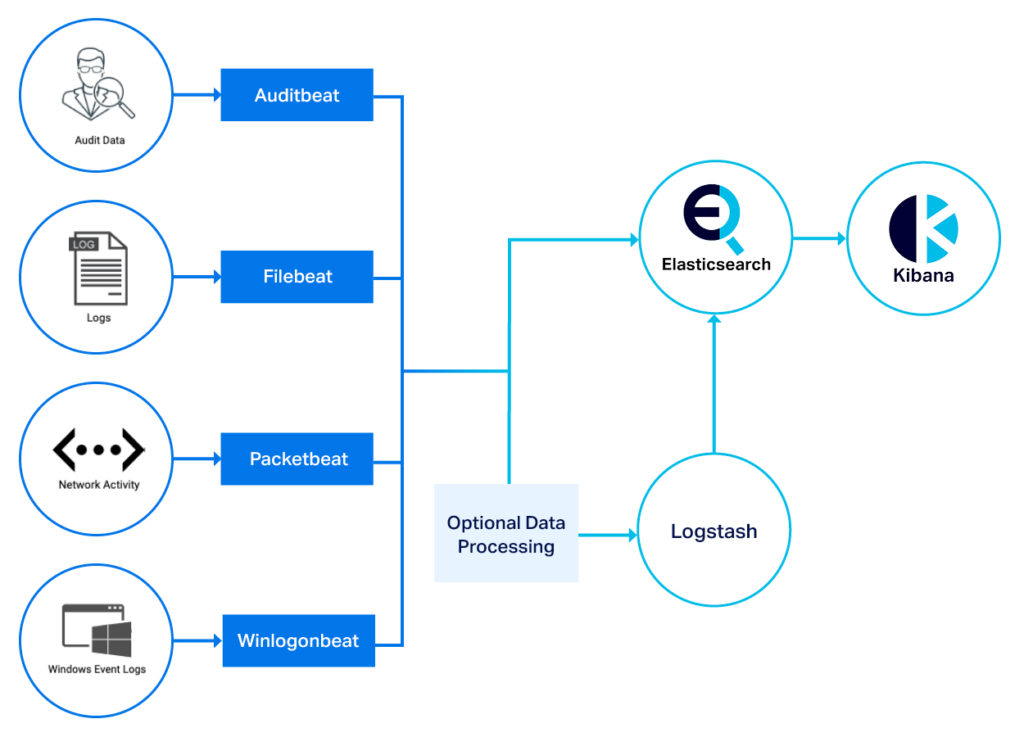
Elastic Beats are a series of different data shippers that are set up and configured to send data from a server or computer into Elasticsearch—either directly, or via Logstash. There are many different Beats out there, as they are often created for specific use cases by the Elasticsearch community, but the ones offered and maintained by Elastic are Metricbeat, Winlogonbeat, Filebeat, Packetbeat, Auditbeat, and Heartbeat.
So what is a data shipper I hear you say? A data shipper is exactly what it sounds like: The shipper (a Beat) ships data (e.g. contents of a log file, metrics on a system, network activity, etc.) to Elasticsearch or Logstash in real time. This is about all it does—there is very little configuration and very little data manipulation you can do in a Beat—it just sends the data somewhere else for processing.
Some potential use cases for Elastic Beats.
The benefit of the Beats doing very little processing and data manipulation is that it makes them extremely light on system resources. This means they can be installed wherever they are needed so that data and metrics can be sent to Elasticsearch instead of being stuck in the logs on the machine.
Elastic Beats are written in the Go programming language and there are many open source Beats available in the Elasticsearch community that are outside of the ones maintained by Elastic. Elastic also offers a developer kit called Libbeat to help build your own Beat if you have the technical knowledge.
Elastic Beats are offered under an Open Source Apache 2.0 Licence (OSS), which I will be using with Instaclustr’s Managed Elasticsearch to ensure compatibility with our open source offering. Using the open source versions allow for maximum flexibility when deploying long term.
Read: OpenSearch and Elasticsearch Architecture
How to Install Elastic Beats and Configure It to Upload My ISS Data
In my last blog post, I created a log of the International Space Station (ISS) coordinates which I had manipulated using Logstash and added to Elasticsearch. To get a feel for Elastic Beats, I wanted to see if I could use the same ISS data API to upload to Elasticsearch, and how the process compared to Logstash.
I first decided which of the Beats I should use. As I was creating a log file the right choice was Filebeat, which is designed to check a log file for new lines and upload to Elasticsearch. Filebeat can be installed using a binary or by using a package manager such as apt or yum in Linux from the Elastic OSS Download Page. I used apt as I was installing on Debian
The next step was to configure Filebeat to pick up my log file and pass it through to Elasticsearch. This was done through the configuration file. The configuration file is a YAML file that is interpreted by Filebeat on starting the application. Using the starter template and documentation I was able to get Filebeat to upload data to Elasticsearch, however, there were a few gotchas that I had to learn about along the way. I’ve listed them below in the hope that you may save some time if you’re trying this yourself:
- Beats doesn’t output errors to the console by default. You should start the Beat with the -e flag while getting your configuration correct so that you can see what the Beat is doing.
- Beats can be run directly as an executable, or as a daemon. Get the Beat working initially by calling it directly, and once everything is working you can start it as a daemon.
- All of the configuration files are in YAML format. If you haven’t worked with YAML before, you should go and read up on what you need to do to ensure that your configuration file is correct. YAML (by design) is very specific about formatting, so if you’re getting errors consider using a YAML tester website to ensure your syntax is correct.
- The configuration file can only output to one place. If you want to output to multiple places (for example directly to Elasticsearch, but also to Logstash) you need to add a second configuration file, effectively calling another instance of the Beat.
Something else I had to take into consideration when setting up Filebeat was data security. I had enabled the security plugin on my Instaclustr Managed Elasticsearch when provisioning as best practice, so wanted to ensure that I was transferring my data securely. Beats has the ability to use HTTPS with TLS, which would ensure an encrypted connection to my Managed Elasticsearch.
There were two steps to configure:
- Using Kibana and the Open Distro security plugin set up a user and password with the principle of least privilege. This user can be given to Filebeats so it can only upload and modify the Beats indices in Elasticsearch. Beats also include a handy Keystore, to store these credentials securely and pass them through to the configuration file, instead of leaving them in plain text.
- Use the certificate generated as part of the Instaclustr provisioning process in the Filebeat configuration file to verify the HTTPS connection.
After a few iterations of my configuration file, my ISS data was appearing in Elasticsearch in real time as it was collected by the API. But it wasn’t yet ready to be used by the coordinate map. As the data was just being shipped directly from my server to Elasticsearch, the incoming data wasn’t being processed into a format that could be used. If you’ll recall from my last blog post, my ISS location logs are collected line by line as a valid JSON string. I needed to find a way to manipulate the incoming data to parse the JSON string into separate Elasticsearch document fields, which could then be interpreted as geo_point data for the coordinate map. This was where a built-in feature of Elasticsearch came into play—the ingest pipeline.
The Elasticsearch Ingest Pipeline
The Elasticsearch ingest pipeline is a way to manipulate and change incoming data (from any source, not just Elastic Beats) before it is written to a document in Elasticsearch. The ingest pipeline is available on ingest nodes. By default, all Instaclustr Managed Elasticsearch nodes are also ingest nodes. The pipeline is not as powerful as Logstash’s data manipulation capabilities, but it is able to make changes that you might need, such as adding and removing fields, matching data to perform conditional changes, and, in my case, expanding valid JSON strings into fields on the Elasticsearch document.
Setting up a pipeline is done through the Elasticsearch API. The basic setup of a pipeline is fairly straightforward:
PUT _ingest/pipeline/<name_of_pipeline>{
  "description": "your description goes here",
  "processors": [ {
“processor name” : “what the process should do” } ]
}
There are a number of processors which can be used, and they can be combined to perform multiple actions. My pipeline ended up looking like the following, using the JSON processor and a for each processor loop to append multiple fields together.
PUT _ingest/pipeline/test_filebeat_pipeline
{
  "description": "test filebeat pipeline",
  "processors": [
    {
      "json": {
        "field": "message",
        "target_field": "expanded_json"
      }
      , "remove": {
        "field": ["host.name", "message"]
      },
      "set": {
        "field": "geo_location",
        "value": "{{expanded_json.iss_position.latitude}},{{expanded_json.iss_position.longitude}}"
      }
    }
  ]
}
The last join in the pipeline was to set Filebeat to actually use it. This was done by adding a pipeline field to the Filebeat configuration, specifying the pipeline name as the argument. My final Filebeat configuration file ended up looking like this:
output.elasticsearch:
  # Array of hosts to connect to.
  hosts: ["<Instaclustr Elasticsearch IP>:9200"]
  ilm.enabled: false

  # Protocol - either http (default) or https.
  protocol: "https"

  # Authentication credentials - Beats User username and password
  username: "beats_user"
  password: "${ES_PWD}"
  ssl.certificate_authorities:
    - <Path to Cluster Certificate PEM>
The pipeline was exactly what I needed to replace Logstash’s data manipulation capabilities. The pipeline allowed me to import my ISS location string into the correct fields to be interpreted by the coordinate map in Kibana.
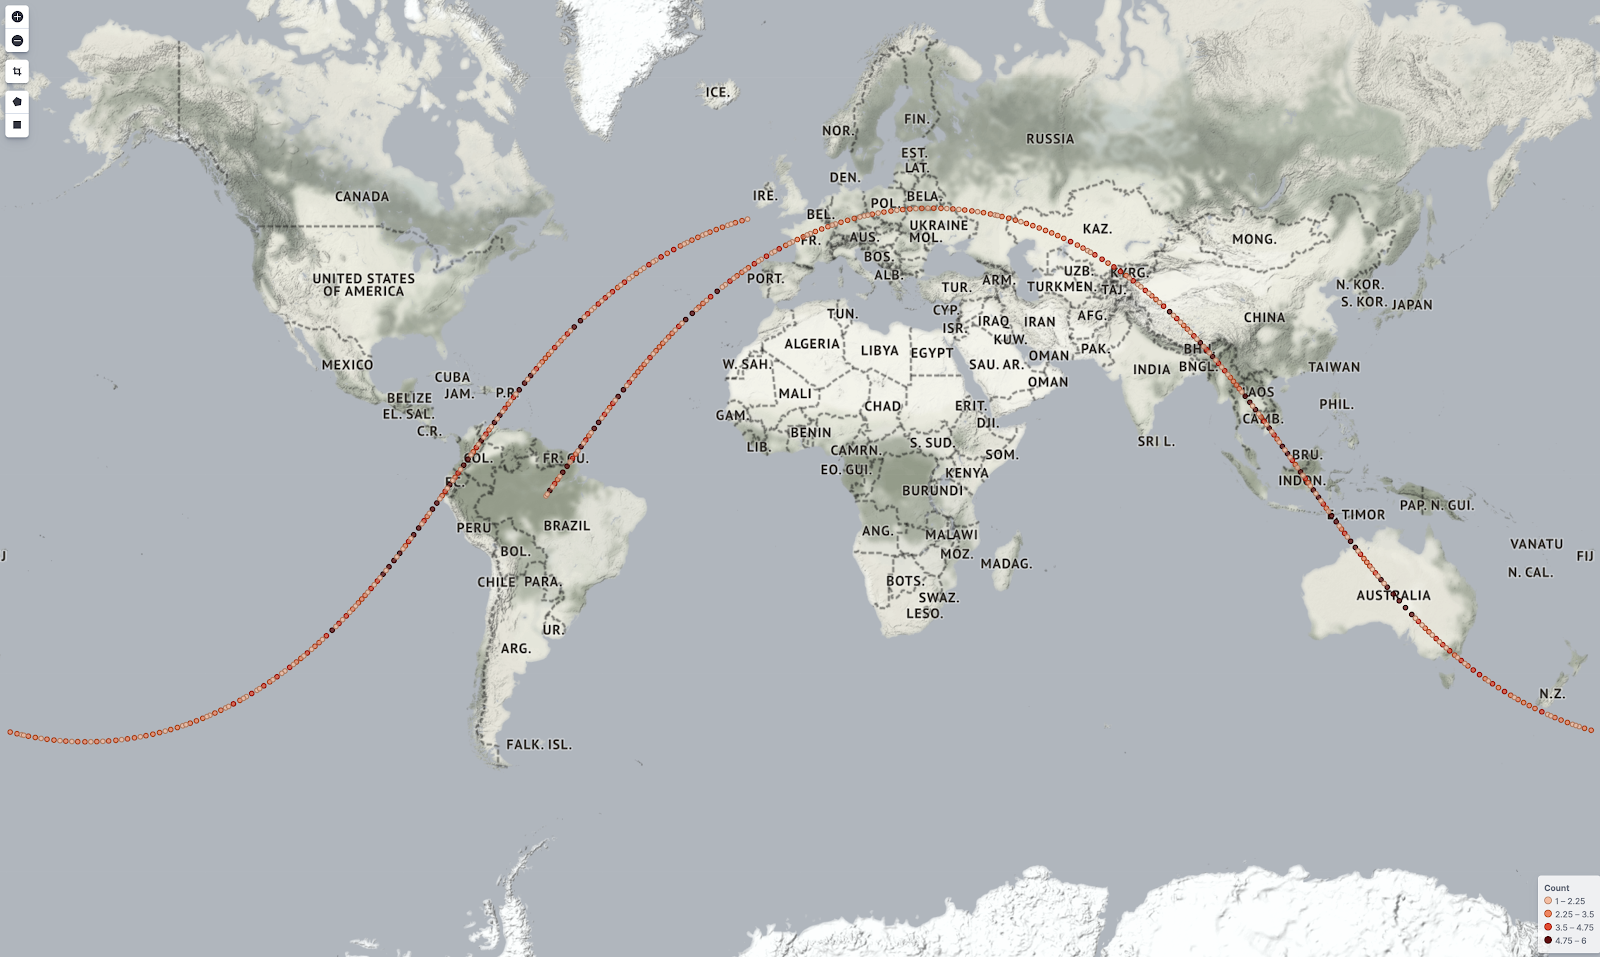
The path of the International Space Station – captured in real time using Filebeats and the Elasticsearch pipeline. (ISS Location data provided by https://open-notify.org/. Map tiles by Stamen Design, under CC BY 3.0. Data by OpenStreetMap, under ODbL.)
The pipeline is a great replacement for smaller data manipulation tasks that don’t require the full power of Logstash, as it can be run as part of the Elasticsearch service, so no need for any other applications. However the downside is that system resources from your Elasticsearch cluster will be eaten up by the processing, so there is a potential for slow-downs in the rest of your Elasticsearch cluster when many incoming streams are being processed per second.
Let’s Scale Up Our Data Collection
Collecting satellite data from one log file on one server is easy and I’m not yet seeing too much of a benefit over Logstash. But what if I had a lot of satellite logs across many different servers? This is quite a common use case, as businesses will have many servers generating logs and want to aggregate them in a single location. I decided to really test Beats out, and see how easy it is to collect from multiple servers. After some brainstorming, I settled on simulating this through the use of Docker containers.
I’m assuming most readers of this blog will be familiar with Docker containers, however, if you aren’t, my super simplified explanation of Docker is that it allows you to create a container that contains a single application and just enough of an operating system to run the application. The container state is static once created, so it can be called repeatedly and a new copy will start each time. This makes the container small and easily repeatable, as the application is entirely set up before the container is started. For this use case, they can almost be considered single servers, and I can use them as such to determine how well Elastic Beats scale.
As I needed more coordinates from more satellites, I moved to a different API—spectator.earth, which offers the coordinates of many different satellites. In the same way that I collected the logs from the ISS, I will be able to collect the location of these satellites in JSON format. Each Docker container will be configured to collect the coordinates for one satellite, and then Filebeat will collect each line of the log and send the data to my managed Instaclustr Elasticsearch instance.
I’ll leave the nitty-gritty details out of how I got the entire Docker setup working, but as a high- level overview, I built a python script to build custom Docker containers which included a running Filebeat and a script to collect the current location of the one satellite into a log every 10 seconds.
Once the script runs I have around 35 containers running, each sending a different satellite’s coordinates to Elasticsearch via Filebeat and the pipeline. Using Kibana and the coordinate map, we can see the satellite locations updating in real time.
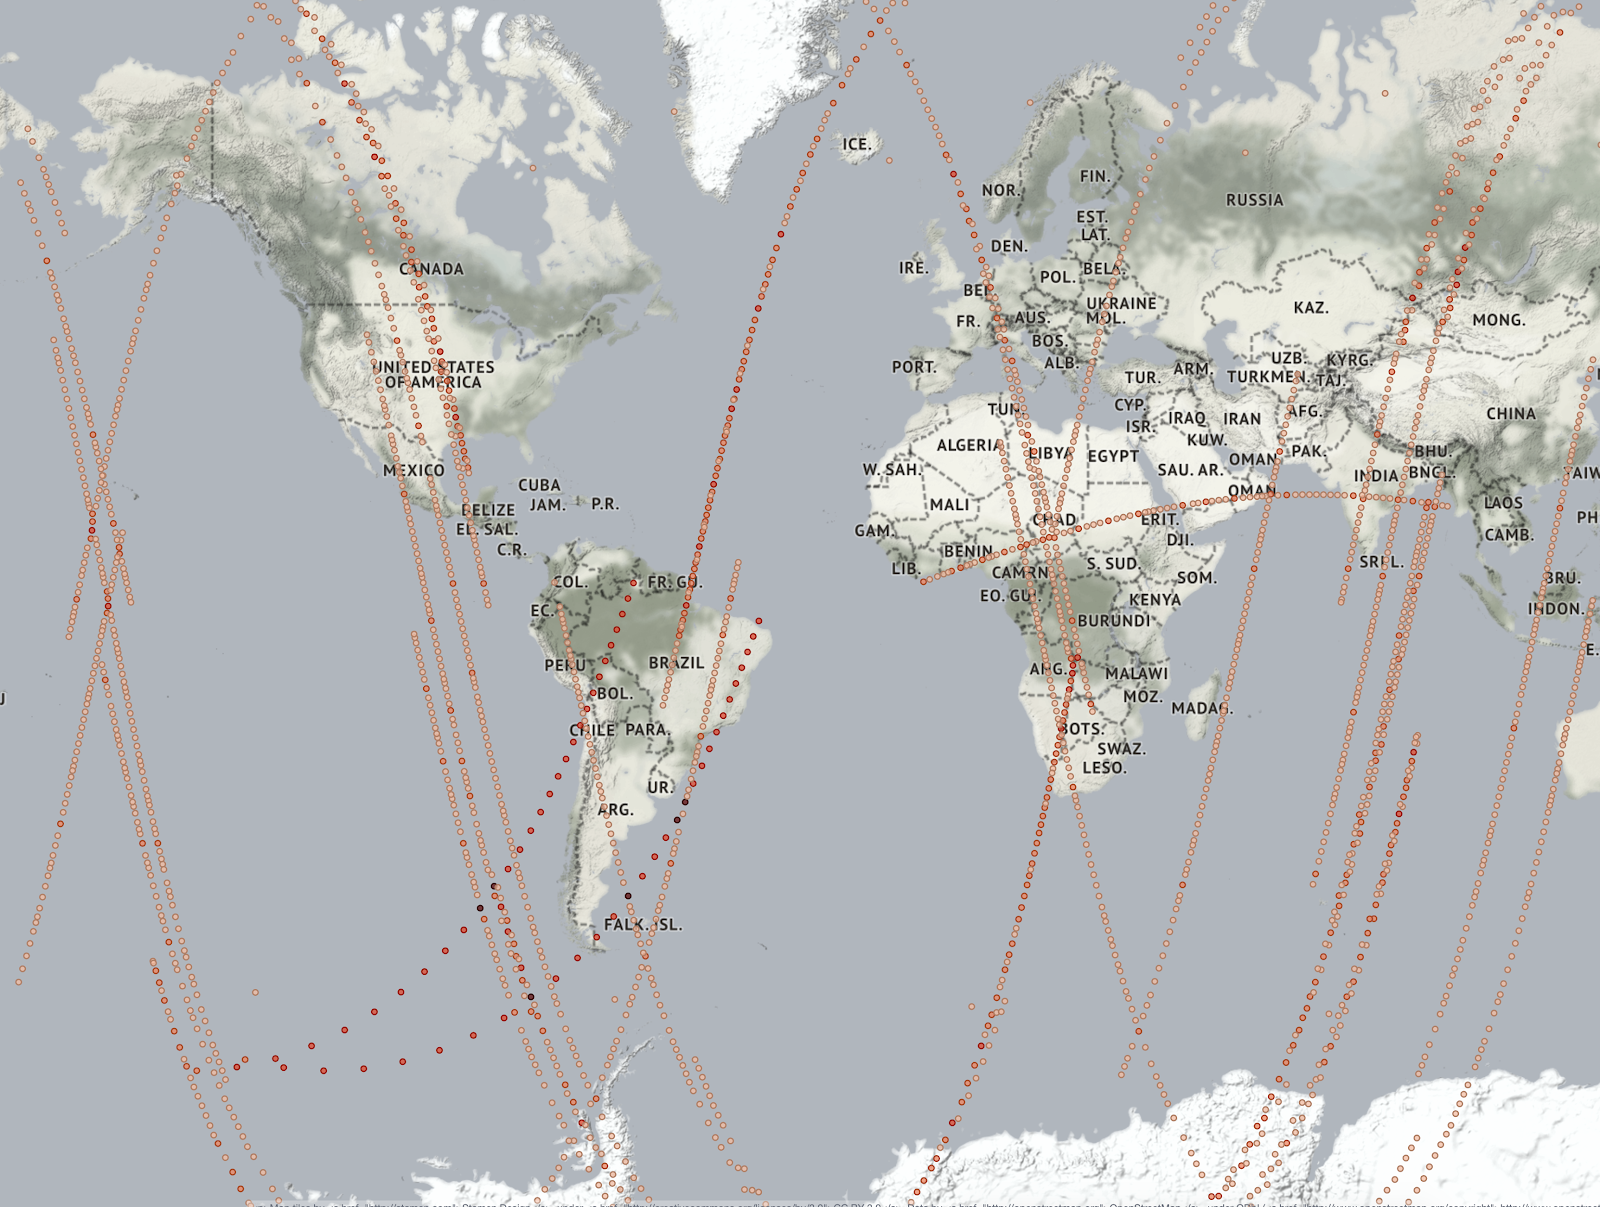
Location of 35 satellites over a 30-minute period, collected using Filebeat and sent on to Elasticsearch. (Satellite Data provided by spectator.earth. Map tiles by Stamen Design, under CC BY 3.0. Data by OpenStreetMap, under ODbL).
Pretty interesting right?! The total memory usage of all the running containers combined was peaking at around 100MB, showing that Filebeats is using very little memory to run.
Now you might be scratching your head and wondering—why should I care if some guy on the Internet was able to map satellites in real time from a bunch of Docker containers? If you imagine that this was hundreds of servers generating logs for your entire enterprise, this would be a really lightweight way to gather all of your logs and data into a central place. For example, you could visualize in real time using Kibana if there was a spike in traffic on your web servers, alerting you to potential security threats. Or monitor the resource use of your production critical servers and identify potential issues before they cause an outage.
I can even use a different Beat on my Docker host to visualize my running Docker containers and the CPU and RAM usage. If I had deployed my containers across a bunch of different nodes using Kubernetes, I would be able to monitor all of the nodes in Kibana and ensure they are up and watch for crashes or issues with my containers.
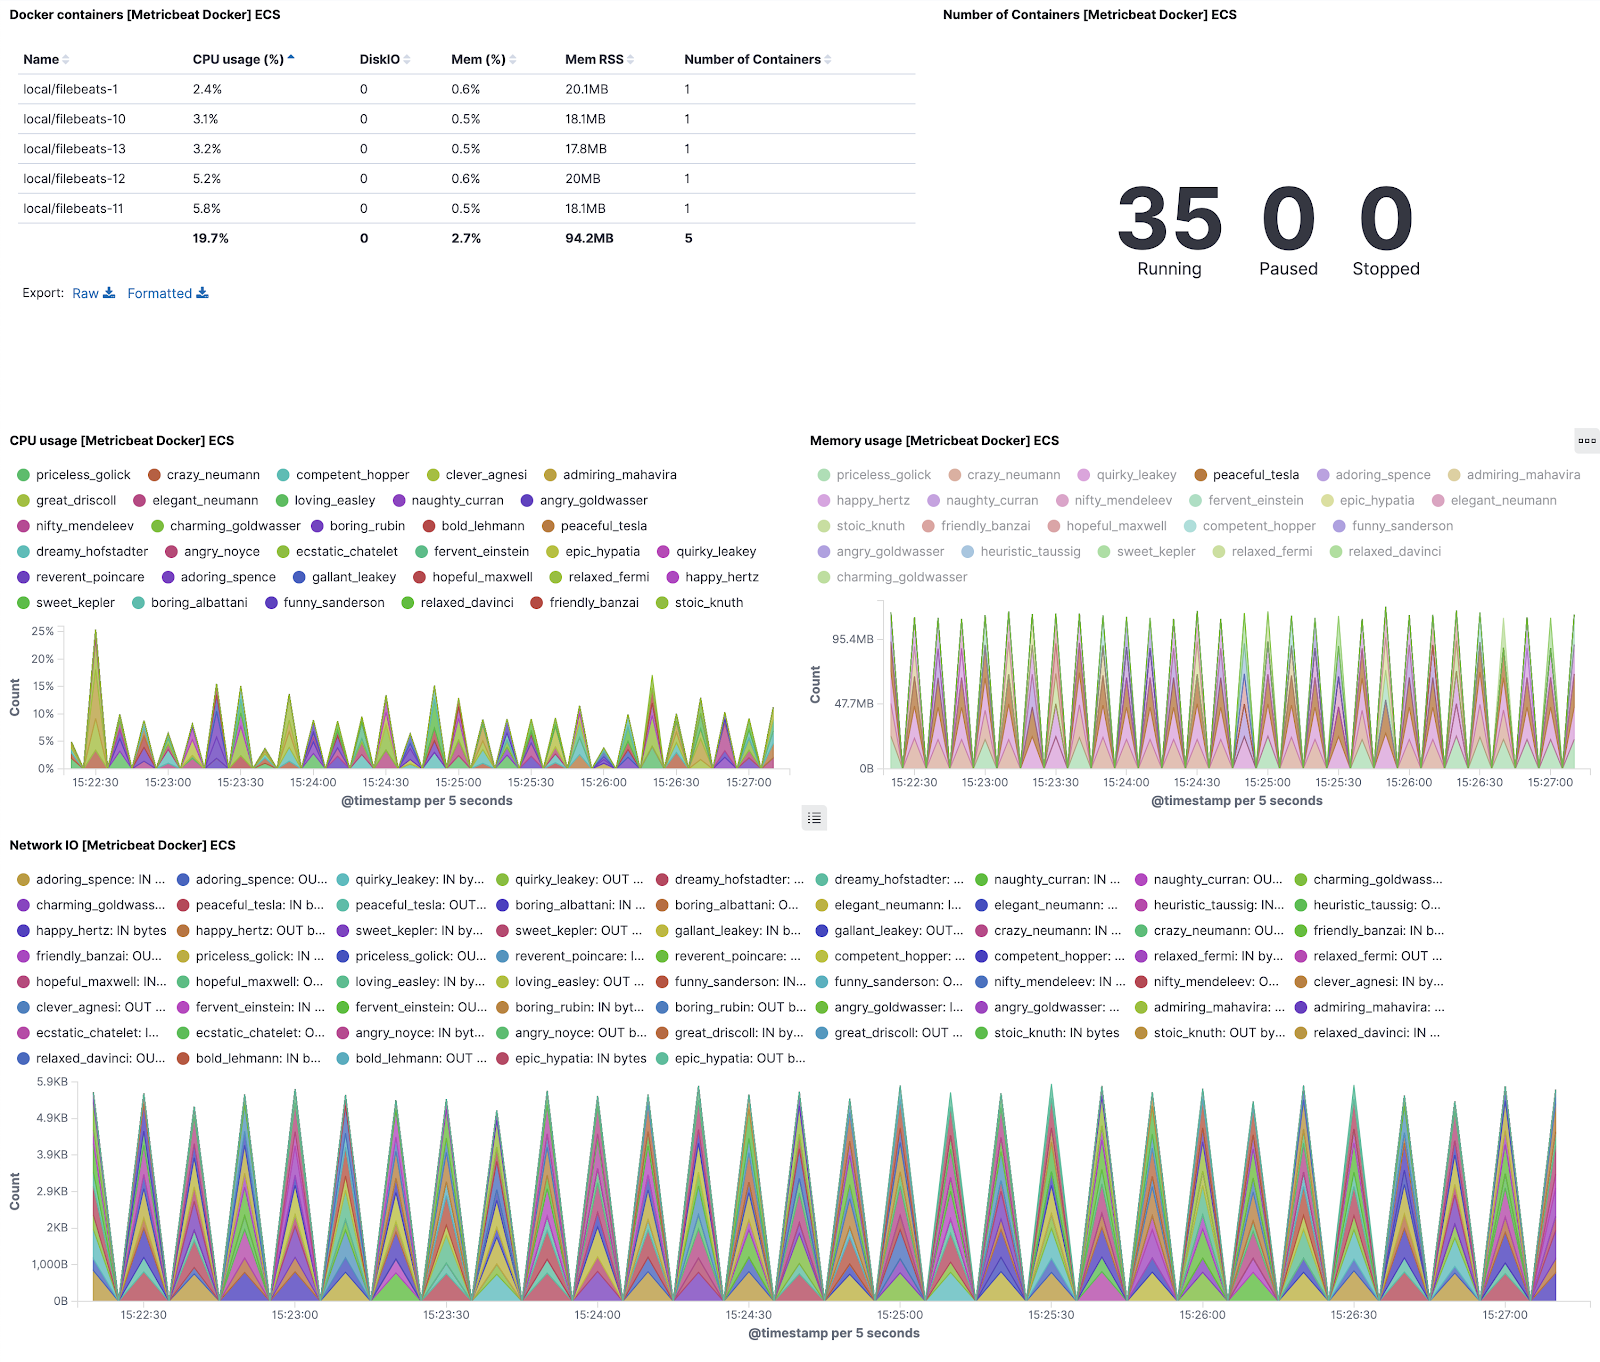
My Kibana dashboard set up to monitor my Docker containers. The data is collected from my Docker host and sent to Elasticsearch using Metricbeat. The spikes are because the containers use such little memory at rest that when they invoke the script to collect data from the API, the usage jumps significantly.
How Does Elastic Beats Compare With Logstash
So where does Elastic Beats land in the Elastic Beats vs Logstash conversation? It appears initially that Elastic Beats combined with ingest pipelines is another alternative to collect data from a source and input it to Elasticsearch. However, Beats shouldn’t be directly compared with Logstash, but rather be seen as another tool in the ELK stack that can be used together with Logstash deployments to gather and manipulate data.
Elastic Beats are a great way to gather and ship data at scale. They are incredibly light on system resources, can be deployed very easily once your initial configuration is correct, and there are a number of preconfigured Beats to make setting them up easier.
Where data manipulation is required, the pipeline is a basic way to get Beats data ingested into Elasticsearch. However, where a more advanced workflow is required, Beats can be supplemented with a Logstash deployment to leverage the more powerful data transformation capabilities.
Conclusion
Elastic Beats are an incredibly useful tool to get your data off your server fleet and into Elasticsearch where it can be utilized for investigating and improving the quality of your service. Beats take up almost no resources, so there are plenty of advantages to be had for almost no overhead. There are many different Beats out there, and there may be one for your use case already built by the community. If you’d like to try Beats in your organization, we can help with a simple to set up free Managed Elasticsearch trial. Get started today!