“The limits of the possible can only be defined by going beyond them into the impossible.”
– Arthur C. Clarke
At Instaclustr, we constantly push ourselves to test the limits of the performance and scalability of the open source technologies our Managed Platform offers. Even at massive scale, our platform ensures that the reliability of the system is intact and continues to be available 24×7. After all, this is our promise to our customers – Performance and Reliability at scale.
In the past few months, our Technology Evangelist, Paul Brebner has been relentlessly testing the limits of massive-scale deployment of a data pipeline consisting of Apache Kafka and Apache Cassandra on the Instaclustr Managed Platform in conjunction with an example Anomaly detection application running on a Kubernetes cluster deployed on AWS EKS. Before we get into the details of the experiment, let me brag a bit on our achievements –
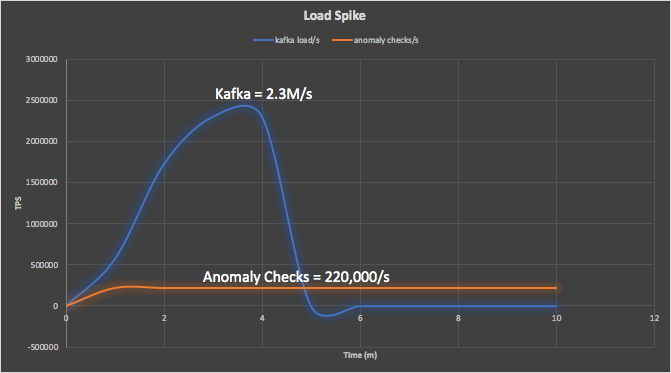
The system achieved a peak Kafka writes of 2.3Million/s, while the rest of the pipeline ran at a sustainable anomaly check of 220,000/s.
If you are looking for a business metric, from the business application standpoint, here it is –
The system processed a massive 19 Billion events per day (19 x 10^9).
This is nearly 500 times higher throughput with lower real-time latency compared to any previously published benchmarks for Anomaly detection system as far as we know.
With Anomaly detection as an example application, we architected a streaming data pipeline and demonstrated the scalability, performance and cost-effectiveness of the data layer technologies like Apache Kafka and Apache Cassandra on the Instaclustr Managed Platform. The experiment is narrated through a series of 10 blogs along with a white paper (links at the end), each going through different stages of the experiment and providing in-depth discussion on the problem being solved, thought process in architecting the system, alternative choices evaluated, experimentation process, tools, integrations, reporting, and finally how we scaled the system step-by-step to this massive size and recorded massive performance that could cater to the operational needs of any businesses running today. Even the largest e-commerce business’ traffic reported is about ~1 Billion transactions per day. This system can cater to 19 such massive e-commerce businesses. What’s also impressive here is the affordability through the economies-of-scale benefit of the Cloud. We derived that a system like this could process roughly 1.9 Million events per dollar spent (considering cost for infrastructure, managed service, anomaly detection application R&D and ongoing maintenance).
That’s enough of bragging! Let’s look into a bit more detail about the application and the system itself.
The Anomalia Machina Experiment
Anomaly Detection Application
Anomaly detection is a method used to detect unusual events in an event stream. It is widely used in a range of applications such as financial fraud detection, security, threat detection, website user analytics, sensors, IoT, system health monitoring, etc. Streaming data (events) from these applications are inspected for anomalies or irregularities, and when an anomaly is detected, alerts are raised either to trigger an automated process to handle the exception or for manual intervention. The logic to determine if an event is an anomaly depends on the application but, typically, such detection systems look for historically known patterns (that were previously classified as anomalies, for supervised anomaly detection, or that are significantly different to past events, for unsupervised systems) in the streaming data. Anomaly detection systems involve a combination of technologies such as machine learning, statistical analysis, algorithmic optimisation techniques and data layer technologies to ingest, process, analyse, disseminate and store streaming data. When such applications operate at massive scale generating millions or billions of events, they impose significant computational challenges to anomaly detection algorithms and, performance and scalability challenges to data layer technologies.
A simple type of unsupervised anomaly detection is Break or Changepoint analysis. We used a simple CUSUM (CUmulative SUM) algorithm which takes a stream of events and analyses them to see if the most recent events(s) are “different” to previous ones.
Architecture and Technology Choices
We combined Kafka, Cassandra, and the application to form a simple type of “Lambda” architecture, with Kafka and the streaming data pipeline as the “speed layer”, and Cassandra as the “batch” and “serving” layer. Kafka is a good choice for fast scalable ingestion of streaming data. It supports multiple heterogeneous data sources with linearly scalability and supports data persistence and replication by design. It is also a great fit for store-and-forward use-case where a different technology is used as the persistent storage layer like Cassandra which is great for storing high velocity streaming data (particularly time series data) as it’s optimised for both writes and reads providing with linear scalability and reliability by design.
Application Design
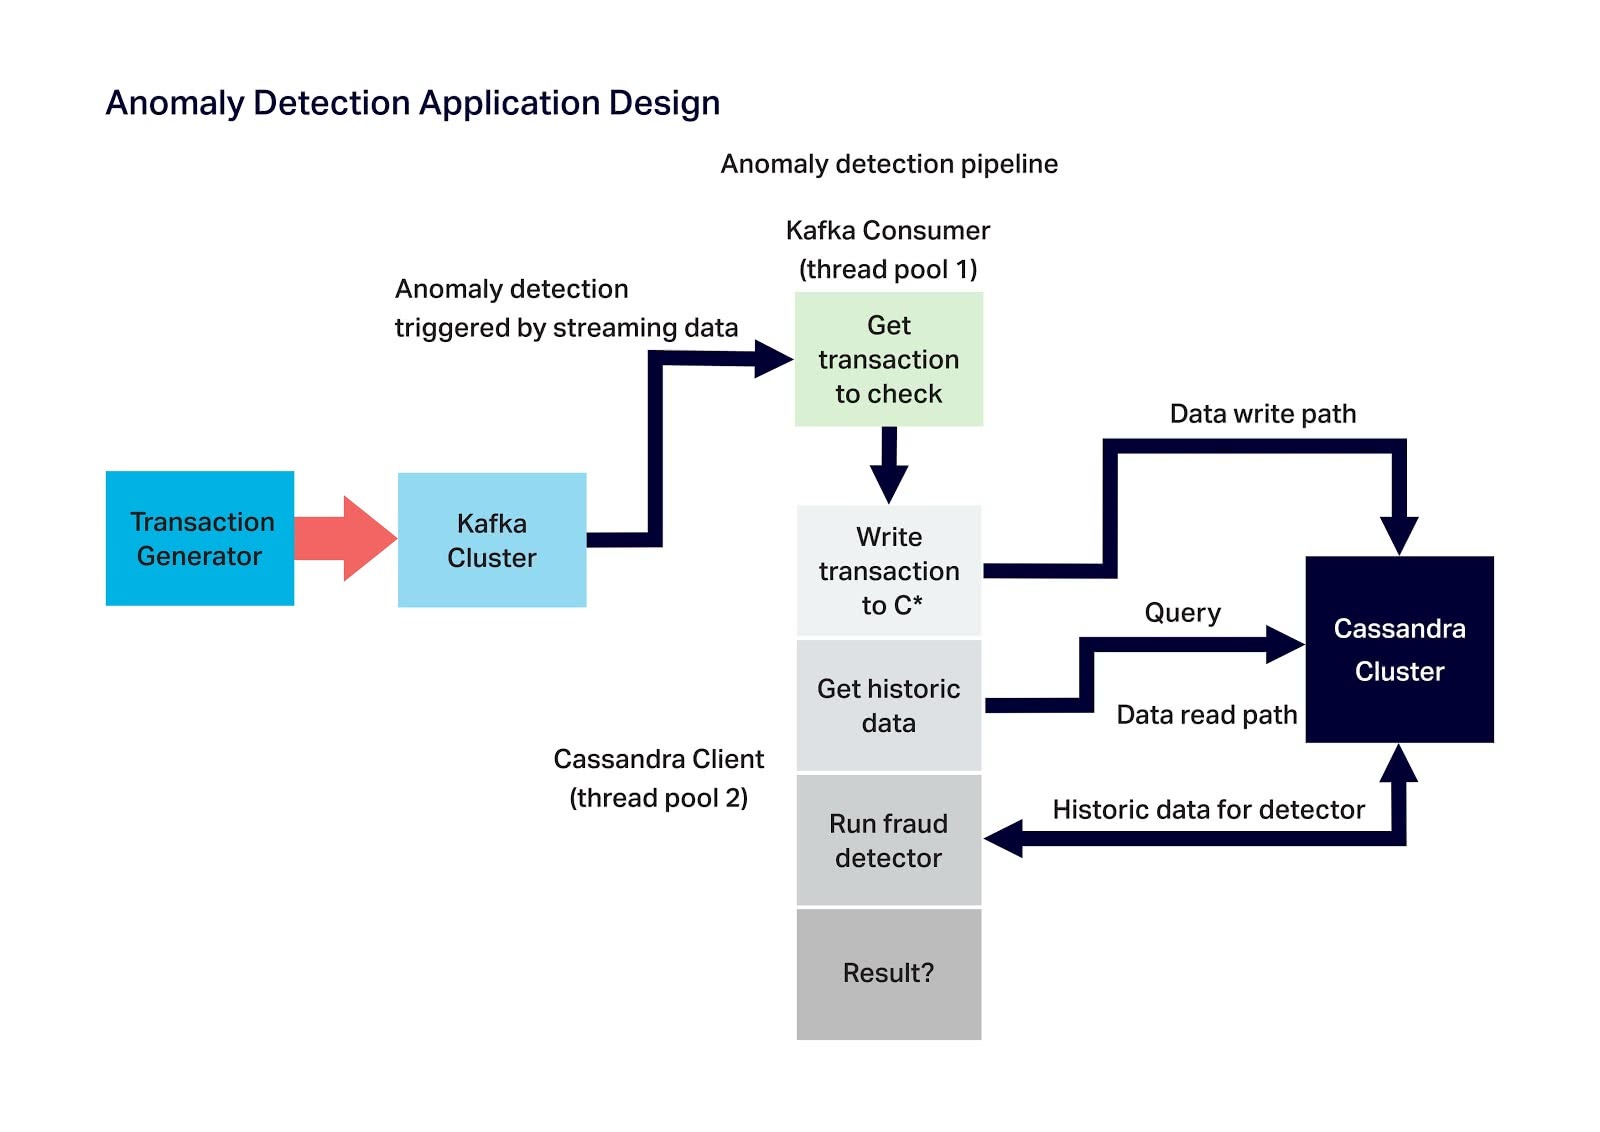
The diagram below shows the anomaly detection application design where the main components are the Kafka load generator (Kafka producer), Kafka cluster, Anomaly detection pipeline, and Cassandra cluster. The anomaly detection pipeline consists of two components: (1) The Kafka consumer which reads messages from the Kafka cluster, and (2) the processing stages which, for each event received from the Kafka consumer, it writes to Cassandra, reads historic data from Cassandra, and runs the detection algorithm to check if the event is an anomaly or not:
Application and Data Pipeline Deployment
We used Instaclustr Managed Platform for automated provisioning, deployment, scaling and monitoring of Kafka and Cassandra clusters. It enables rapid and painless creation of arbitrary sized clusters, and management and monitoring. To automate provisioning, deployment, and scaling of the application, we used AWS EKS. We also used Open Source Prometheus to monitor performance and other metrics, and OpenTracing and Jaeger for distributed tracing. The application was secured with VPC peering from application cluster running on EKS to Kafka and Cassandra clusters running on the Instaclustr Managed Platform.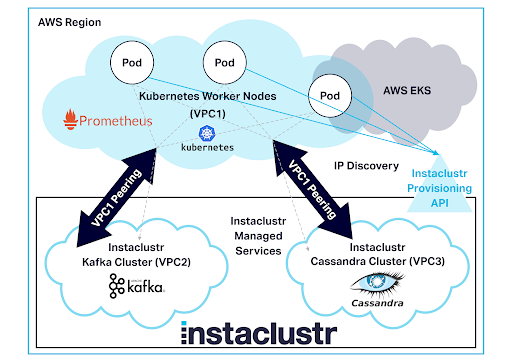
Experiment Specification and Results
We used the following clusters to achieve our biggest results:
- Instaclustr managed Kafka cluster – EBS: high throughput 1500 9 x r4.2xlarge-1500 (1,500 GB Disk, 61 GB RAM, 8 cores), Apache Kafka 2.1.0, Replication Factor=3
- Instaclustr managed Cassandra cluster – Extra Large, 48 x i3.2xlarge (1769 GB (SSD), 61 GB RAM, 8 cores), Apache Cassandra 3.11.3, Replication Factor=3
- AWS EKS Kubernetes cluster Worker Nodes – 2 x c5.18xlarge (72 cores, 144 GB RAM, 25 Gbps network), Kubernetes Version 1.10, Platform Version eks.3
The system achieved a peak Kafka writes of 2.3Million/s, while the rest of the pipeline ran at a sustainable anomaly checks of 220,000/s – a massive 19 Billion events processed per day (19 x 10^9). It used 574 cores in total, and can easily be scaled up or down. The system was processing 400 events per second per core.
Further Information
For more technical information, see our blog series Anomalia Machina: Massively Scalable Anomaly Detection with Apache Kafka and Cassandra:
- Anomalia Machina 1 – Introduction
- Anomalia Machina 2 – Automatic Provisioning of Cassandra and Kafka clusters
- Anomalia Machina 3 – Kafka Load Generation
- Anomalia Machina 4 – Prototype application
- Anomalia Machina 5 – Monitoring with Prometheus
- Anomalia Machina 6 – Application Tracing with OpenTracing and Jaeger
- Anomalia Machina 7 – Kubernetes Cluster Creation and Application Deployment
- Anomalia Machina 8 – Production Application Deployment with Kubernetes
- Anomalia Machina 9 – Anomaly Detection at Scale
- Anomalia Machina 10 – Final Results
The sample Open Source Anomalia Machina application code is available from the Instaclustr GitHub.
Further work extending Anomalia Machina POC
We have started extending the Anomalia Machina POC to a few real-world use cases. Specifically, we are building a fraud detector for FSI sector and an anomaly detector for geospatial applications. We have plans to publish more white papers and blog series around these topics.
Watch this space by subscribing to our newsletter, or follow us on Twitter or LinkedIn for more interesting POC stories.