Accessing Monitoring Information
- To access monitoring tools, log into Instaclustr console.
- Click Monitoring from the sidebar menu of your Cadence cluster. This opens the cluster Monitoring page.
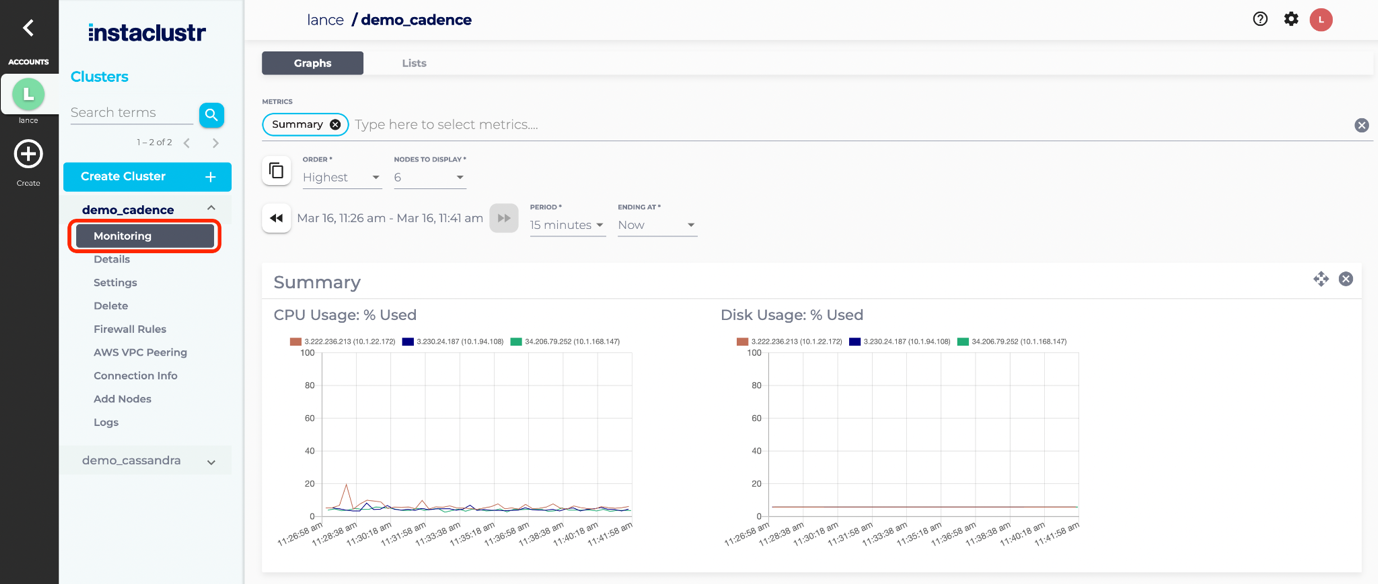
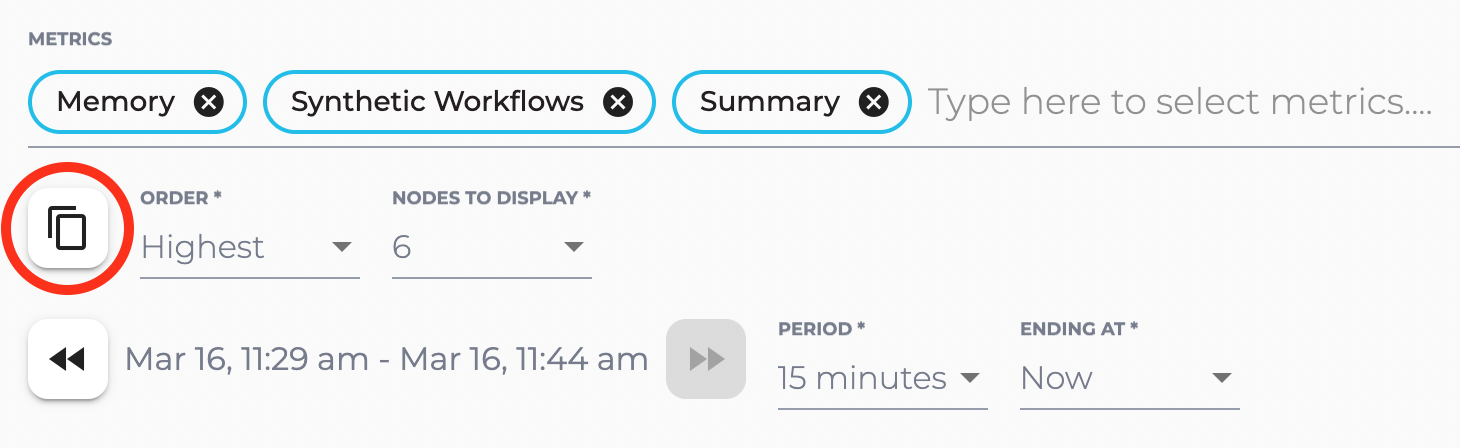
- The cluster Monitoring page displays monitoring information such as CPU and Disk usage for all the nodes in the cluster. The menu bar allows you to select a number of metric groups from a dropdown menu and to customise how you wish to view the selected metrics. Refer to our support article on The Monitoring Page for more information on the available features.
- You may also want to look at monitoring for Apache Cassandra, Apache Kafka, or OpenSearch clusters used by Cadence. This is available in the same location under the individual clusters.
- For information on how to monitor a Cadence Cluster via the Instaclustr Monitoring API, refer to our support article on the Instaclustr Monitoring API.