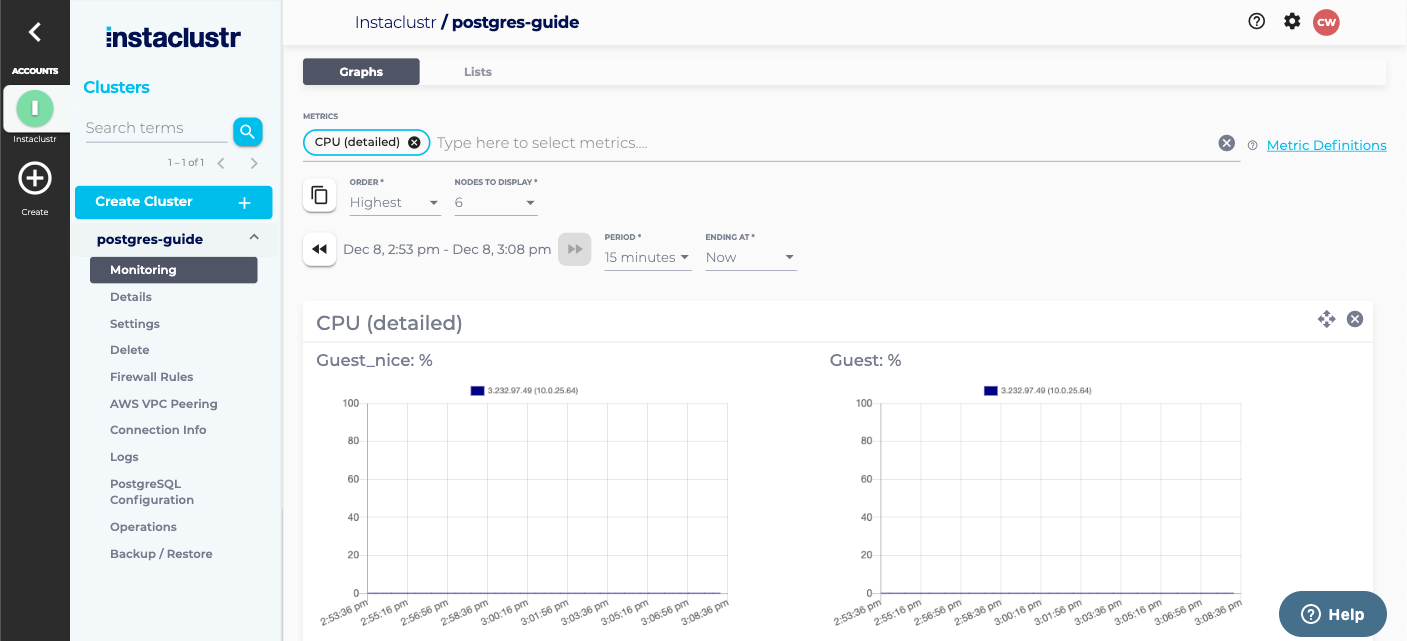
CPU Detailed Metrics
The CPU (detailed) metric group contains per-node metrics regarding CPU. The metrics available are:
- IOWait
- System
- User
- IRQ
- Soft_IRQ
- Idle
- Nice
- Steal
- Guest
- Guest_nice
IOWait
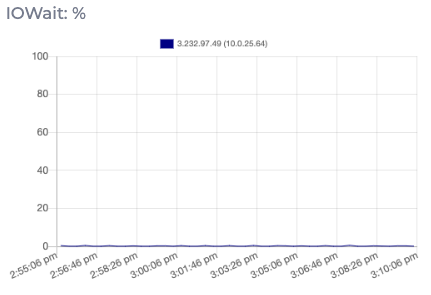
CPU time the I/O thread spent waiting for a socket ready for reads or writes as a percent. High iowait times could be an indication of increased tombstone count, large quantities of SSTables or poor data models causing high disk utilisation.
You can also get this metric through the Monitoring API with the query param metrics=n::cpuiowaitpercent
System
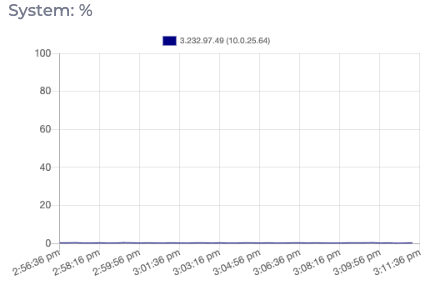
Percentage of processes executing in kernel mode
You can also get this metric through the Monitoring API with the query param metrics=n::cpusystempercent
User
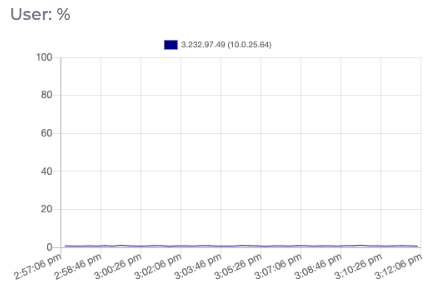
Percentage of processes executing in kernel mode
You can also get this metric through the Monitoring API with the query param metrics=n::cpusystempercent
IRQ

Number of hardware interrupts the kernel is servicing
You can also get this metric through the Monitoring API with the query param metrics=n::cpuirqpercent
Soft_IRQ
Number of software interrupts the kernel is servicing
You can also get this metric through the Monitoring API with the query param metrics=n::cpusoftirqpercent
Idle
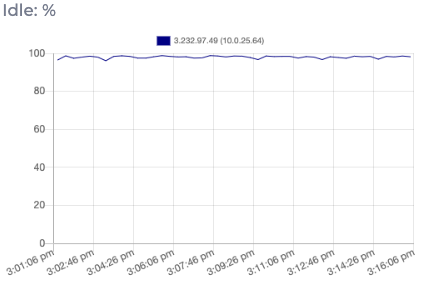
Percentage of time when one or more kernel threads are executing with the run queue empty and/or no I/O operations are currently cycling.
Generally high idle times can be an indication of outstanding I/O request queues but can also indicate low request thoroughfare (whether it be network or local).
You can also get this metric through the Monitoring API with the query param metrics=n::cpuidlepercent
Nice
Percentage of processes executing in user mode which have a positive nice value. Nice values are between -20 and 19 inclusive with a default of 0. Lower values translate to a higher priority in the run queue.
You can also get this metric through the Monitoring API with the query param metrics=n::cpunicepercent
Steal
Percentage of time the hypervisor allocated to other tasks external to the one run on the current virtual CPU. It can be an indication of processes that are using processor time in larger than expected amounts.
You can also get this metric through the Monitoring API with the query param metrics=n::cpustealpercent
Guest
Percent of time spent running a virtual CPU for guest OS’ under control of kernel
You can also get this metric through the Monitoring API with the query param metrics=n::cpuguestpercent
Guest_nice
Processes executing in user mode in virtual OS with a positive Nice value.
You can also get this metric through the Monitoring API with the query param metrics=n::cpuguestnicepercent