PgBouncer Monitoring Metrics
This article introduces the basics of monitoring PgBouncer, using the metrics made available via the Instaclustr Console and the API. There are currently three different PgBouncer metrics groups:
- PgBouncer – Database Level Metrics
- PgBouncer – Connection Pool Level Metrics
- PgBouncer – Availability
PgBouncer – Database Level Metrics
This metrics group includes seven separate metrics:
- Average data sent in bytes per second
- Average data received in bytes per second
- Average queries per second
- Average transactions per second
- Average query duration in milliseconds
- Average client wait duration in milliseconds
- Average transaction duration in milliseconds
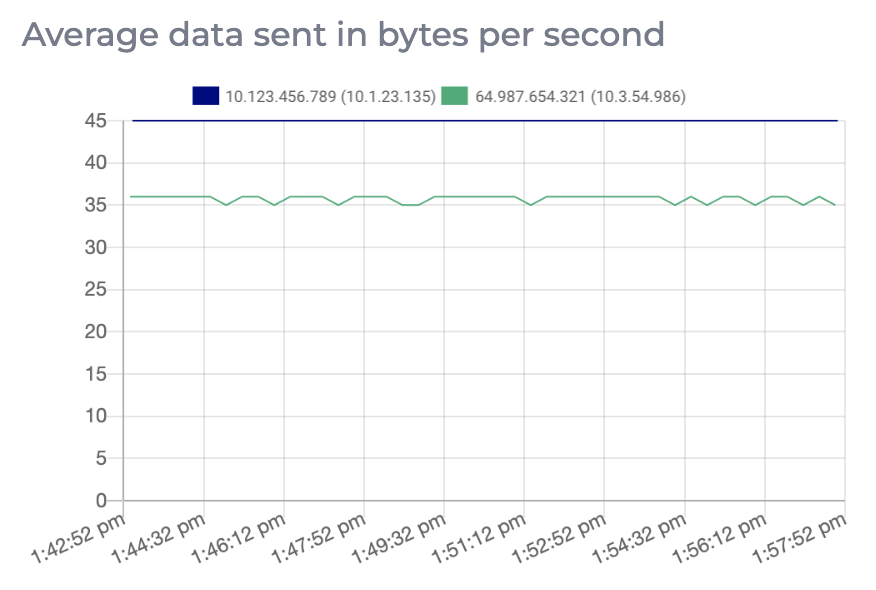
Average Data Sent per Second
This metric specifies the average amount of data sent by PgBouncer to clients connected to a given database each second, measured in bytes. Each data point reflects the average over a single metric collection interval.
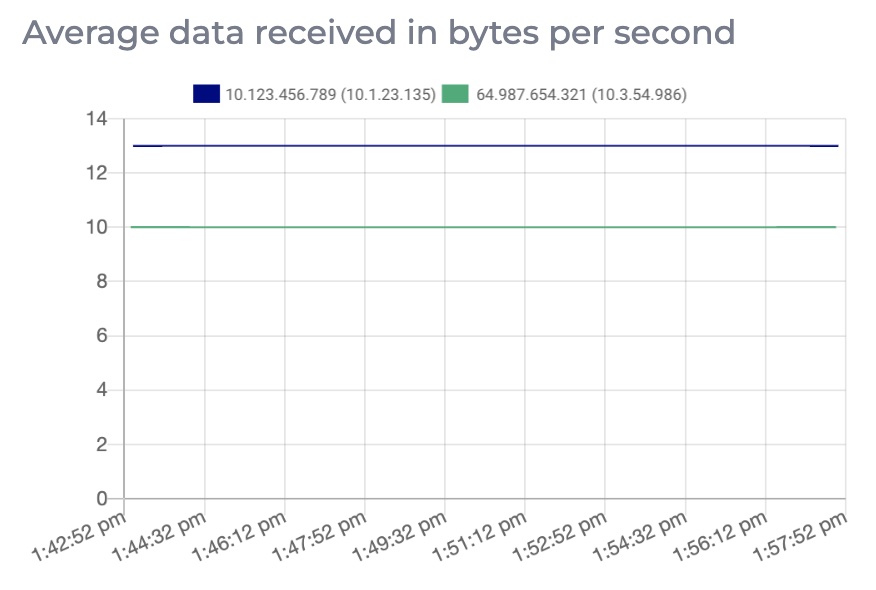
Average Data Received per Second
This metric specifies the average amount of data received by PgBouncer from clients connected to a given database each second, measured in bytes. Each data point reflects the average over a single metric collection interval.
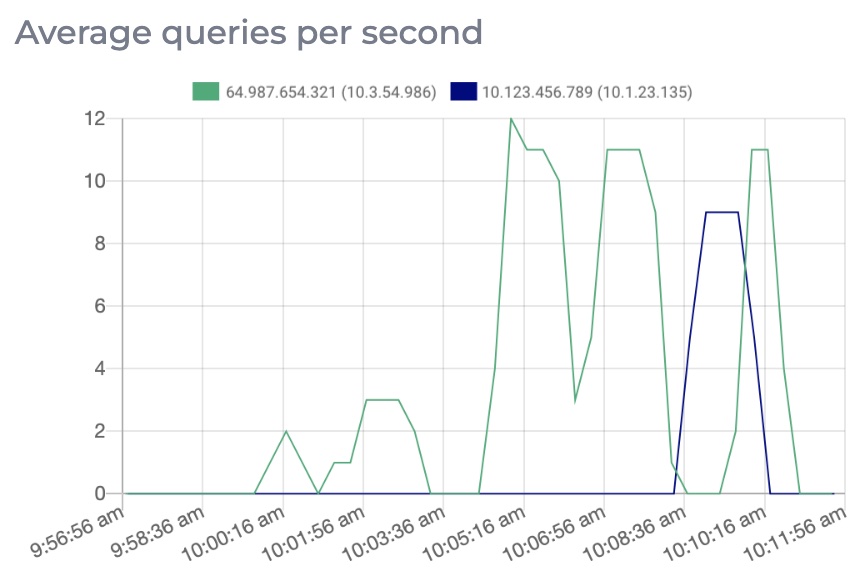
Average Queries per Second
This metric specifies the average number of queries against a given database processed by PgBouncer each second. Each data point reflects the average over a single metric collection interval.
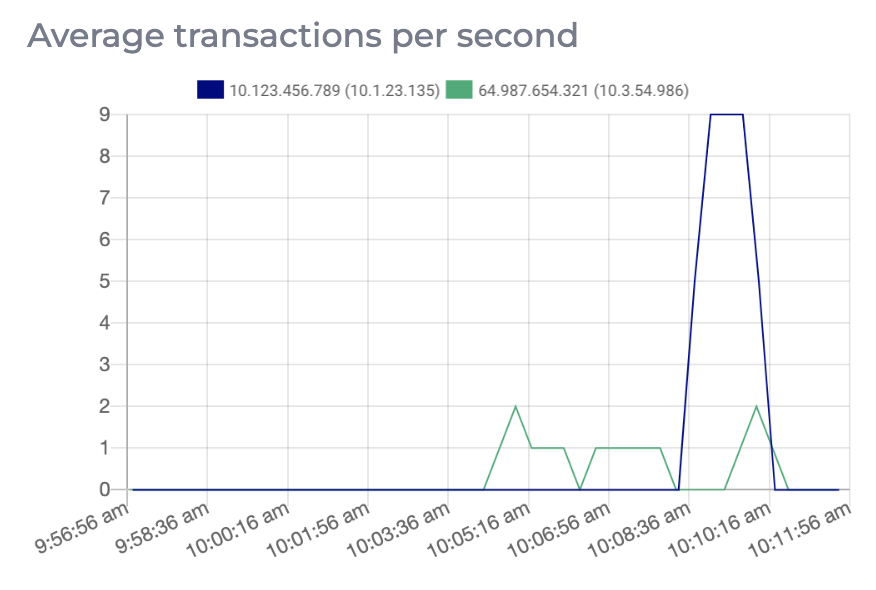
Average Transactions per Second
This metric specifies the average number of transactions against a given database processed by PgBouncer each second. Each data point reflects the average over a single metric collection interval.
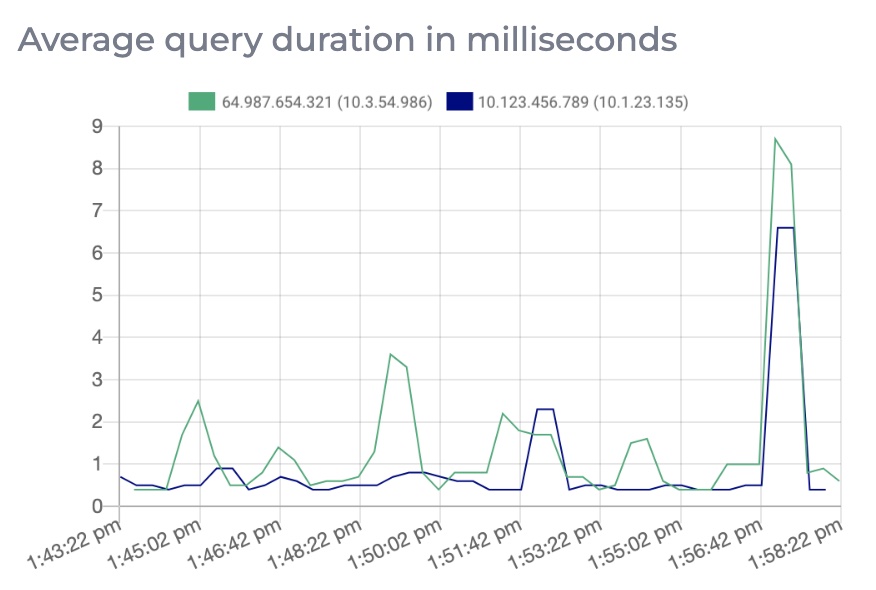
Average Query Duration
This metric specifies the average time taken in milliseconds for a client to complete a single query on a given database via PgBouncer. Each data point reflects the average over a single metric collection interval.
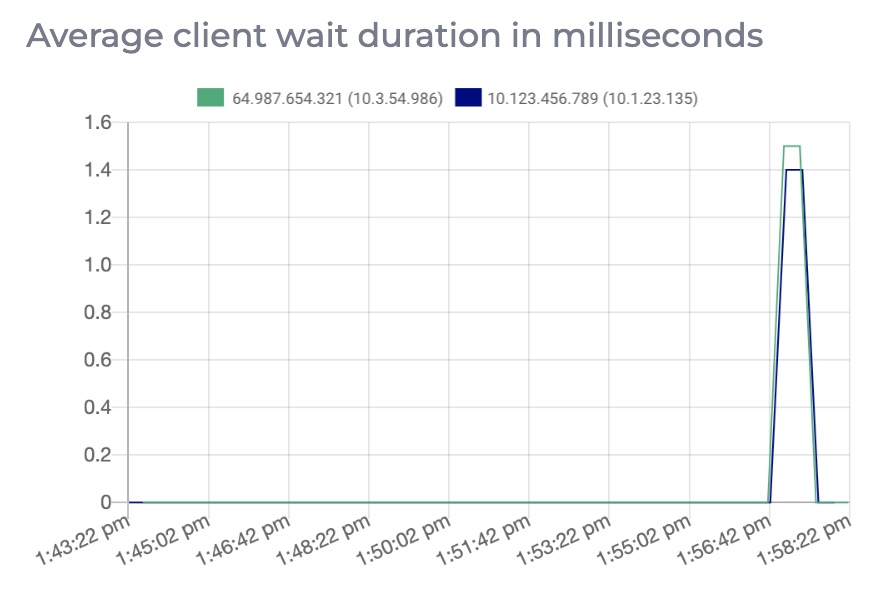
Average Client Wait Duration
This metric specifies the average length of time in milliseconds that a client spends waiting for a connection to the PostgreSQL server to be allocated to it from its respective connection pool, for connections on a given database. Each data point reflects the average over a single metric collection interval.
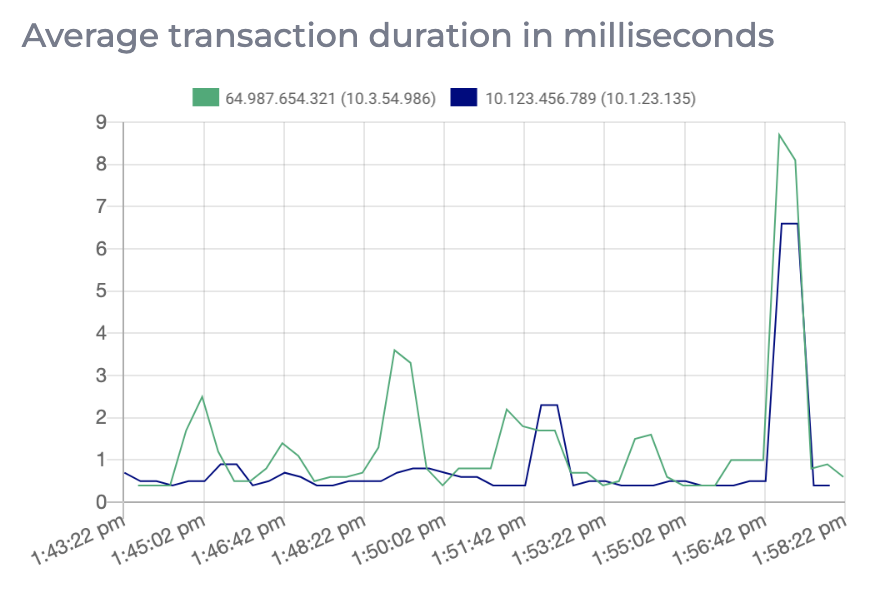
Average Transaction Duration
This metric specifies the average time taken in milliseconds for a client on a given database to complete a single transaction via PgBouncer. Each data point reflects the average over a single metric collection interval.
PgBouncer – Connection Pool Level Metrics
This metrics group includes nine separate metrics:
- Number of client connections that are linked to a server connection and are able to process queries
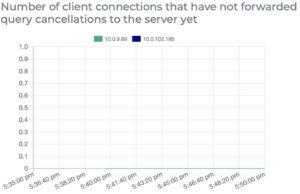
- Number of client connections that have not forwarded query cancellations to the server yet
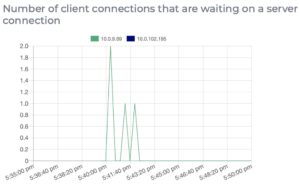
- Number of client connections that are waiting on a server connection
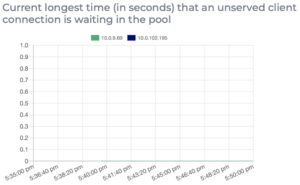
- Current longest time (in seconds) that an unserved client connection is waiting in the pool
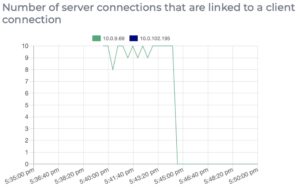
- Number of server connections that are linked to a client connection
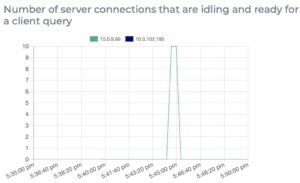
- Number of server connections that are idling and ready for a client query
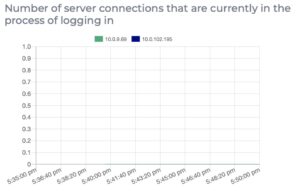
- Number of server connections that are currently in the process of logging in
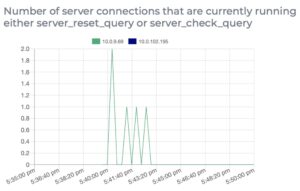
- Number of server connections that are currently running either server_reset_query or server_check_query
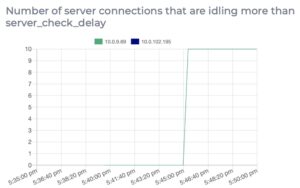
- Number of server connections that are idling more than server_check_delay
Number of client connections that are linked to a server connection and are able to process queries
This metric specifies the number of client connections that are currently linked to a server connection and are able to process queries from all connection pools.

Number of client connections that have not forwarded query cancellations to the server yet
This metric specifies the number of client connections that have not forwarded query cancellations to the server yet from all connection pools.
Number of client connections that are waiting on a server connection
This metric specifies the number of client connections that are waiting on a server connection from all connection pools.
Current longest time (in seconds) that an unserved client connection is waiting in the pool
This metric specifies the current longest time that an unserved client connection is waiting in the connection pools measured in seconds.
Number of server connections that are linked to a client connection
This metric specifies the number of server connections that are linked to a client connection from all connection pools.
Number of server connections that are idling and ready for a client query
This metric specifies the number of server connections that are idling and ready for a client query from all connection pools.
Number of server connections that are currently in the process of logging in
This metric specifies the number of server connections that are currently in the process of logging in from all connection pools.
Number of server connections that are currently running either server_reset_query or server_check_query
This metric specifies the number of server connections that are currently running either server_reset_query or server_check_query. These two queries can be customised in PgBouncer configuration file.
Number of server connections that are idling more than server_check_delay
This metric specifies the number of server connections that are idling more than server_check_delay. They would need server_check_query to run on them before they can be used again. The query and the delay can be customised in PgBouncer configuration file.
PgBouncer – Availability
This metrics group includes a single metric:
- PgBouncer availability
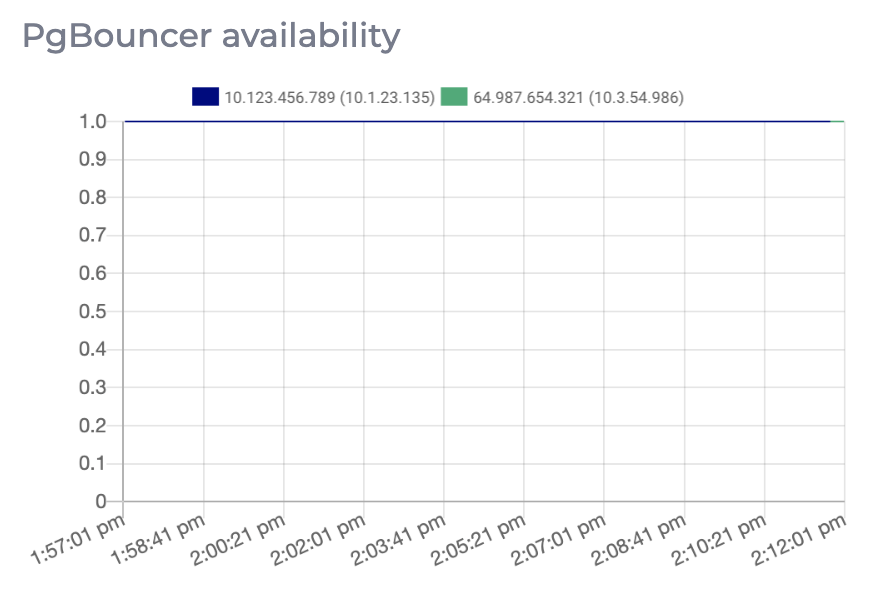
PgBouncer availability
This metric reflects whether PgBouncer is running on a given node. A value of 1 means that the service is running, whereas a value of 0 means that it is not.