Per-Topic Metrics
In addition to cluster wide metrics, some metrics are also collected for each individual Kafka topic in the cluster. The categories of per-topic metrics available are:
- Messages In
- Bytes In/Out
- Message Conversions
- Failed Requests
Note: Metrics discussed on this page display results as produced by Kafka. Instaclustr’s monitoring system does not aggregate these results.
Messages In
The Messages In metric group contains metrics regarding the amount of messages coming in to each topic. The metrics available are:
- Messages In
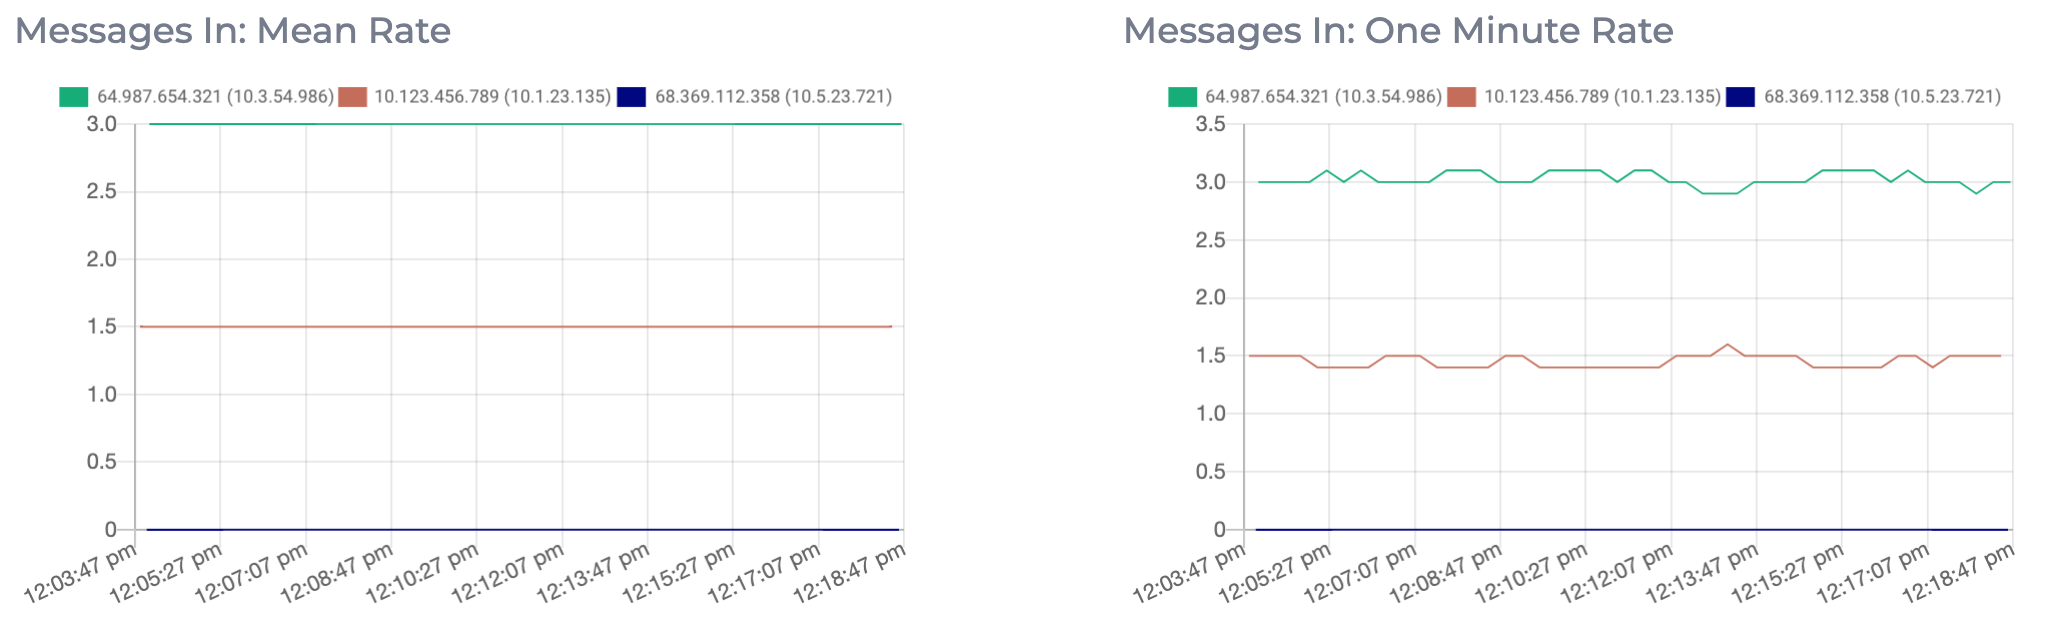
Messages In
The Messages In metric displays the mean rate and one minute rate of incoming messages per second to each topic. This metric will increase as the volume and frequency of messages being sent to the topic increases. This metric can be used to determine how much load is being generated by individual topics. If you are hitting the limit of how much your cluster can process, you should consider increasing the capacity of your cluster. This can be achieved by either adding new nodes to the cluster or by upgrading the individual nodes in the cluster. See here for more information on expanding your cluster.
Bytes In/Out
The Bytes In/Out metric group contains metrics regarding the amount of bytes coming in to and out of each topic. The metrics available are:
- Bytes In
- Bytes Out
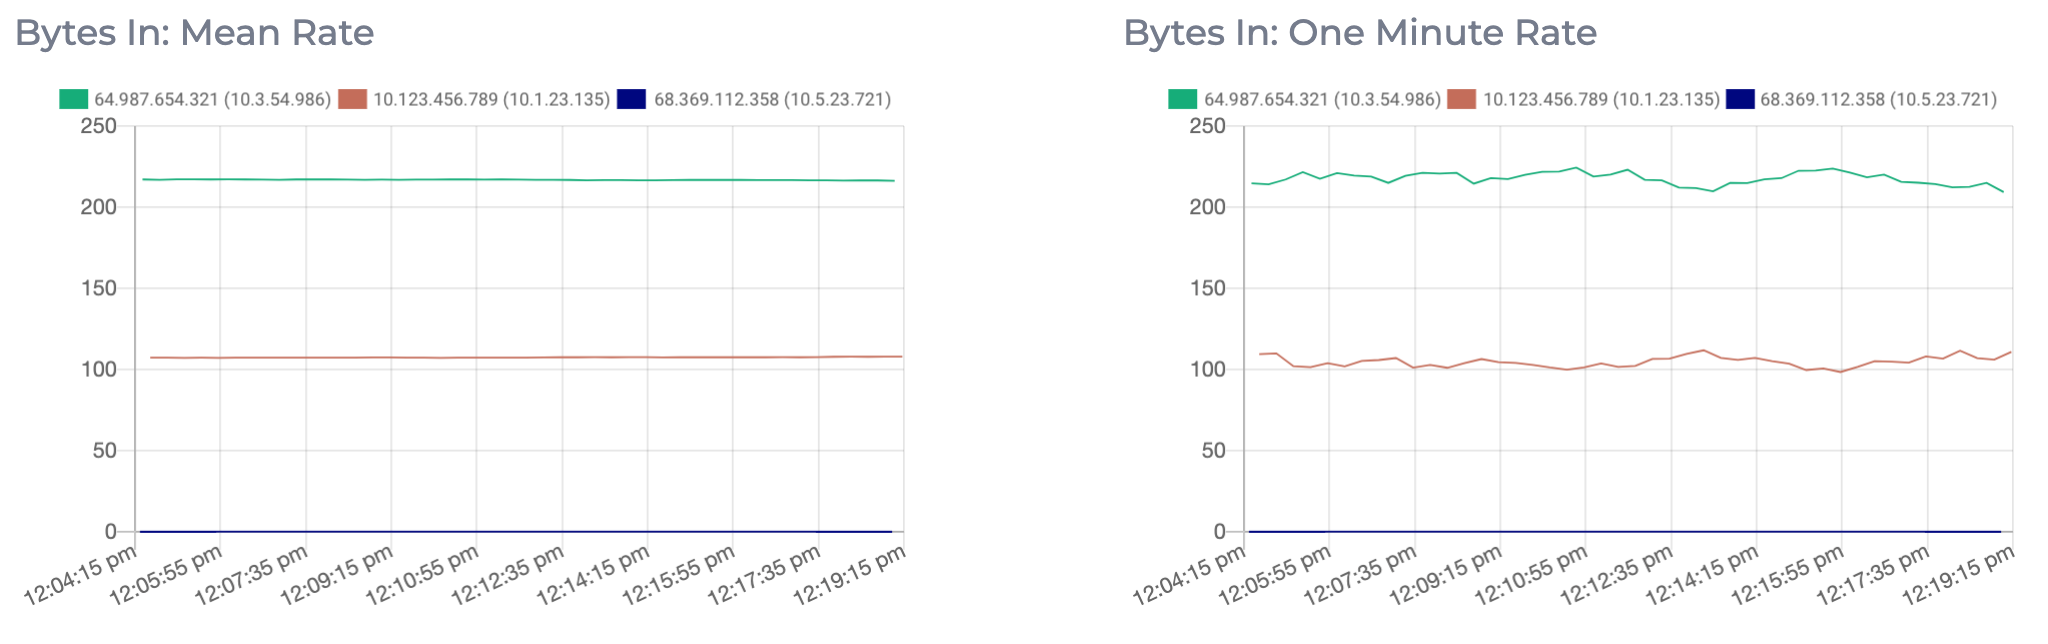
Bytes In
The Bytes In metric displays the mean rate and one minute rate of incoming bytes per second to each topic. This metric will increase as the volume and frequency of messages being sent to the topic increases. This metric can be used to determine how much load is being generated by individual topics, and can help you decide to enable end-to-end message compression. See here for more information on cluster compression settings. If you are hitting the limit of how much your cluster can process, you should consider increasing the capacity of your cluster. This can be achieved by either adding new nodes to the cluster or by upgrading the individual nodes in the cluster. See here for more information on expanding your cluster.
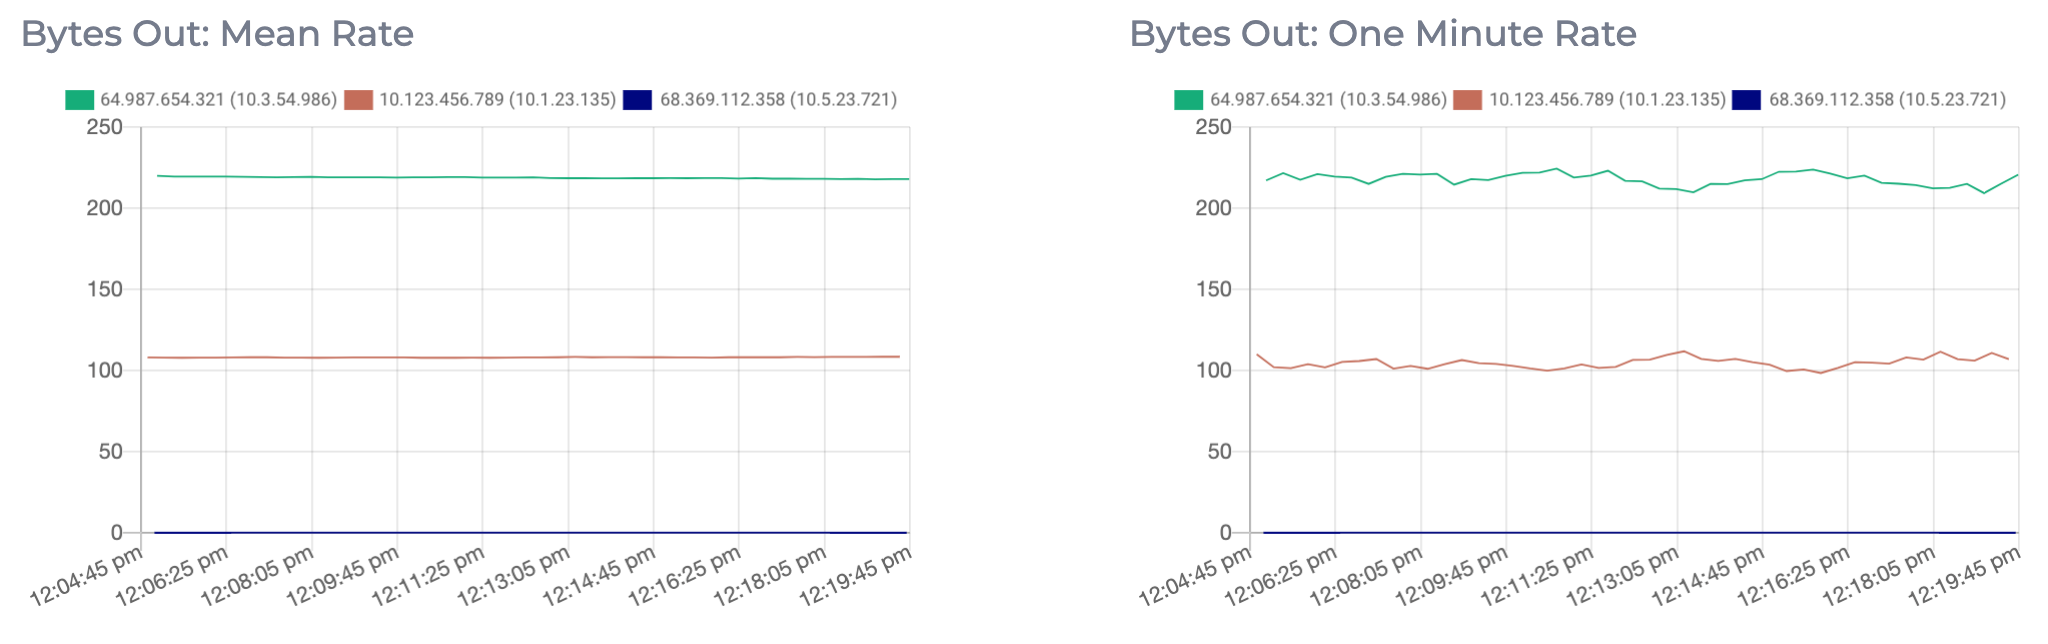
Bytes Out
The Bytes Out metric shows the mean rate and one minute rate of outgoing bytes per second from each topic. This metric will increase as the volume and frequency of messages being sent to and consumed from the topic increases. This metric can be used to determine how much load is being generated by individual topics, and can help you decide to enable end-to-end message compression.See here for more information on cluster compression settings. If you are hitting the limit of how much your cluster can process, you should consider increasing the capacity of your cluster. This can be achieved by either adding new nodes to the cluster or by upgrading the individual nodes in the cluster. See here for more information on expanding your cluster.
Message Conversions
The Message Conversions metric group contains metrics regarding the amount of message format conversions occurring for each topic. The metrics available are:
- Fetch Message Conversions
- Produce Message Conversions
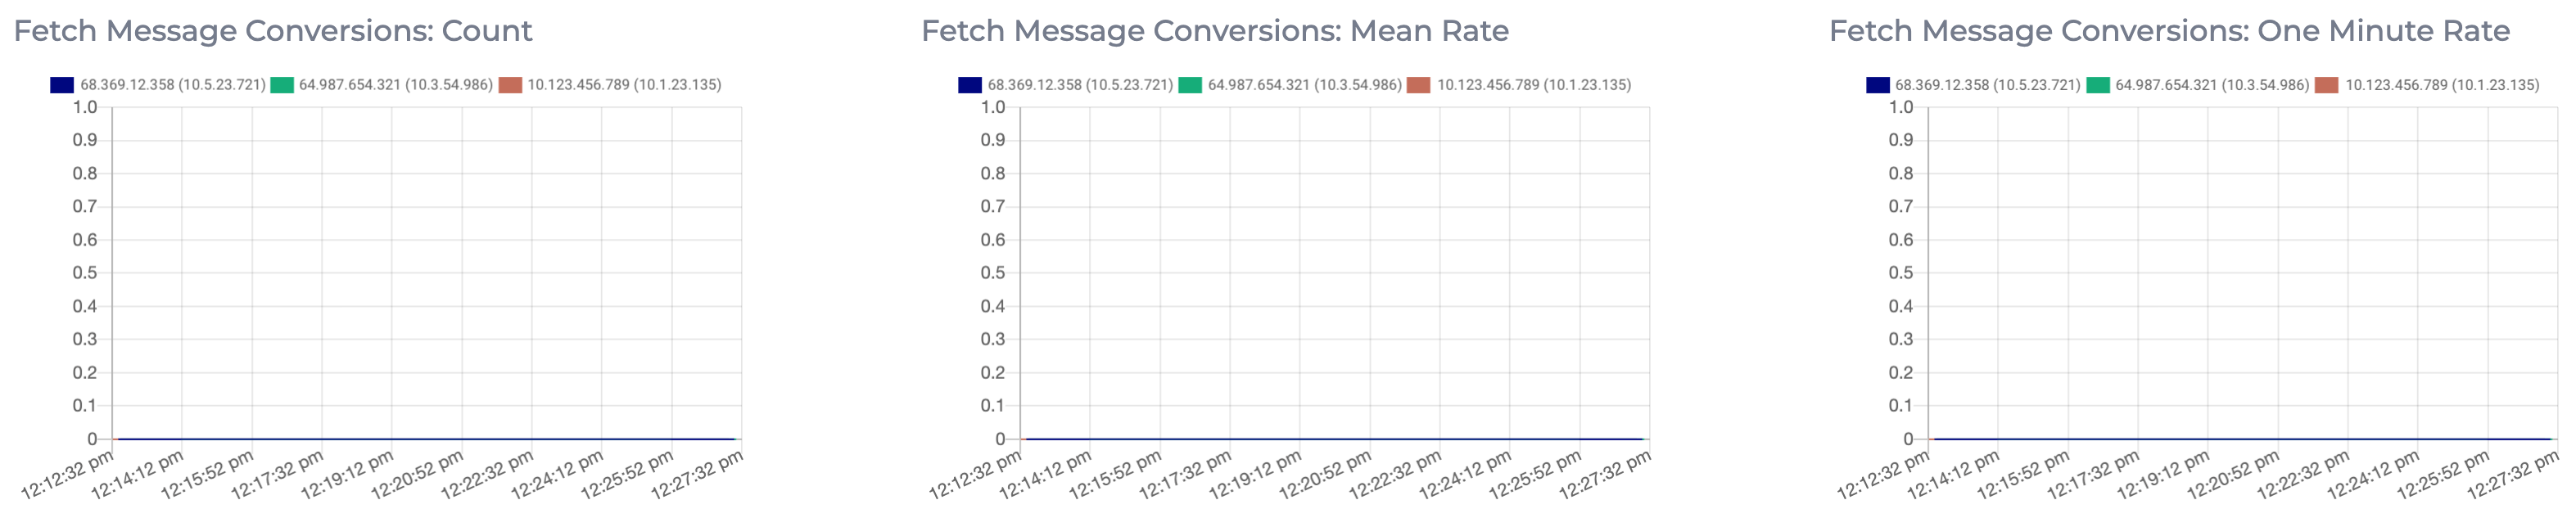
Fetch Message Conversions
The Fetch Message Conversions metric displays the one minute rate, mean rate, and the number of messages from consumer requests to get new data that require message format conversion for each topic per second. Message conversions introduce a processing overhead as messages between the Kafka clients and brokers require conversion in order to be understood by both parties. Any fetch message conversions being performed indicates that some Kafka consumers are using a different version of Kafka to the Kafka brokers. To avoid unnecessary message conversions, ensure all Kafka clients are using the same version of Kafka as the Kafka brokers.
Expected value: 0
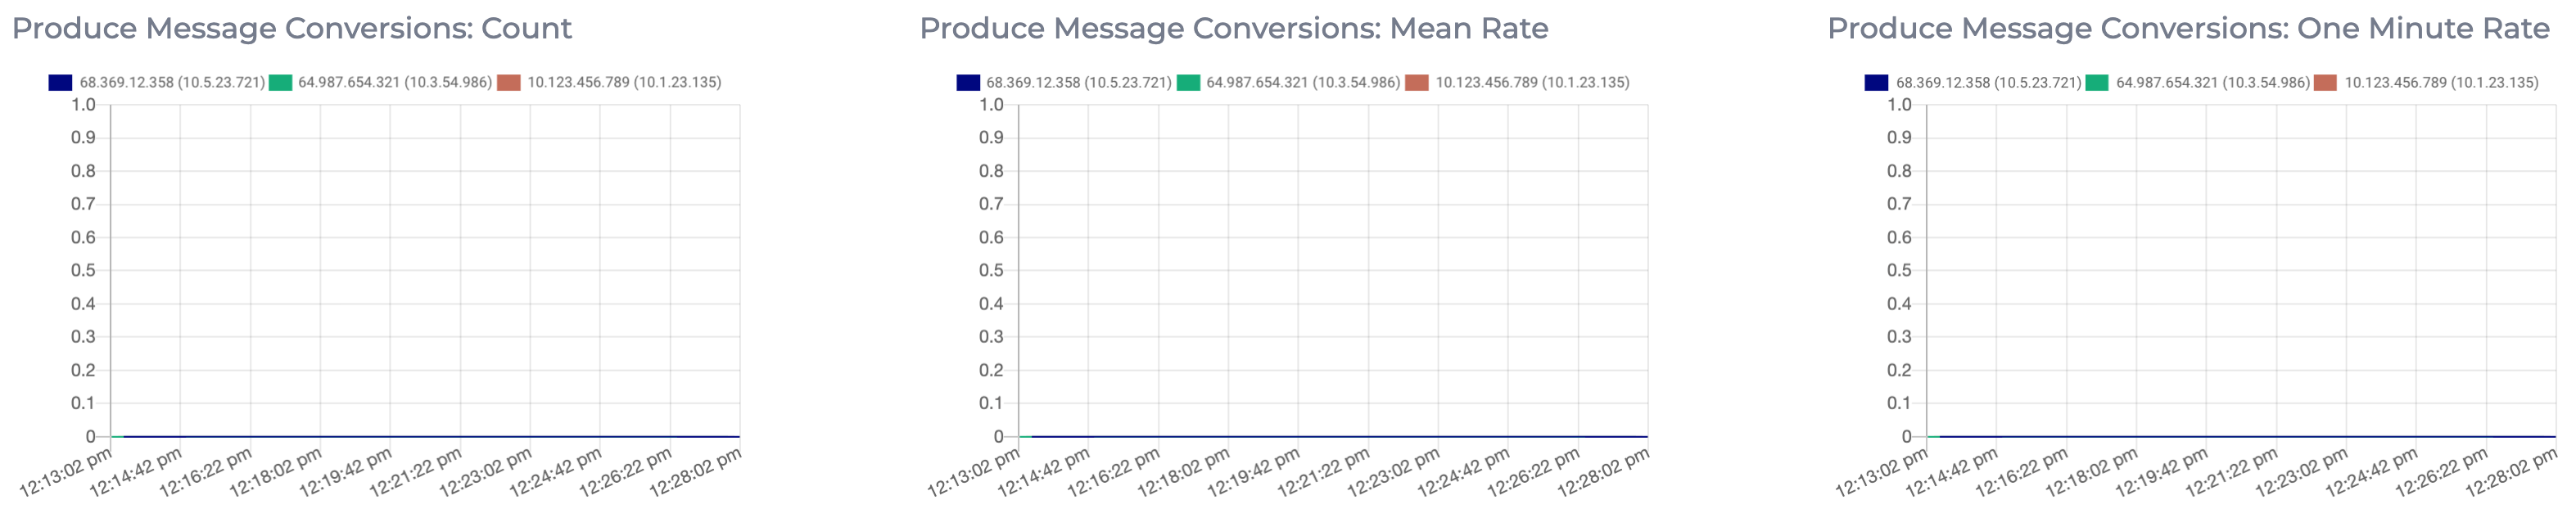
Produce Message Conversions
The Produce Message Conversions metric displays the one minute rate, mean rate, and the number of messages from producer requests to send data that require message format conversion for each topic per second. Message conversions introduce a processing overhead as messages between the Kafka clients and brokers require conversion in order to be understood by both parties. Any produce message conversions being performed indicates that some Kafka producers are using a different version of Kafka to the Kafka brokers. To avoid unnecessary message conversions, ensure all Kafka clients are using the same version of Kafka as the Kafka brokers.
Expected value: 0
Failed Requests
The Failed Requests metric group contains metrics regarding the number of failed requests occurring on each topic. The metrics available are:
- Failed Fetch Request
- Failed Produce Request
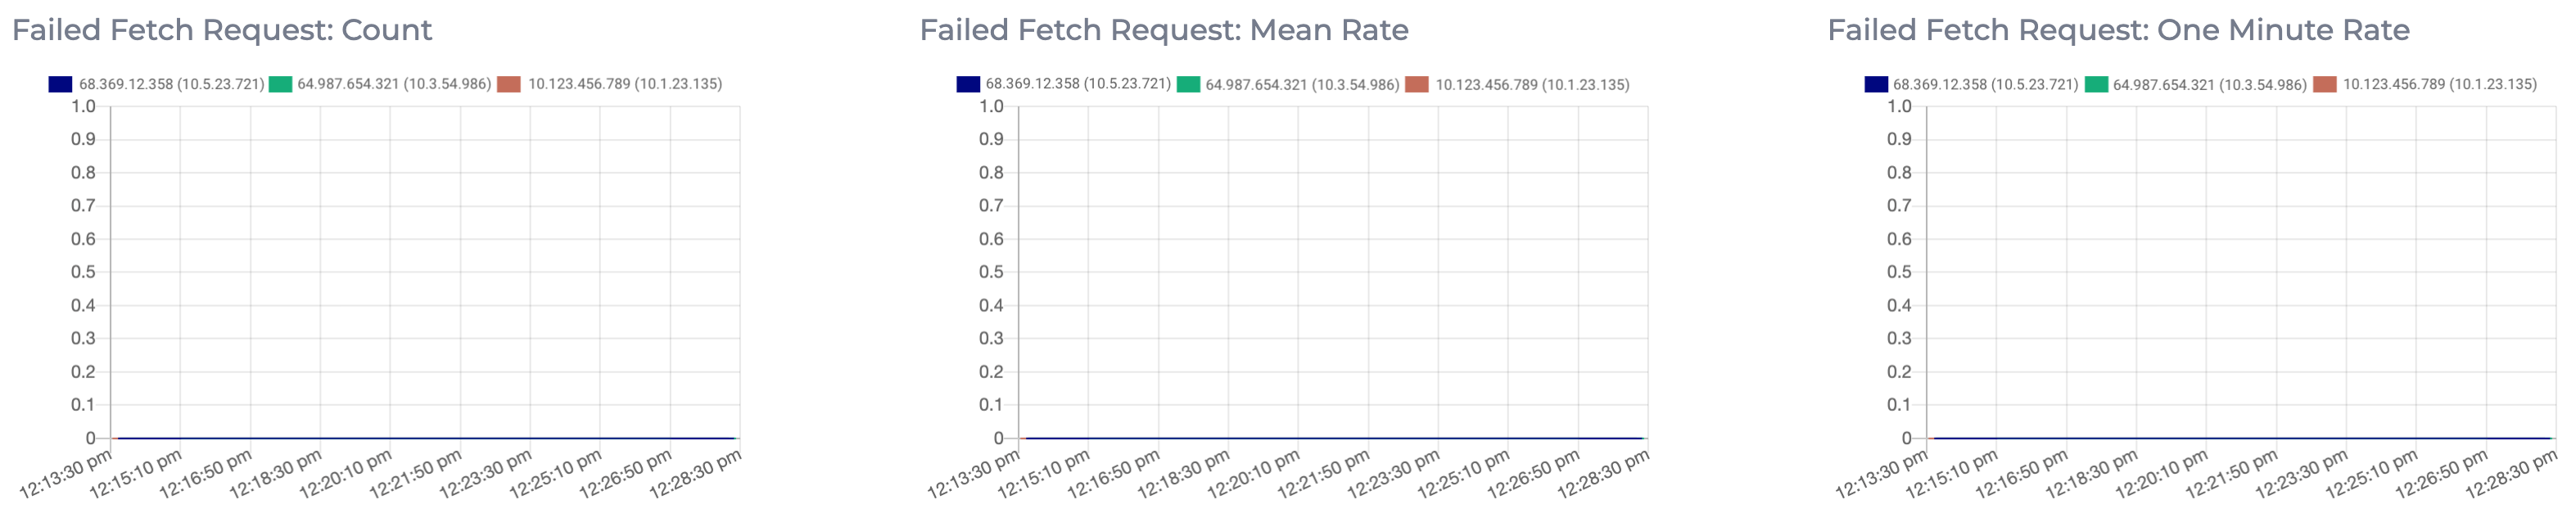
Failed Fetch Request
The Failed Fetch Request metric displays the count, mean rate, and one minute rate of failed fetch requests to each topic per second. A failed fetch request occurs when a problem is encountered when processing a fetch request. This could be for a variety of reasons, but the most common cause is consumer requests timing out.
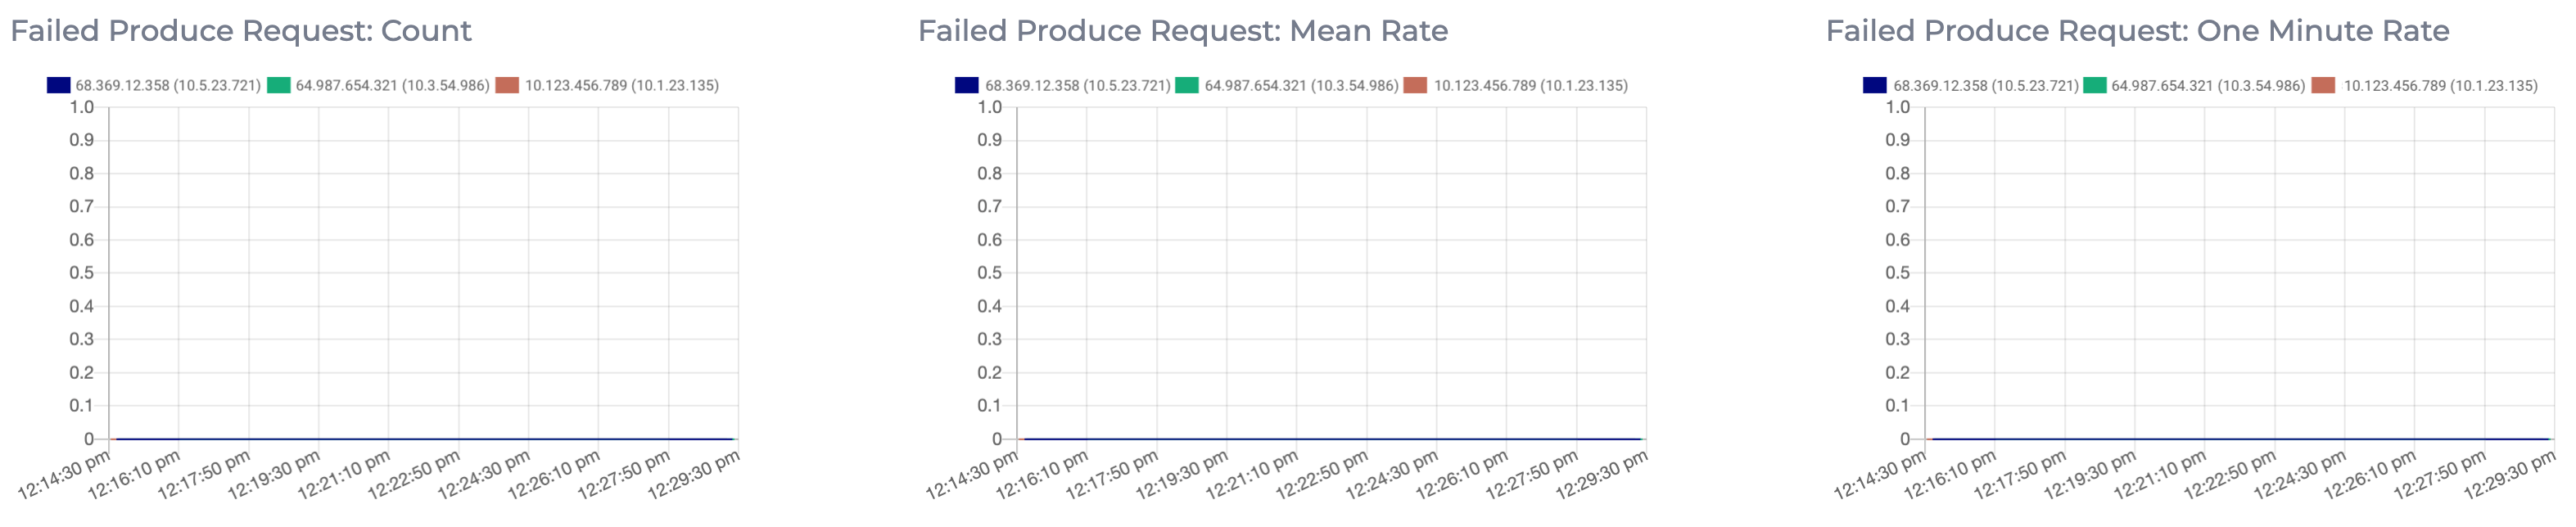
Failed Produce Request
The Failed Produce Request metric displays the count, mean rate, and one minute rate of failed produce requests to each topic per second. A failed produce request occurs when a problem is encountered when processing a produce request. This could be for a variety of reasons, however some common reasons are:
- The destination topic doesn’t exist (if auto-create is enabled then subsequent messages should be sent successfully).
- The message is too large.
- The producer is using request.required.acks=all or –1, and fewer than the required number of acknowledgements are received.
For more information on what’s causing failed produce requests, see your Kafka client’s logs.