Client Reads and Writes Latency
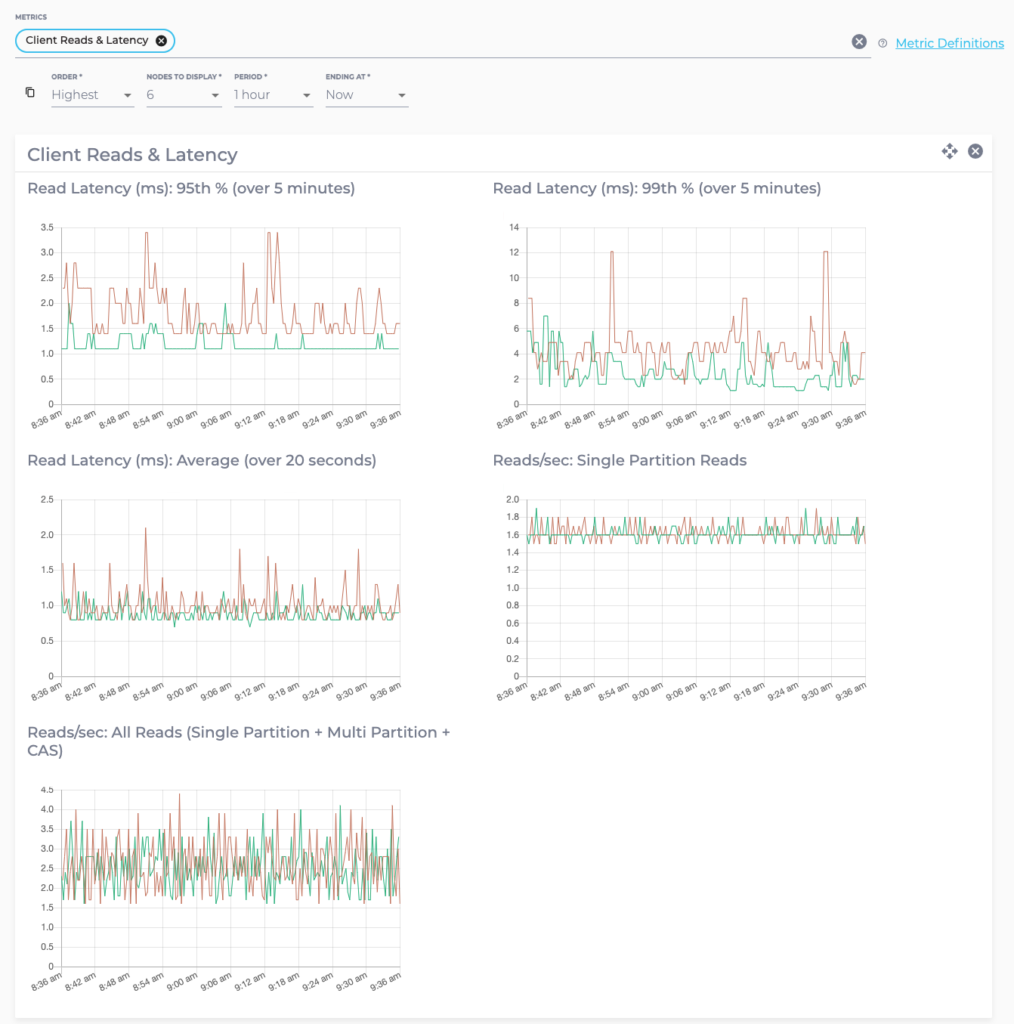
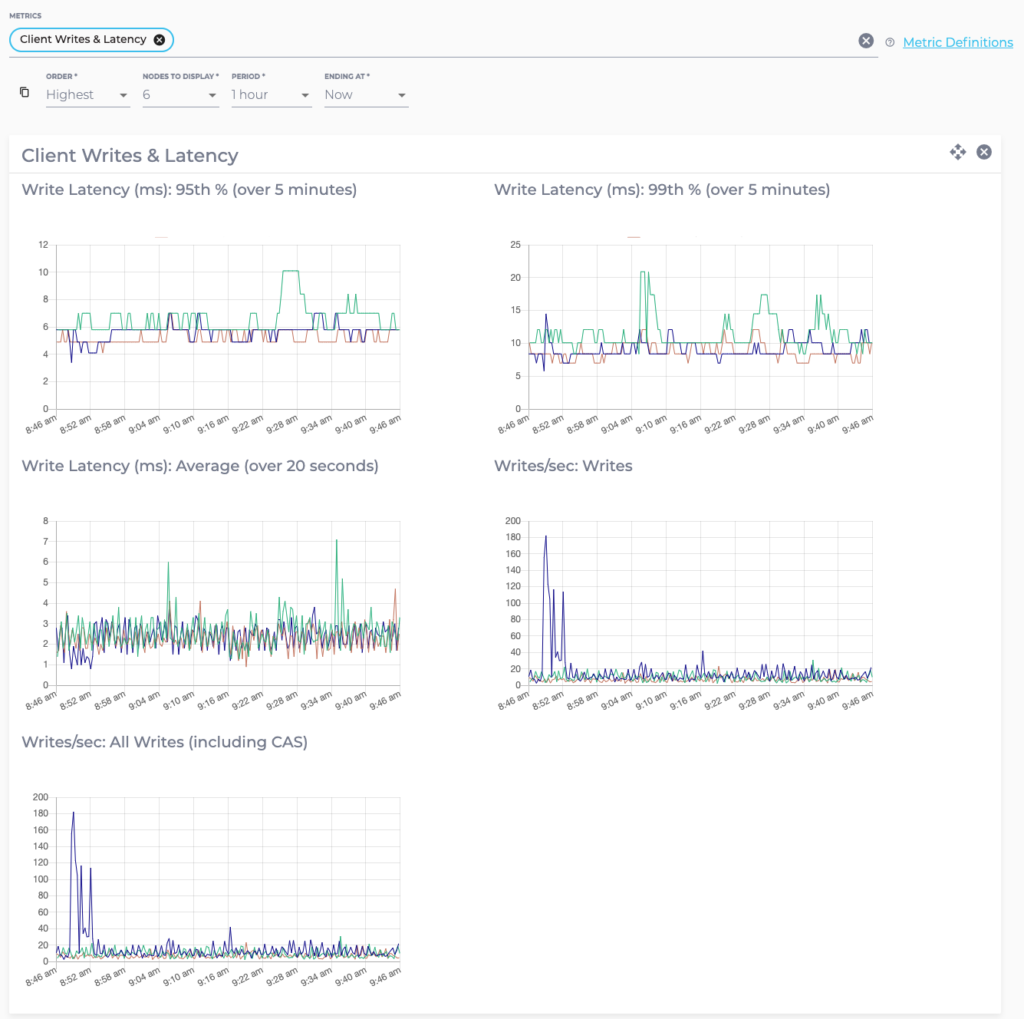
You can view monitoring information about the Reads and Writes of your nodes by accessing the Client Reads & Latency and Client Writes & Latency options. This will display the following metrics for each column family in the cluster:
- Read/Write Latency: The average, 95th percentile, and 99th percentile.
- Reads/Writes: The average number of local Read or Write requests processed per second, by each node in the cluster.

For example, the Read Latency (ms): 95th % (over 5 minutes) metric is the read latency for which 95% of sampled values fall below per node in the cluster (over the last five minutes). A similar metric is the 99th percentile latency, which shows the latency value 99% of sampled values fall under. The Average latency is also displayed.
High latency values may indicate a cluster at the edge of its processing capacity, issues with the data model such as poor choice of partition key or high levels of tombstones or issues with the underlying infrastructure. If you require assistance diagnosing the source of latency issues then please contact Instaclustr Support.
The reads and writes per second metrics show the number of reads and writes per second completed by a node averaged over 20 second intervals. Please note that client requests are when the node serves as a coordinator for the operation, as opposed to local requests where the node actually reads or writes the data.

The number of reads and writes per second is a good indicator of the amount of load that a node is sustaining. Increases in load above the available capacity of the node may result in increased latency of operations and, eventually, timeout errors.
Should you have any queries regarding the processing capacity of your cluster please contact Instaclustr Support.