Request Metrics
The Request Metrics metric group contains information regarding different types of request to and from the cluster. The metrics available are:
- Fetch Consumer Request Total Time
- Fetch Follower Request Total Time
- Produce Request Total Time
Note: Metrics discussed on this page display results as produced by Kafka. Instaclustr’s monitoring system does not aggregate these results.
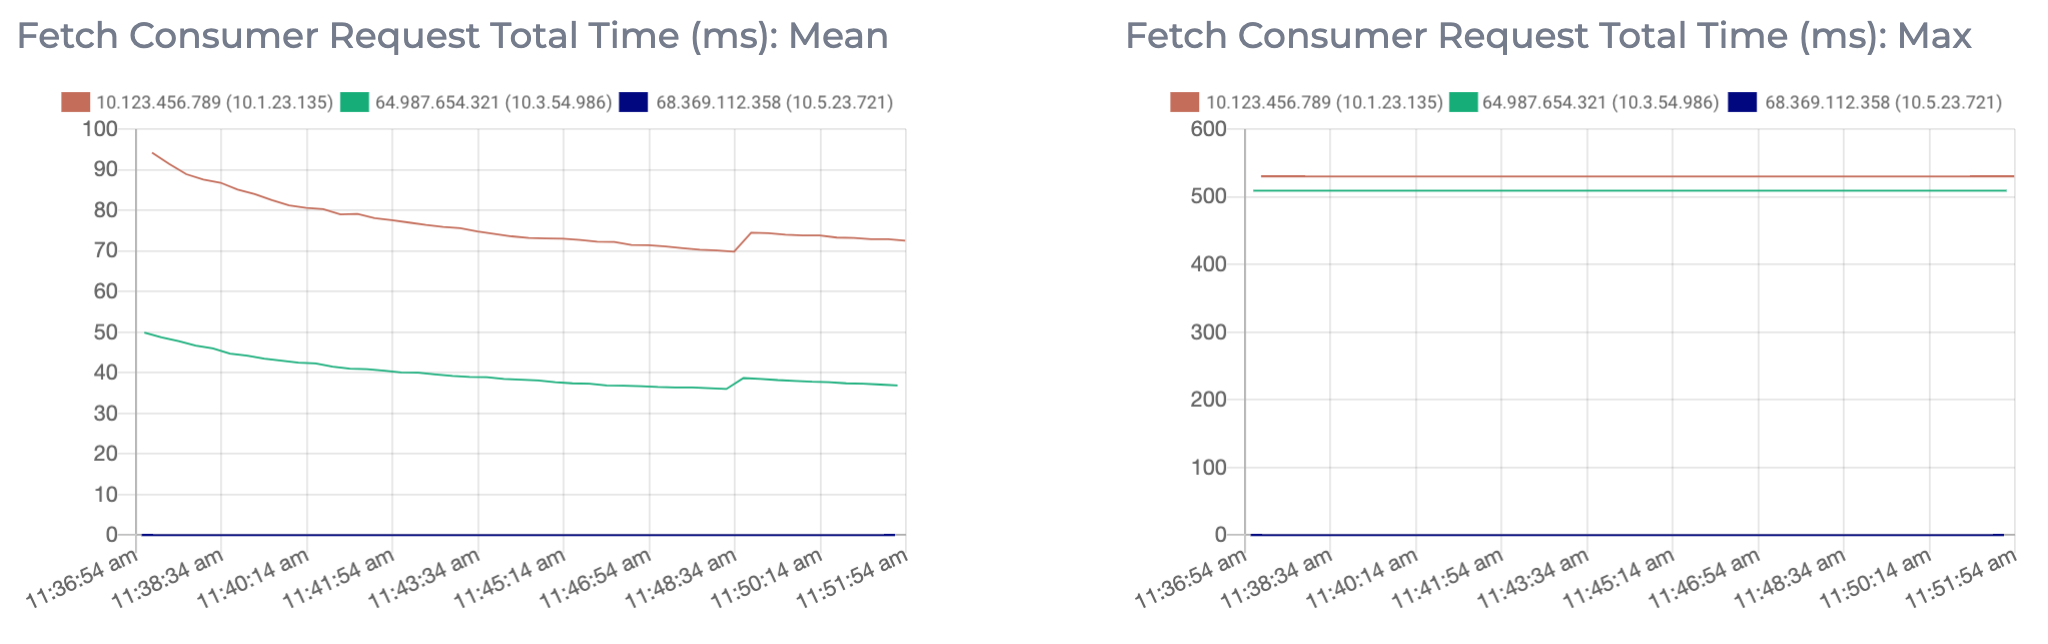
Fetch Consumer Request Total Time
The Fetch Consumer Request Total Time metric shows the maximum and mean amount of time taken for processing, and the number of requests from consumers to get new data. This is the sum of time spent waiting in request, time spent being processed by the leader, time spent waiting for the leader to trigger sending the response (determined by fetch.min.bytes and fetch.wait.max.ms in the consumer configuration), and time taken to send the response. As this metric displays the sum time spent in various stages of the request, it can be hard to identify the cause of increased time. Some reasons for increased time taken could be: increased load on the node (creating processing delays), or perhaps requests are being held in purgatory for a long time (determined by fetch.min.bytes and fetch.wait.max.ms).
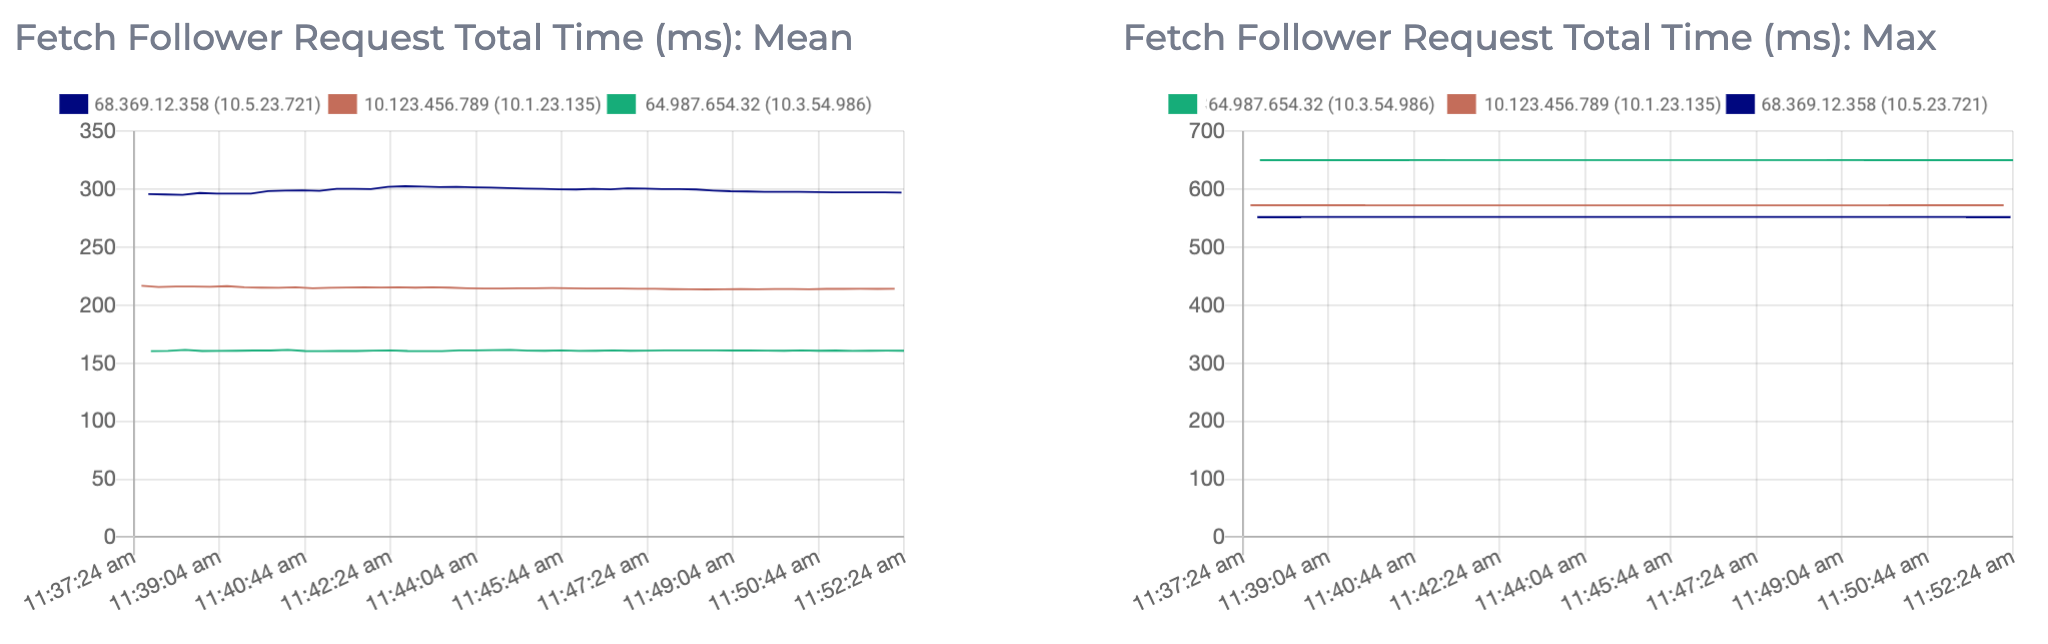
Fetch Follower Request Total Time
The Fetch Follower Request Total Time metric displays the maximum and mean amount of time taken while processing, and the number of requests to get new data from Kafka brokers that are followers of a partition. This is the sum of time spent waiting in request, time spent being processed by the leader, and time taken to send the response. As this metric displays the sum time spent in various stages of the request, it can be hard to identify the cause of increased time. Common causes of increased time taken are increased load on the node causing delays in processing the requests, or some partition replicas are overloaded or temporarily unavailable.
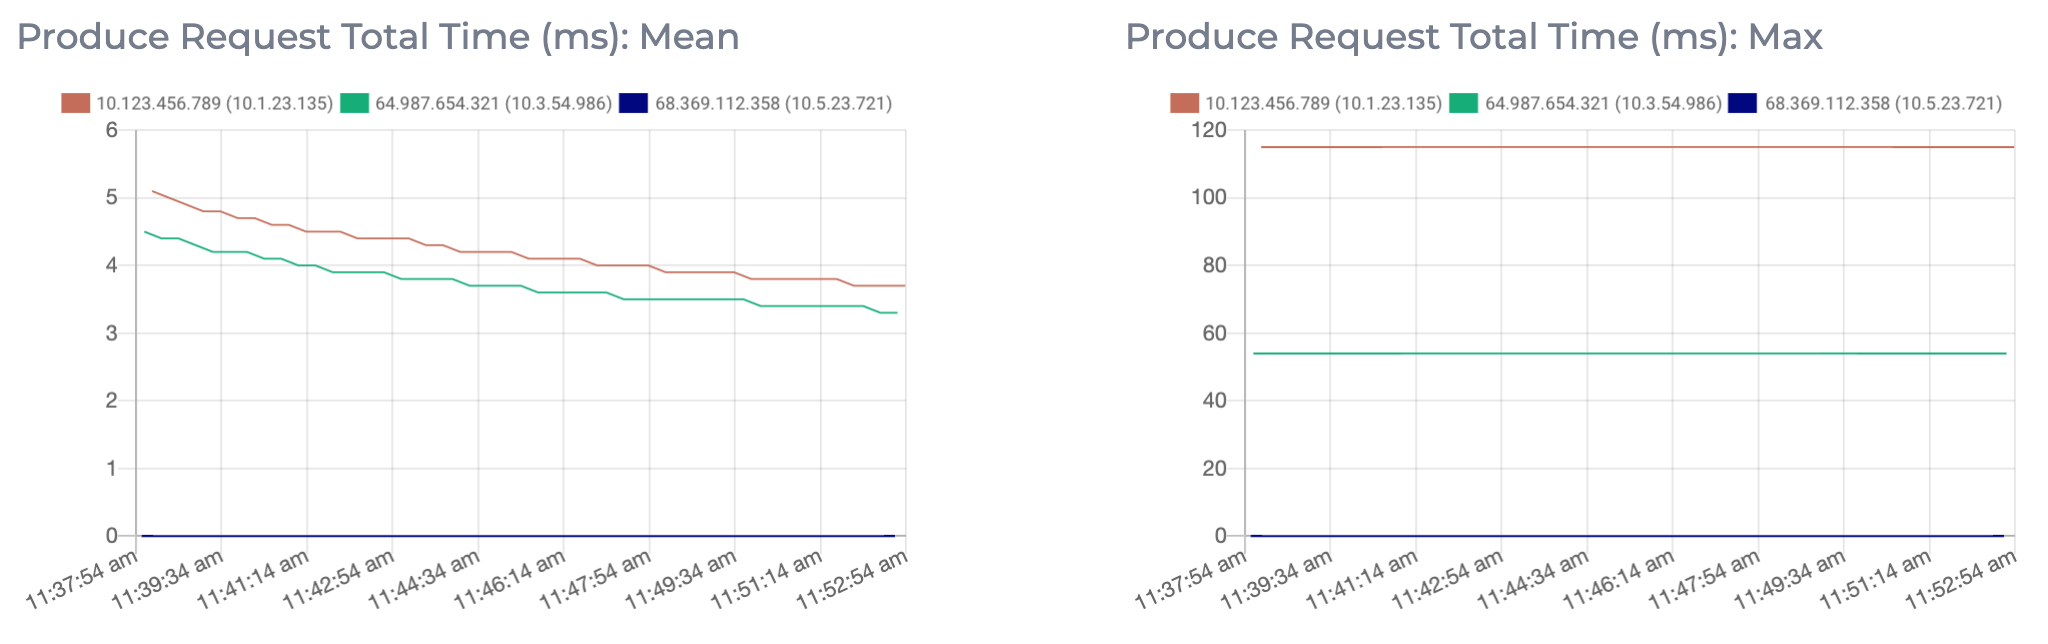
Produce Request Total Time
The Produce Request Total Time metric displays the maximum and mean amount of time taken for processing, and the number of requests from producers to send data. This is the sum of time spent waiting in request, time spent being processed by the leader, time spent waiting for follower response (if requests.required.acks = 1), and time taken to send the response. As this metric shows the sum time spent in various stages of the request, it can be hard to identify the cause of increased time. Some reasons for increased time taken could be: increased load on the node causing delays in processing the requests, or perhaps requests are being held in purgatory for a long time (if requests.required.acks = 1 or all).