Using the Instaclustr Monitoring API with Datadog
Instaclustr’s Monitoring API is designed to allow you to integrate the monitoring information from your Instaclustr managed cluster with the monitoring tool used for the entire application. Datadog (datadoghq.com) is a popular platform for monitoring a range of applications. This support documentation page will walk you through how to use the Instaclustr Monitoring API with Datadog.
At a high-level, the approach we will take in this page is to utilize a Prometheus server (for scraping the Instaclustr Prometheus service discovery endpoint) and Vector (to forward the data to the Datadog Metrics Explorer).
This page assumes that you have already setup and configured a Prometheus server with Instaclustr’s Monitoring API, and are already ingesting relevant metrics from Instaclustr.
Get Datadog API Key
- Have Datadog working/installed.
- Signup to Datadog
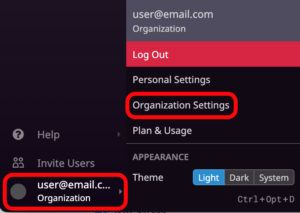
- Navigate to Organization Settings
- Go to the API Keys section and create a New Key.
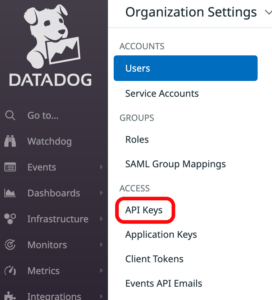
- This API Key will be used later in the Vector section of this guide.
Vector
Once you have your Datadog API key, the next step is installing and configuring Vector. This will need to run continuously for metrics processing. It can be installed and configured on the same instance as your Prometheus server.
Using Vector with Docker:
- Create a directory for holding your configuration files. For our examples we have used /etc/vector
- Create a configuration file called vector.toml with the following contents:
12345678[sources.input_prometheus]type = "prometheus_remote_write"address = "0.0.0.0:9091"[sinks.emit_datadog_metrics]type = "datadog_metrics"inputs = [ "input_prometheus" ]default_api_key = "${DATADOG_API_KEY_ENV_VAR}" - This file contains 2 parts:
- A source which pipes in your data from Prometheus, using a function called remote write.
- A sink which sends the metrics from the transform to Datadog.
- Optionally, in the middle of the source and sink, it can also have a transform which remaps and structures the data from the source. However, in this example it is not necessary.
- Pull the latest Vector Docker container with the command:
1docker pull timberio/vector:latest-debian - To simplify future commands with vector, it is recommended to use an alias:
1alias vector='docker run -i -e DATADOG_API_KEY_ENV_VAR="<Datadog Api Key>" -v /etc/vector/:/etc/vector/ --rm timberio/vector:latest-debian' - To check that Vector is now installed, run the command:
1vector --version
Prometheus
- In order to proceed you will need a running and configured Prometheus server. For a guide on how to do this, please see the Instaclustr Prometheus Setup Guide. For simplicity, you could also configure Prometheus on the same server you are running Vector on.
- In your prometheus.yml file, add the following section:
12remote_write:- url: "https://<Vector IP>:9091"
The <Vector IP> should be replaced with the routable IP address of your Vector container.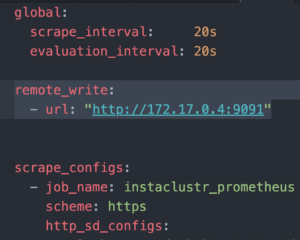
- In your Vector terminal window, run your vector file with the command:
1vector
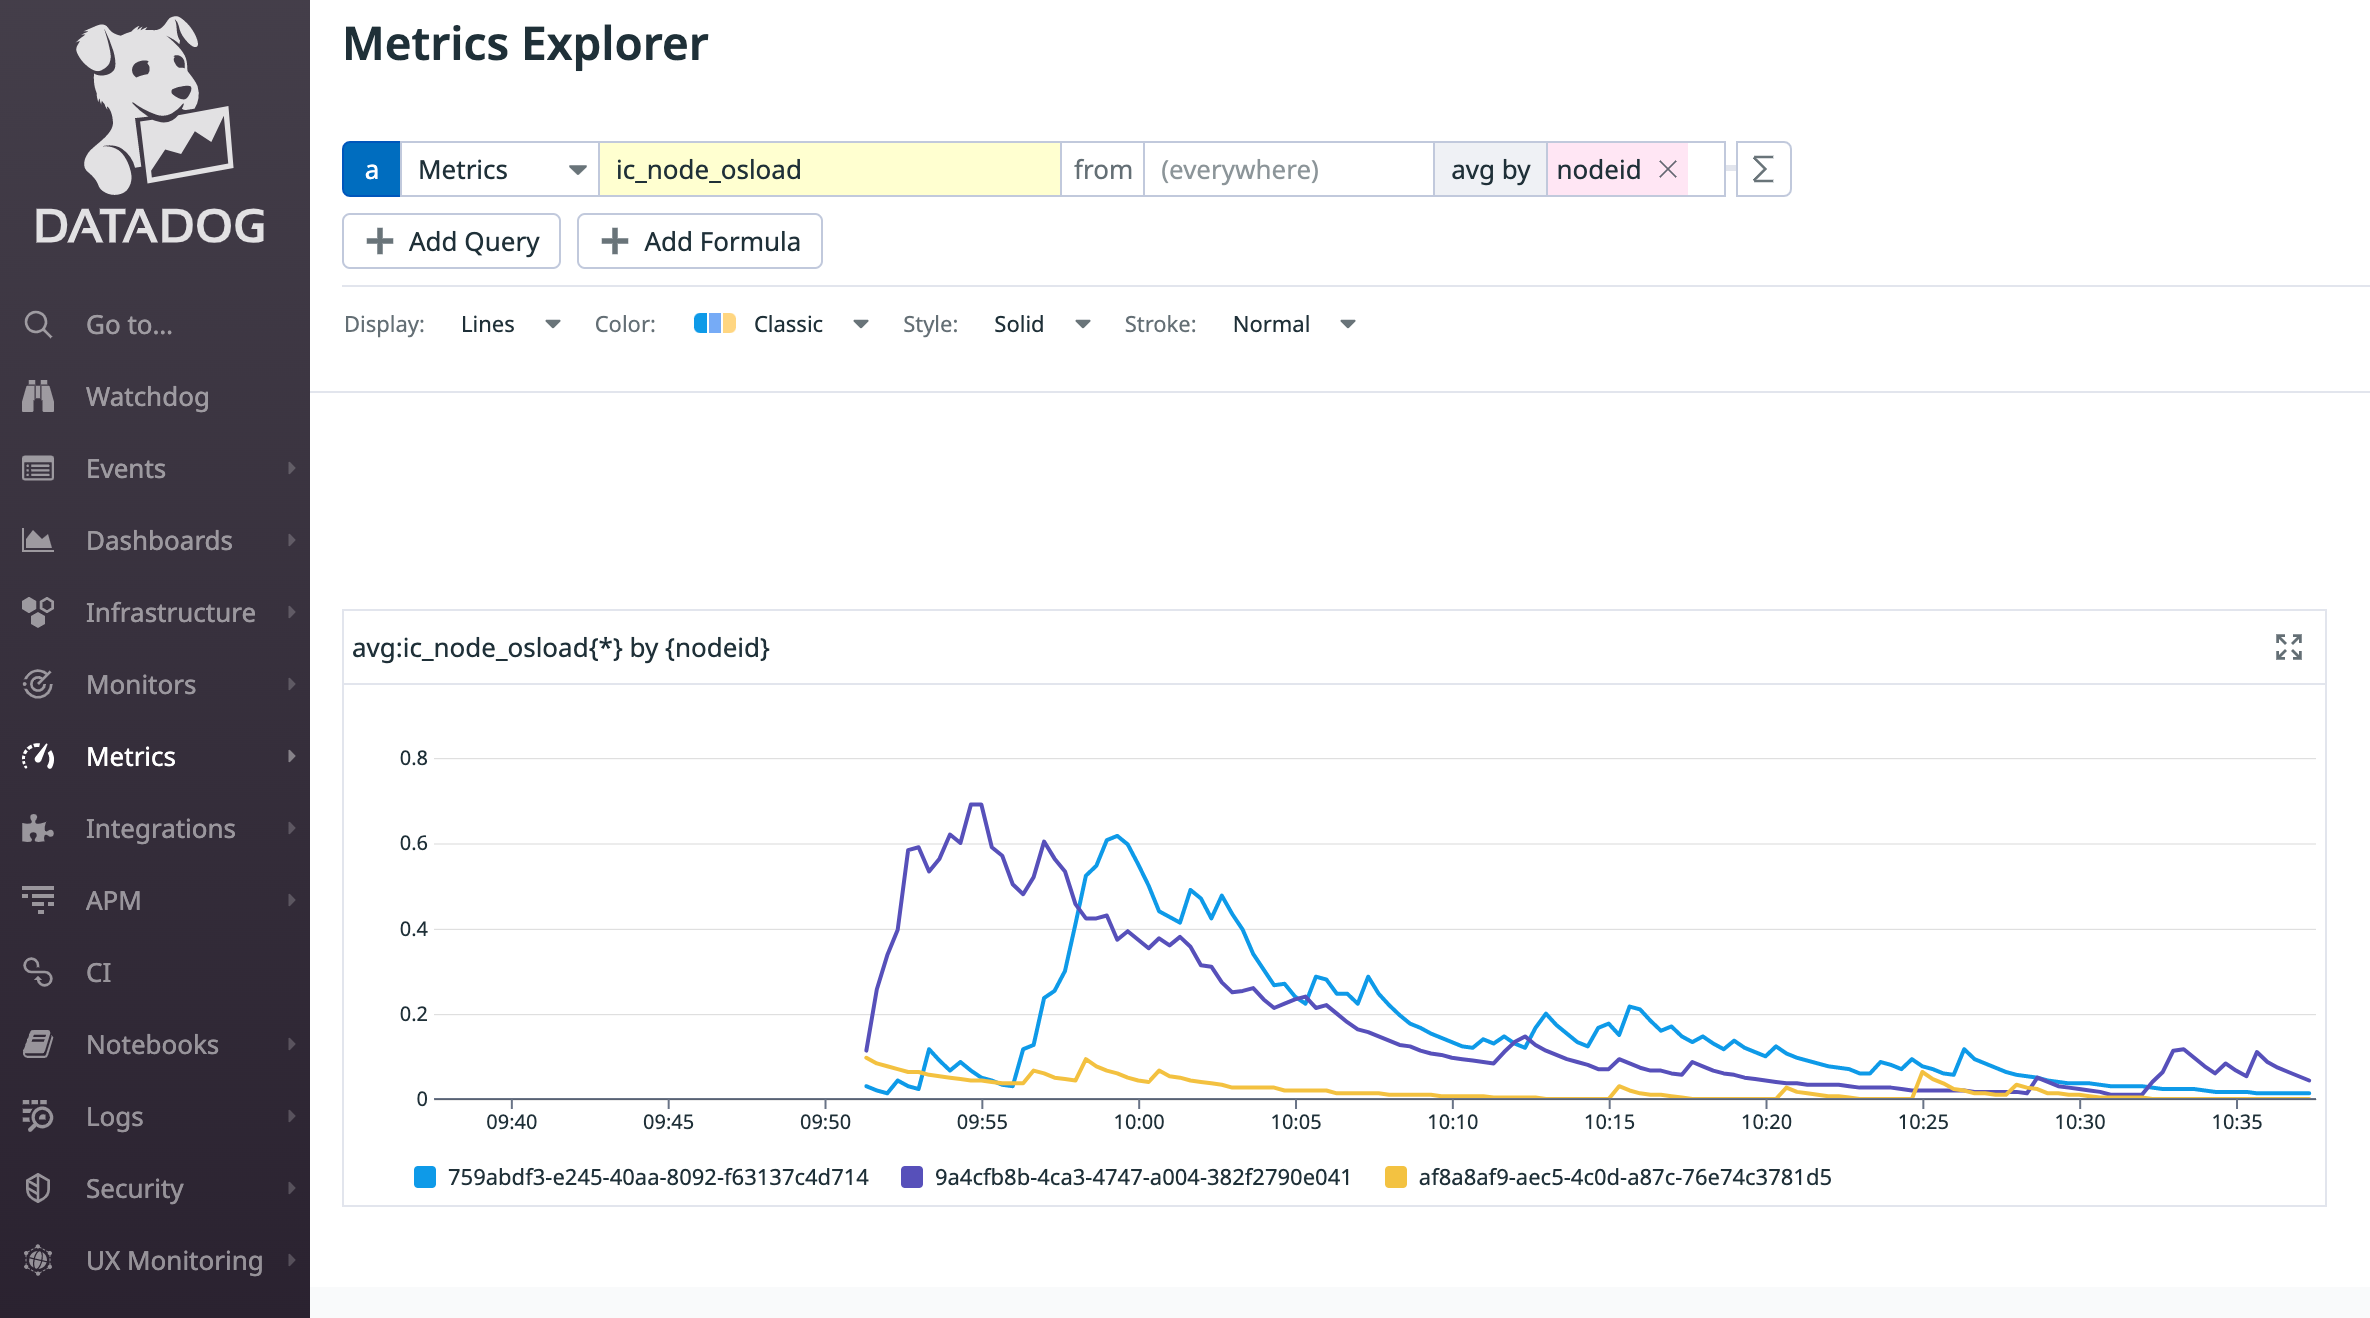
Note: for usage in production it is recommended to configure the Vector application through a service, such as Systemd. - Metrics should now be running in the Datadog Metrics Explorer. The names of Instaclustr’s metrics start with “ic_”, e.g., “ic_node_osload”.
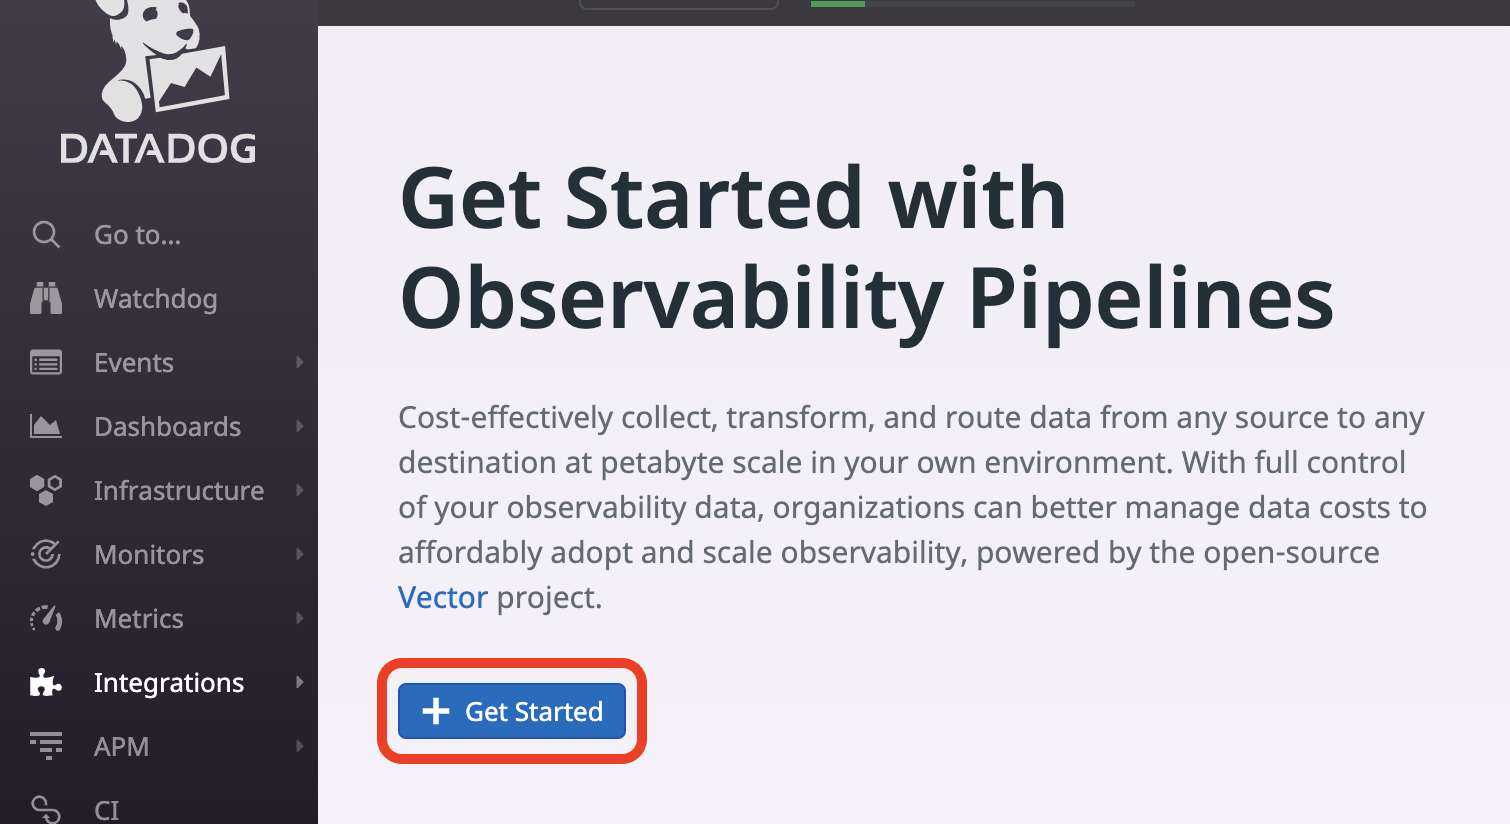
Observability Pipelines
- If you wish, you can also link your Vector pipeline to Datadog’s Observability Pipelines tool. Observability Pipelines enables you to monitor all of your Vector pipelines.
- Visit this Datadog official documentation in order to set up Observability Pipelines.
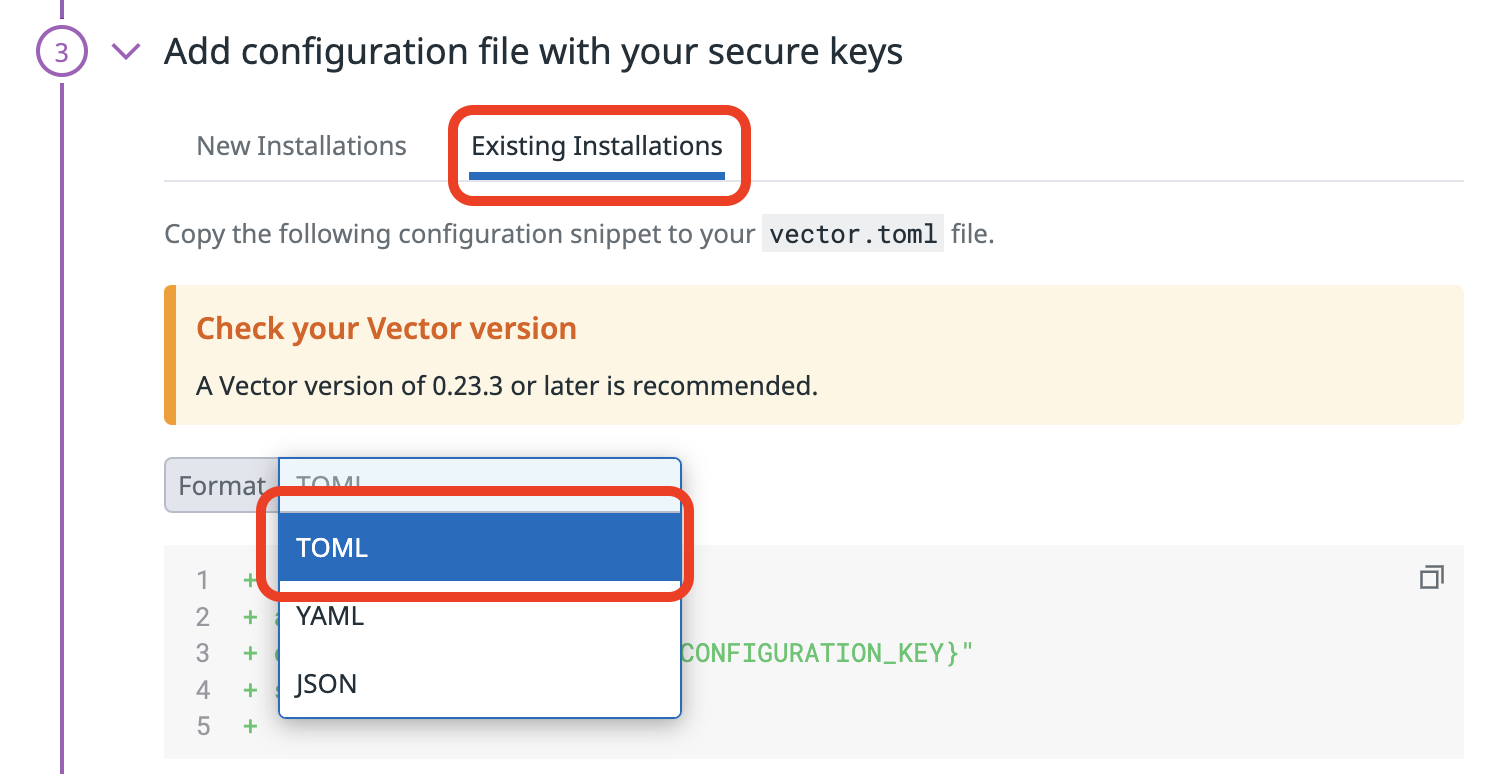
- The process will involve adding the following code to the top of your vector.toml file:
1234[enterprise]api_key = "<ObservabilityPiplinesDatadogAPIKey>"configuration_key = "<ObservabilityPiplinesDatadogAPIConfigurationKey>"site = "datadoghq.com"
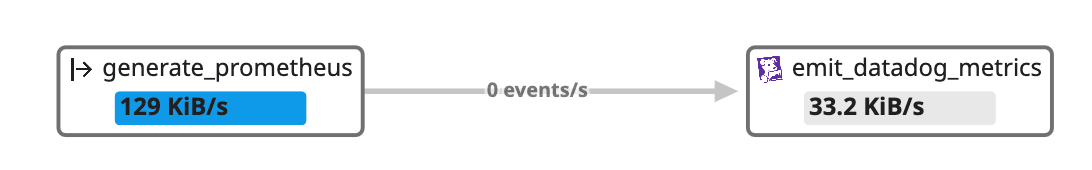
- To view your pipeline, in Datadog, go to Integrations and then Observability Pipelines.
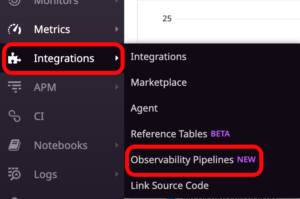
- Here you can view your pipeline and see if messages are in fact being sent through Vector from the Prometheus source, to the Datadog sink.