Spark MLlib Linear Regression Example
| For Legacy Support Purposes Only |
|---|
This article provides a step-by-step example of using Apache Spark MLlib to do linear regression illustrating some more advanced concepts of using Spark and Cassandra together. We will start from getting real data from an external source, and then we will begin doing some practical machine learning exercise. The data structure we plan to demonstrate in this article is Spark DataFrame. It allows users to conduct SQL/DataFrame queries [1] on the dataset which means it is more flexible than RDDs. The programming environment of this example is Zeppelin and the programming language is Scala. In this article, we assume that Zeppelin and a cluster have been set up and provisioned properly as shown in our previous tutorials, also, Cqlsh should be installed correctly on your local environment: “Getting started with Instaclustr Spark & Cassandra” , “Using Apache Zeppelin with Instaclustr Spark & Cassandra Tutorial” and “Connecting to Instaclustr Using Cqlsh”.
Find a suitable dataset
In real life when we want to buy a good CPU, we always want to check that this CPU reaches the best performance, and hence, we can make the optimal decisions in face of different choices. The real data set (cpu-performance) we get is from UCI Machine Learning Repository [2]. The explanation of attributes [2] are shown as following:
|
1 2 3 4 5 6 7 8 9 10 11 12 13 14 |
vendor name: text (adviser, amdahl,apollo, basf, bti, burroughs, c.r.d, cambex, cdc, dec, dg, formation, four-phase, gould, honeywell, hp, ibm, ipl, magnuson, microdata, nas, ncr, nixdorf, perkin-elmer, prime, siemens, sperry, sratus, wang) Model Name: many unique symbols MYCT: machine cycle time in nanoseconds (integer) MMIN: minimum main memory in kilobytes (integer) MMAX: maximum main memory in kilobytes (integer) CACH: cache memory in kilobytes (integer) CHMIN: minimum channels in units (integer) CHMAX: maximum channels in units (integer) PRP: published relative performance (integer) ERP: estimated relative performance from the original article (integer) |
In this article, we just use some simple strategy when selecting and normalising variables, and hence, the estimated relative performance might not be too close to the original result. With regard to column 10 (ERP), Ein-Dor and Feldmesser have estimated the relative performance by using Linear Regression Model [3]. The result they have generated is much closer to the original one. If you are interested in achieving a better result, you can refer to their paper.
Prepare Data
The first thing we need to do is to prepare the data that we want to use the UCI repository [4]. You can go here to see what this data looks like. In this example, we need to create a cpuperformance table that shares the columns from the dataset. In the cpuperformance table, we have eight features (vendor_name, model_name, myct, mmin, mmax, cach, chmin, chmax) that we will be considering using in the future.
Create a new table
Open the Zeppelin page and copy the following code into a notebook.
|
1 2 3 4 5 6 7 8 9 10 11 12 13 14 15 16 17 |
%cassandra CREATE KEYSPACE features WITH REPLICATION={'class' : 'SimpleStrategy', 'replication_factor' : 1 }; Use features; CREATE TABLE cpuperformance ( AId uuid primary key, BVendor_name text, CModel_name text, DMYCT int, EMMIN int, FMMAX int, GCACH int, HCHMIN int, ICHMAX int, JPRP int, KERP int ); |
Due to the restriction of Cassandra, we have to create a table with an additional uuid column which will be identified as the primary key. The second thing is that Cassandra will reorder the place of the columns according to their alphabetical order [5], [6]. Since we need to retrieve data directly from the network and use Cassandra COPY to insert data, the data source will remain the same column order and we do not want to have a reordered table. The workaround we provide is to add an additional character that will align with alphabetical order.
Import the data from UCI data repository
- Open the terminal
Go to the folder that has been installed with cqlsh
cd apache-cassandra-3.11.0/bin - Check that cqlsh has the latest version:
|
1 |
cqlsh --version |
The result should be :
|
1 |
cqlsh 5.0.1 |
- Go to the Instaclustr console and check the public IP of your cluster.
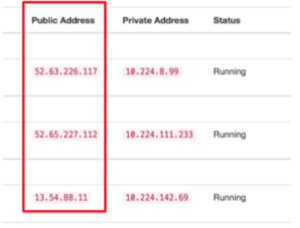
- Replace the <PUBLIC IP> with your real IP and provide your username and password, and execute the following command: (This command will work on Mac & Linux, probably not Windows)
|
1 |
curl https://archive.ics.uci.edu/ml/machine-learning-databases/cpu-performance/machine.data | awk '("uuidgen" | getline uuid) > 0 {print uuid ","$0} {close("uuidgen")}' | ./cqlsh <PUBLIC IP> --username=<USERNAME> --password=<PASSWORD> -e "COPY features.cpuperformance from stdin" |
In this command, we have accomplished three things: 1. Create a new column called UUID and generate UUID automatically. 2. Combine this UUID column with other columns. 3. Import the new dataset into Cassandra cpuperformance table.
Check that the data has been inserted correctly
Open the Zeppelin Notebook and copy the following code
|
1 2 3 |
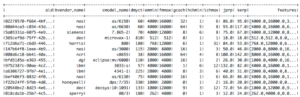
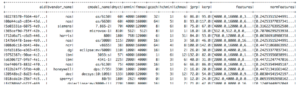
%cassandra select * from features.cpuperformance; |
The result should be as following:
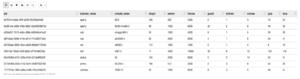
Given this prepared dataset, we can now start to train and test a model which can be used then to identify new data instances – typical regression problem.
Train and Test Model
In this section, we plan to use the linear regression algorithm to train the linear model. Before training, we need to select the suitable features that can be used for training and then transform those features in a way that can be accepted by Spark’s linear model. We also need to split our dataset into the training dataset and testing dataset. After training, we can print out the summary of the training result.
Load the dependency library
|
1 2 3 |
%dep z.load("/opt/zeppelin/interpreter/spark/spark-cassandra-connector-assembly-2.0.2.jar") |
Type or paste the following import statements
|
1 2 3 4 5 6 7 8 9 10 11 |
%spark import org.apache.spark.sql.SparkSession import org.apache.spark.sql.cassandra._ import com.datastax.spark.connector._ import com.datastax.spark.connector.cql._ import org.apache.spark.SparkContext import org.apache.spark.ml.regression.LinearRegression import org.apache.spark.ml.feature.Interaction import org.apache.spark.ml.feature.VectorAssembler import org.apache.spark.ml.feature.Normalizer |
Fetch all the data from the Cassandra database to Spark
|
1 2 3 4 5 |
%spark val df = spark.read.format("org.apache.spark.sql.cassandra") .options(Map("table" -> "cpuperformance", "keyspace" -> "features")).load() |
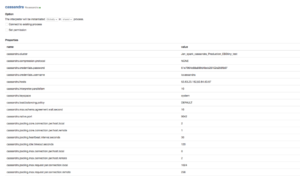
* If you type df.show() in the notebook, you can see the first 20 rows having been inserted in df.
By default, you do not need to explicitly configure the connection settings in your code. If you wish to make any changes to Cassandra connection configuration, you can go to the interpreter page and make the proper changes.
Create features input column
Before training the dataset, we need to prepare the required input columns, labelCol and the featuresCol. Their default name and type is “label”, “Double” and “features”, “Vector”. This means if the dataframe has already got columns with names of “label” and “features” and types of “Double” and “Vector”, you do not need to make any changes on the columns before training. Otherwise, you need to make the necessary changes. These required input columns and the output column are listed below [7]:
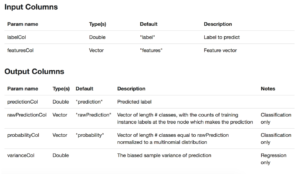
In this case, we need to select the proper features and put them together in a Vector, and we also need to point out that “jprp” is our label column.
With regard to variable selection, we finally decide to use these four best features: “emmin”,”fmmax”, “gcach”, “ichmax” according to wekaleamstudios’s research [8].
|
1 2 3 4 5 6 |
%spark val assembler1 = new VectorAssembler(). setInputCols(Array( "emmin","fmmax", "gcach", "ichmax")). setOutputCol("features"). transform(df) |
If you check the output of assembler1, you can see the following result:
|
1 2 3 |
%spark assembler1.show() |
We can normalise [9] the data so that we can have a better result. Execute the code below:
|
1 2 3 4 5 6 7 |
%spark val normalizer = new Normalizer() .setInputCol("features") .setOutputCol("normFeatures") .setP(2.0) .transform(assembler1) |
Function setP(2.0) [10] has ensured that Euclidean norm [11] will be conducted on features dataset.
If you check the output of normalizer, you can see the following result:
|
1 2 3 |
%spark normalizer.show() |
Split the dataset
|
1 2 |
// Split the data into training and test sets (30% held out for testing). val Array(trainingData, testData) = normalizer.randomSplit(Array(0.7, 0.3)) |
Fit the model and show the result
|
1 2 3 4 5 6 7 8 |
%spark val lr = new LinearRegression() .setLabelCol("jprp") .setFeaturesCol("normFeatures") .setMaxIter(10) .setRegParam(1.0) .setElasticNetParam(1.0) |
Since we do not have columns with names of “label” or “features”, we need to explicitly set them in the code. Function setLabelCol() and setFeaturesCol() are used to identify label column and features column, and these two columns will be used as the input in the process of data training.
In addition, when we consider types of regularization [12] we want to use, Lasso method will provide indirect functions of selecting variables [13], so we will set elastic net param as 1.0 [14] in order to activate Lasso method [15].
|
1 2 3 4 5 6 |
%spark // Fit the model val lrModel = lr.fit(trainingData) // print the output column and the input column lrModel.transform(testData).select("features","normFeatures", "jprp", "prediction").show() |
The result should be as following:
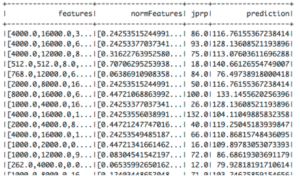
Some explanation of the output: “features” is the original input feature column; “normFeatures” is the one after normalisation; “jprp” is the label column; finally, “prediction” is the output column that has generated the predictable result.
Print out the summary of the model
|
1 2 3 4 |
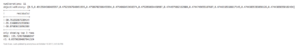
%spark // Print the coefficients and intercept for linear regression println(s"Coefficients: ${lrModel.coefficients} Intercept: ${lrModel.intercept}") |
![]()
|
1 2 3 4 5 6 7 8 9 |
%spark // Summarize the model over the training set and print out some metrics val trainingSummary = lrModel.summary println(s"numIterations: ${trainingSummary.totalIterations}") println(s"objectiveHistory: [${trainingSummary.objectiveHistory.mkString(",")}]") trainingSummary.residuals.show() println(s"RMSE: ${trainingSummary.rootMeanSquaredError}") println(s"r2: ${trainingSummary.r2}") |
References
[1] “MLlib: Main Guide – Spark 2.2.0 Documentation”, Spark.apache.org, 2017. [Online]. Available: https://spark.apache.org/docs/latest/ml-guide.html. [Accessed: 10- Oct- 2017].
[2] “UCI Machine Learning Repository: Computer Hardware Data Set”, Archive.ics.uci.edu, 2017. [Online]. Available: https://archive.ics.uci.edu/ml/datasets/Computer+Hardware. [Accessed: 10- Oct- 2017].
[3] P. Ein-Dor and J. Feldmesser, “Attributes of the performance of central processing units: A relative performance prediction model.”, Communications of the ACM, pp. 308-317, 1987.
[4] “Index of /ml/machine-learning-databases/cpu-performance”, Archive.ics.uci.edu, 2017. [Online]. Available: https://archive.ics.uci.edu/ml/machine-learning-databases/cpu-performance/. [Accessed: 10- Oct- 2017].
[5] “Understanding How CQL3 Maps to Cassandra’s Internal Data Structure”, OpenSource Connections, 2017. [Online]. Available: https://opensourceconnections.com/blog/2013/07/24/understanding-how-cql3-maps-to-cassandras-internal-data-structure/. [Accessed: 10- Oct- 2017].
[6] “Classification and regression – Spark 2.2.0 Documentation”, Spark.apache.org, 2017. [Online]. Available: https://spark.apache.org/docs/latest/ml-classification-regression.html. [Accessed: 10- Oct- 2017].
[7] “Variable selection using automatic methods « Software for Exploratory Data Analysis and Statistical Modelling – Statistical Modelling with R”, Wekaleamstudios.co.uk, 2017. [Online]. Available: https://www.wekaleamstudios.co.uk/posts/variable-selection-using-automatic-methods/. [Accessed: 10- Oct- 2017].
[8] “Database normalization”, En.wikipedia.org, 2017. [Online]. Available: https://en.wikipedia.org/wiki/Database_normalization. [Accessed: 10- Oct- 2017].
[9] “Norm (mathematics)”, En.wikipedia.org, 2017. [Online]. Available: https://en.wikipedia.org/wiki/Norm_%28mathematics%29#p-norm. [Accessed: 10- Oct- 2017].
[10] “Norm (mathematics)”, En.wikipedia.org, 2017. [Online]. Available: https://en.wikipedia.org/wiki/Norm_%28mathematics%29#Euclidean_norm. [Accessed: 10- Oct- 2017].
[11] “Elastic net regularization”, En.wikipedia.org, 2017. [Online]. Available: https://en.wikipedia.org/wiki/Elastic_net_regularization. [Accessed: 10- Oct- 2017].
[12] H. Zou and T. Hastie, Regularization and Variable Selection via the Elastic Net. California: Stanford University, 2017.
[13] Spark.apache.org, 2017. [Online]. Available: https://spark.apache.org/docs/latest/api/scala/index.html#org.apache.
spark.ml.regression.LinearRegression. [Accessed: 10- Oct- 2017].
[14] Spark.apache.org, 2017. [Online]. Available: https://spark.apache.org/docs/latest/api/scala/index.html#org.apache.
spark.ml.regression.LinearRegressionModel. [Accessed: 10- Oct- 2017].