Accessing Monitoring Information
Table of Contents
Accessing Monitoring from the Instaclustr Console
- To access monitoring tools, log into Instaclustr console.
- Click Monitoring from the sidebar menu of your Kafka cluster. This opens the cluster Monitoring page.
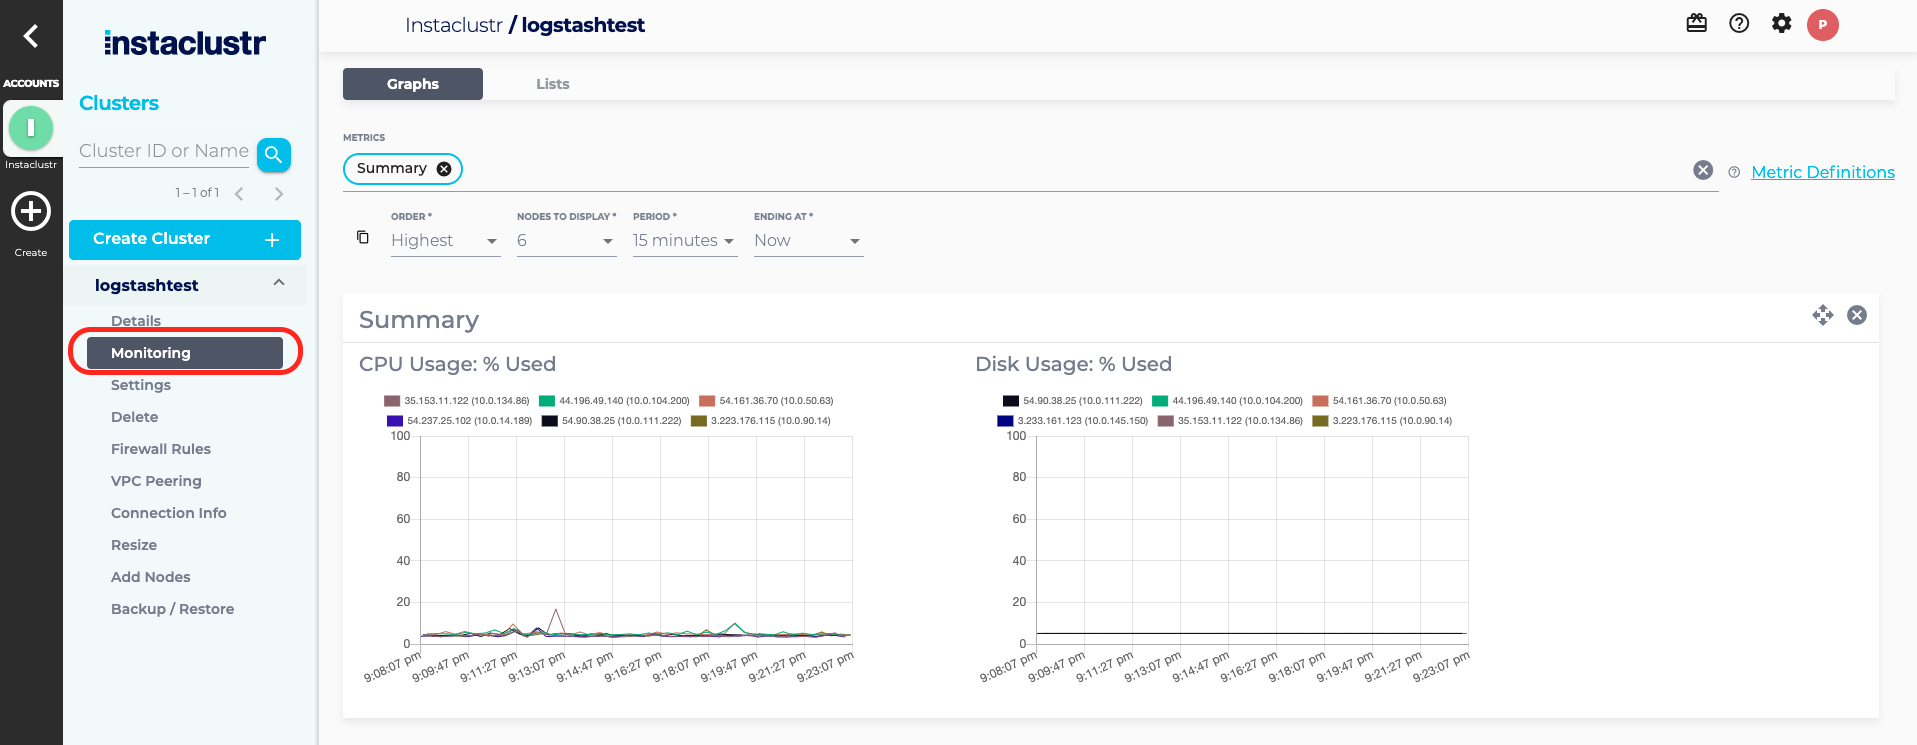
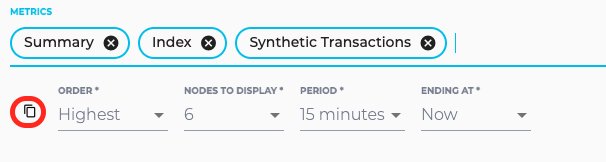
- The cluster Monitoring page displays monitoring information such as CPU and Disk usage for all the nodes in the cluster. The menu bar allows you to select a number of metric groups from a dropdown menu and to customise how you wish to view the selected metrics. Refer to our support article on The Monitoring Page for more information on the available features.
Accessing Monitoring from the API and Prometheus
For information on how to monitor a Kafka Cluster via the Instaclustr Monitoring API, refer to our support article on the Instaclustr Monitoring API.
Results returned when querying certain Prometheus endpoints may be limited to a defined threshold (for example, to avoid internal bottlenecks when collecting data or to avoid internal timeouts). Following metrics are impacted by limits:
- Consumer Lag – restricted to returning data on a unsorted subset of 150 consumer groups. For customers with more than 150 consumer groups, we advise using the equivalent monitoring API endpoint which isn’t similarly restricted.
Note: Our monitoring system collects all metrics every 20 seconds from Kafka. Events that occur for less than 20 seconds are therefore not captured.