Sending Instaclustr Metrics to New Relic via Prometheus
Instaclustr can send metrics collected from Instaclustr clusters to the New Relic One Observability platform via Prometheus. New Relic allows for the storing, monitoring and visualizing of metrics across multiple platforms.
To send the metrics to New Relic an intermediary Prometheus instance will be required. This instance must always be on to send data from Instaclustr to New Relic. The metrics that are available for use within New Relic are the same as offered through our Prometheus metrics endpoint.
Installing a Prometheus Server
Prometheus can be installed using Docker on a VPS, Kubernetes Cluster or AWS Elastic Beanstalk. For complete installation instructions see the Prometheus Installation Page for the Prometheus project. This support article doesn’t detail how to run a prometheus server as customers should consider their own cloud architecture to find the best solution, however Instaclustr has a number of blogs available which may also assist in setting up an intermediary Prometheus server:
- Instaclustr Monitoring with Prometheus
- Installing and Running Prometheus on Amazon Elastic Container Service
Configuring the Prometheus Server
Connecting to Instaclustr’s Prometheus endpoint
To ingest logs via Prometheus you must first collect data from our endpoint. To do this:
- On the Instaclustr Console, Go to Settings Cog > Account Settings > API Keys.
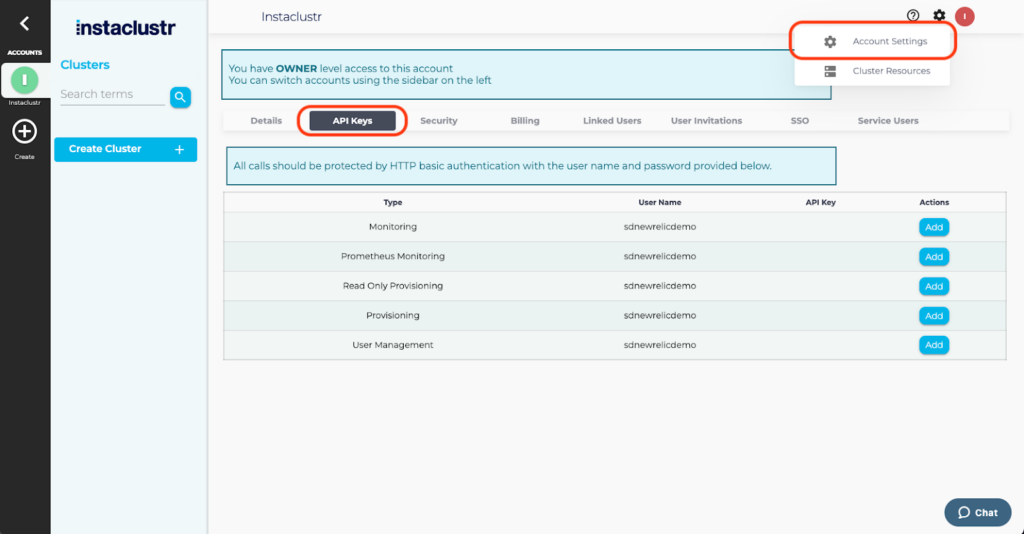
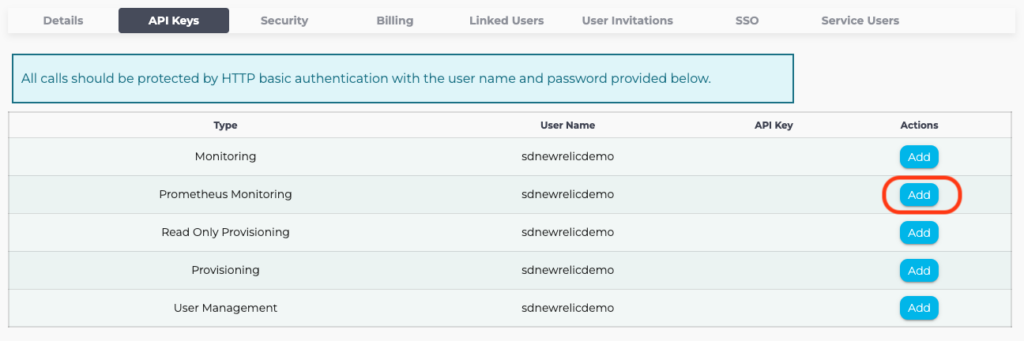
- Select Add to generate a Prometheus API key. Make sure to save the username and key in a safe place because for security reasons the key will not be accessible again.
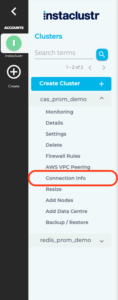
- Select which Cluster you wish to monitor from the left hand navigation, then select Connection Info. Note: if you wish to monitor all of this account’s clusters you can also follow this step.
- Scroll down to the Examples section and select the Prometheus tab.
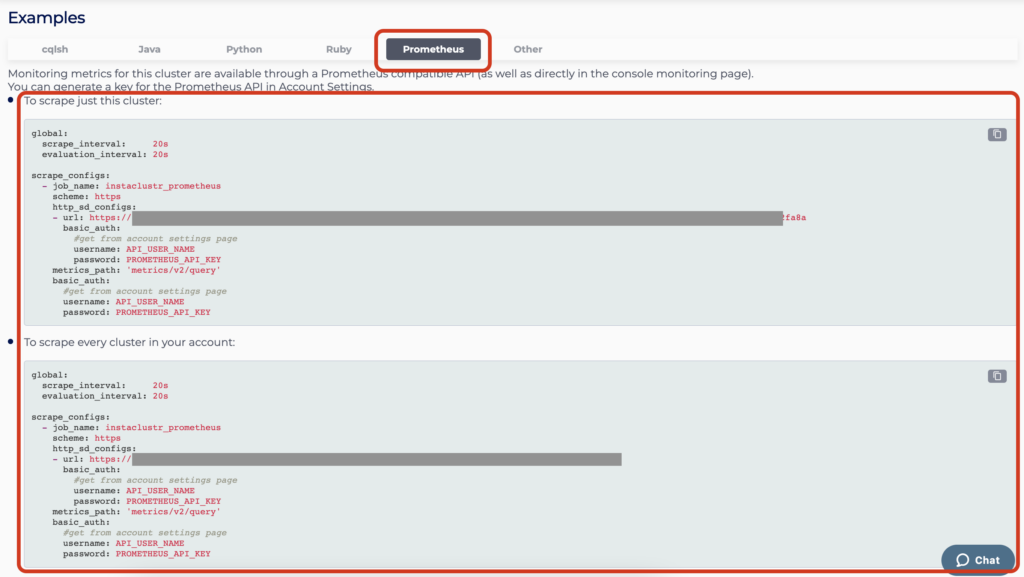
- Copy either the configuration details for a single cluster, or for all clusters in the account.
- Open the prometheus.yml configuration file which would have been created during the Prometheus installation.
- Replace the contents of the file with the configuration you just copied.
- The copied configuration has two basic_auth fields. Replace both of these with the API Username and API Key generated in step two.
- Save the configuration.yml file and then restart the Prometheus server.
Configure the Prometheus server to send to New Relic
The Prometheus server can now be configured to send to New Relic via a Prometheus configuration called Remote Write.
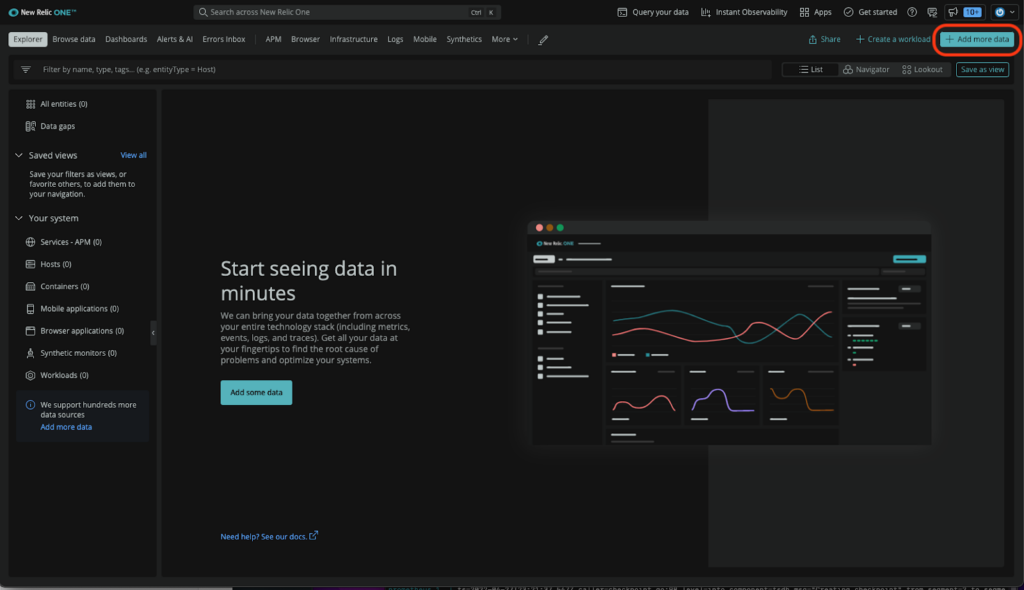
- Go to New Relic One and log in.
- Select the Add More Data button, then search for Prometheus.
- Follow the displayed steps to Generate a Remote Write URL.
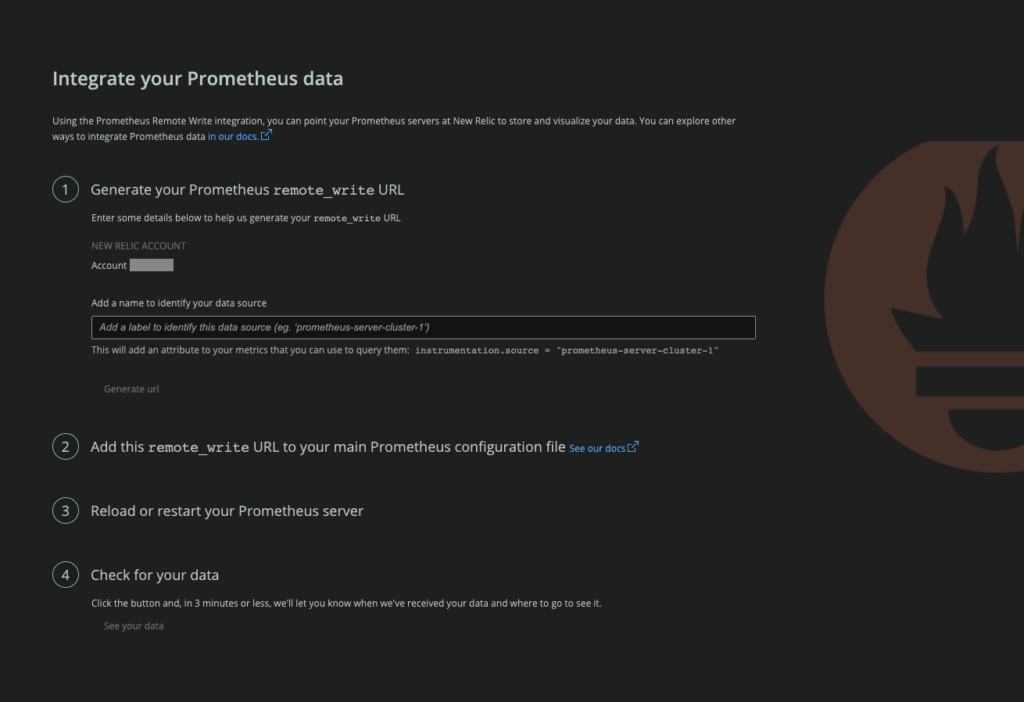
- Add the Remote Write configuration to the prometheus.yml configuration.
- Restart the Prometheus server.
If the previous steps were successful, after a few minutes you should be able to see your Instaclustr metrics in the New Relic One dashboard. To see the metrics:
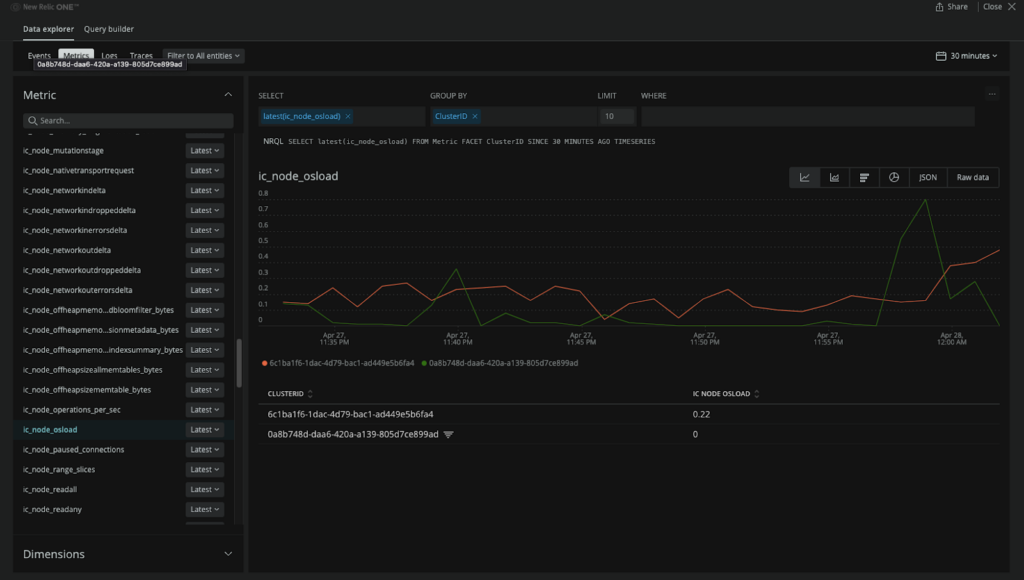
- Select Browse Data > Metrics, and scroll down to find the Metrics. They will begin with ic_metric_name.
- Use the GROUP BY filter to separate the metrics into node level using nodeID, or if you are monitoring more than one cluster, ClusterID. Some metrics will only show for a single cluster as they are specific to the application that is running.
The setup is now complete. From this point, you can now perform normal application performance monitoring on these metrics, configure alarms and create dashboards.