Viewing Application Logs
This article describes how to view the logs from the application running on your cluster, by using the Instaclustr Console. It assumes that you have already provisioned a cluster for your application.
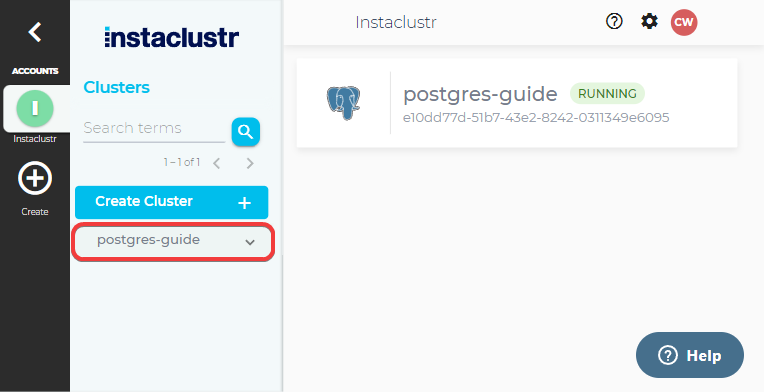
To get started, after signing into the console, click on the dropdown button of the cluster you want to access the logs for. This will reveal a list of different tasks that can be conducted on the cluster.
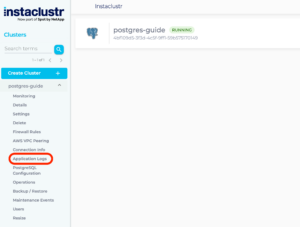
To access the logs, simply click on the Application Logs button that appears in the task list. This will take you to a page with a table of all the nodes in the cluster.
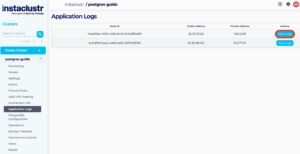
To view the logs of a specific node, click on the View Logs button in the corresponding row of the table.
This will load a page with a viewer allowing examination of the logs. If there is a need to reload the logs to check for new entries, this can be done by clicking on the Refresh Logs button.
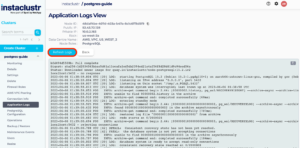
Note that the retrievable logs per node are limited to:
- The last 500 lines
- Approximately the last 7 days
That is all there is to viewing the application logs for nodes in your cluster! To view more details about each node, you can use the Details button under the cluster’s dropdown in the sidebar.
For further help, please contact Instaclustr Support.