Connecting to ClickHouse from Grafana
ClickHouse is designed for fast analytical queries. Data visualisation is typically handled through external tools. In this guide, we will show how you can use the official Grafana driver for ClickHouse to connect to your NetApp Instaclustr for ClickHouse cluster.
Before you begin, it is imperative to review the general steps and considerations for connecting to a ClickHouse cluster as outlined in Connecting to a ClickHouse Cluster.
Install the ClickHouse Plugin for Grafana
This installation step provides instructions for both Grafana Cloud and self-hosted Grafana installations. To learn more about Grafana’s ClickHouse plugin, see https://grafana.com/grafana/plugins/grafana-clickhouse-datasource/?tab=installation
If using Grafana Cloud
- Login to Grafana and launch your Grafana instance if not done already.
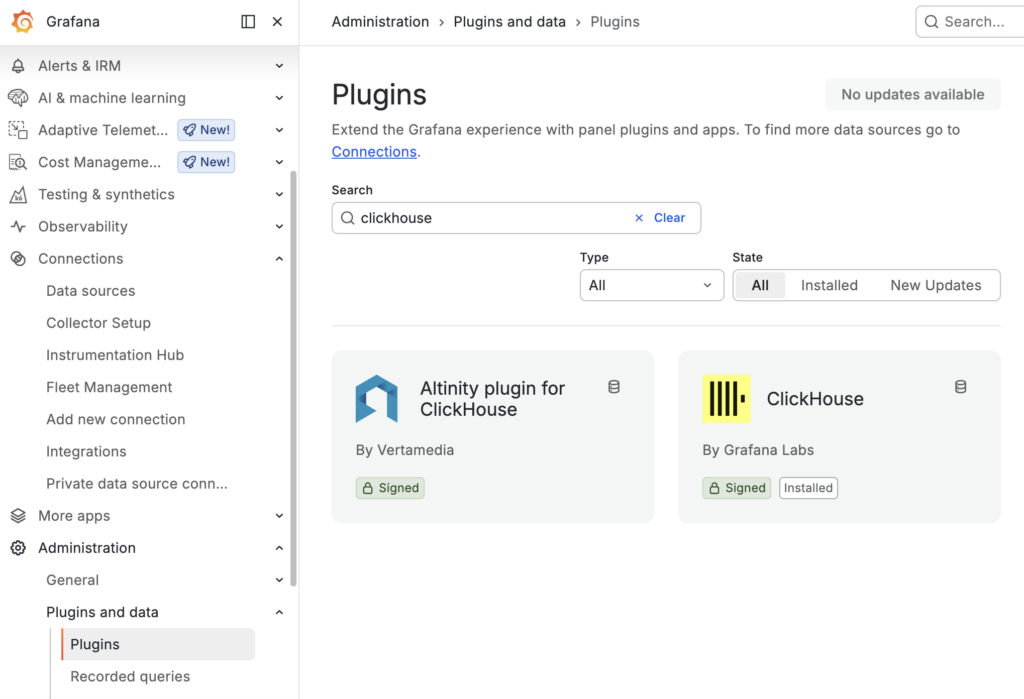
- On the Grafana instance’s main menu, scroll to the bottom and navigate to Administration > Plugins.
- Search for ClickHouse and install the plugin as illustrated below:
If using self-hosted Grafana
Use the grafana-cli tool included in the local Grafana download to install the ClickHouse plugin using the following command:
|
1 |
grafana-cli plugins install grafana-clickhouse-datasource |
Add Grafana IPs to NetApp Instaclustr ClickHouse cluster Allowlist
- Go to the NetApp Instaclustr Console and login to your account.
- Navigate to your cluster and then select Firewall Rules from the side menu.
- Add the IP addresses from your selected Grafana source into the firewall
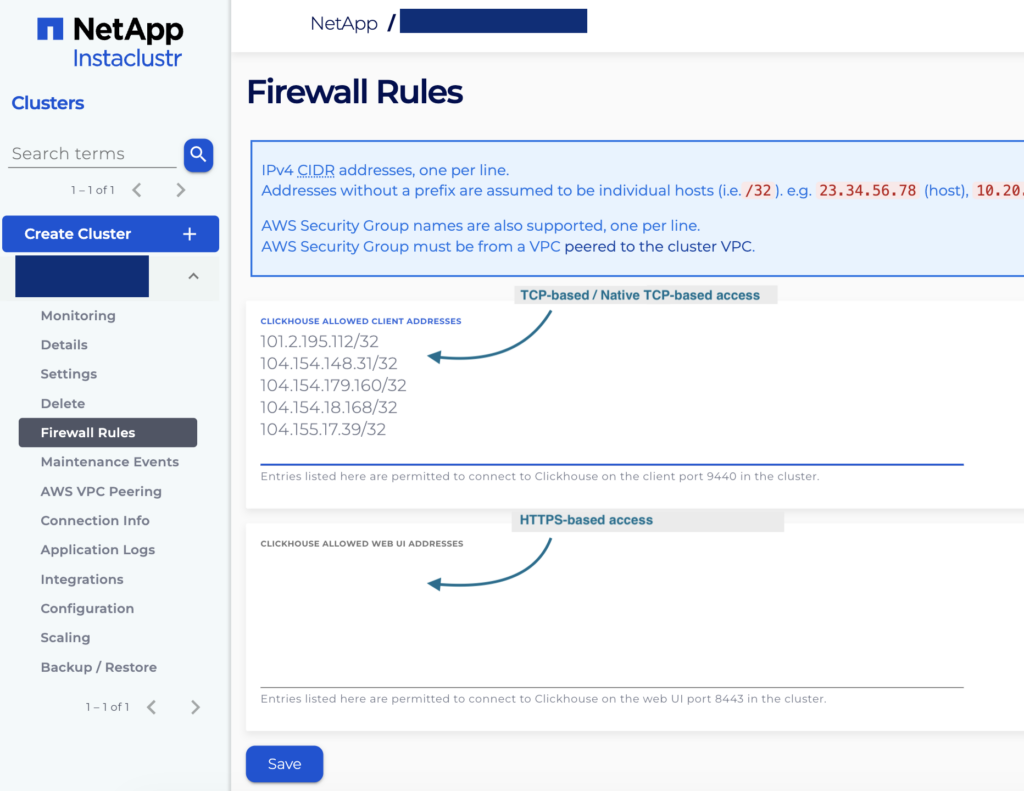
Note: You should add IP addresses on Web UI list for HTTPS based access, or Client list for TLS/Native TCP port access for Grafana- If using Grafana Cloud: Use the IP list in https://grafana.com/api/hosted-grafana/source-ips.txt
- If using self-hosted Grafana: Add the IP addresses that need access to your ClickHouse instance (e.g. your organization’s internal IP ranges or specific application server IPs)
- Wait for the firewall rule allowlist to be updated. Once completed, a green banner will appear in the console, indicating that the operation was successful.
Use Grafana to Configure the ClickHouse Cluster as a Data Source
- Navigate to your Grafana menu, then Connections > Data Sources.
- Click the blue + Add new data source button in the upper right.
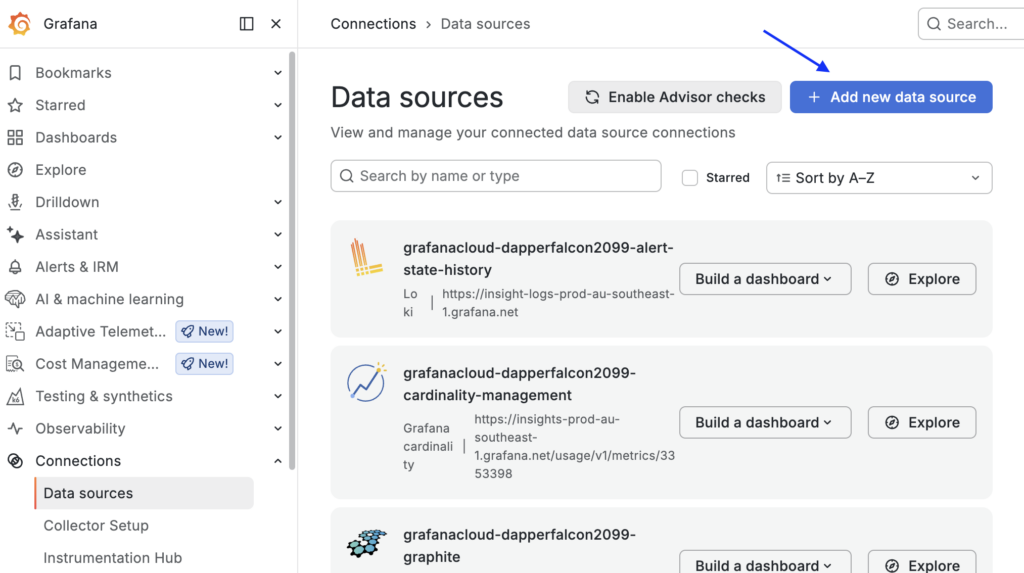
- Add ClickHouse from the list of available data sources.
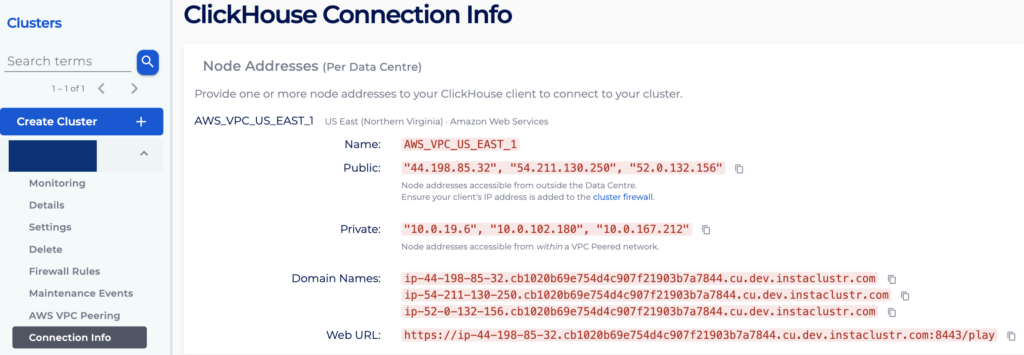
- You will be prompted to complete the connection details to establish a connection from Grafana to your Instaclustr for ClickHouse cluster. The connection details can be found in Instaclustr Console > your ClickHouse cluster > Connection Info tab.
- Server address: Copy from one of the Domain Names provided
- Server port:
- 8443 (HTTP)
- 9440 (Native)
- Username: create a read-only user within ClickHouse server
-
1CREATE USER grafana_user IDENTIFIED WITH sha256_password BY 'your password'; SET GLOBAL readonly = 1 FOR USER grafana_user;
- For details, see https://grafana.com/docs/plugins/grafana-clickhouse-datasource/latest/configure/#recommended-permissions.
-
- Password: Password for your read-only user
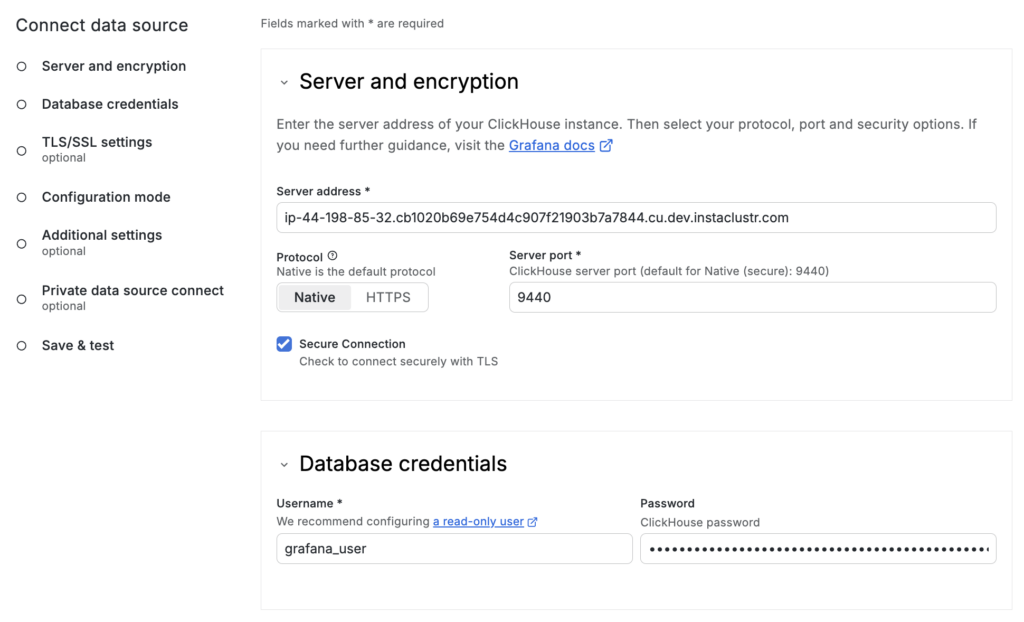
- Server address: Copy from one of the Domain Names provided
Click Save & Test to verify that the connection is operating successfully.
After setting up the data source, you will be able to create dashboards to visualise your ClickHouse data.
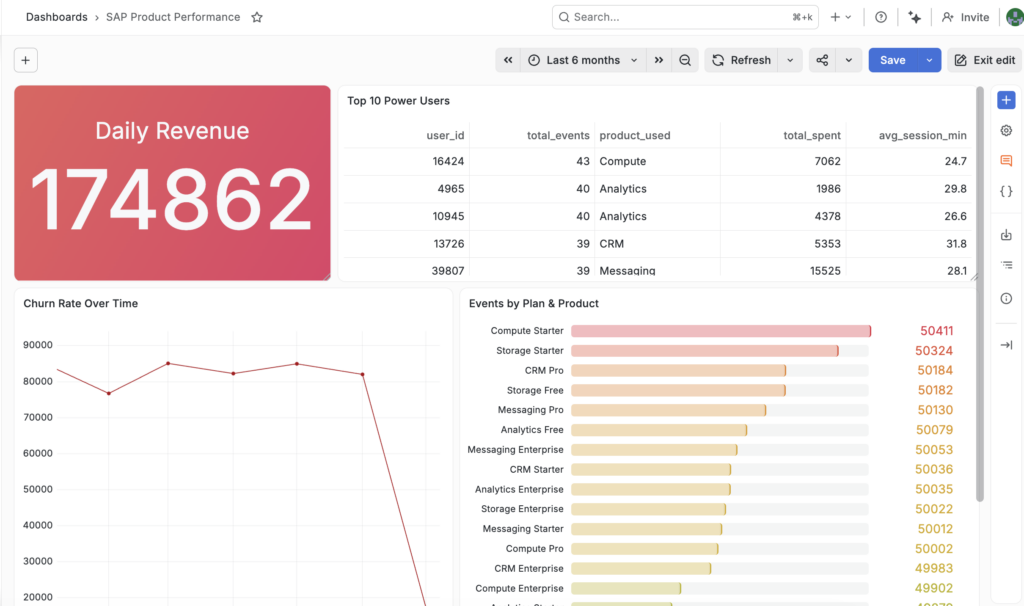
ClickHouse is built for fast analytical queries – integration with Grafana allows your team to leverage that without having to adopt another visualization platform. By connecting your NetApp Instaclustr for ClickHouse cluster as a Grafana data source, you can query managed ClickHouse data from the same dashboards, access controls, and operational workflows you already use for the rest of your stack.
Get started with NetApp Instaclustr for ClickHouse and explore managed ClickHouse in the NetApp Instaclustr Console today.